
1 Q3 2022 Redwood Review October 27, 2022 Exhibit 99.3
2 Forward-Looking Statements This presentation contains forward-looking statements, including statements regarding our 2022 forward outlook, statements related to available and potential sources of liquidity, estimates of upside and potential earnings in our investment portfolio from embedded discounts to par value on securities, and target yields and return on equity on investment opportunities. Forward-looking statements involve numerous risks and uncertainties. Our actual results may differ from our beliefs, expectations, estimates, and projections and, consequently, you should not rely on these forward-looking statements as predictions of future events. Forward-looking statements are not historical in nature and can be identified by words such as “anticipate,” “estimate,” “will,” “should,” “expect,” “believe,” “intend,” “seek,” “plan” and similar expressions or their negative forms, or by references to strategy, plans, or intentions. These forward-looking statements are subject to risks and uncertainties, including, among other things, those described in the Company’s Annual Report on Form 10-K for the year ended December 31, 2021 and any subsequent Quarterly Reports on Form 10-Q and Annual Reports on Form 10-K under the caption “Risk Factors.” Other risks, uncertainties, and factors that could cause actual results to differ materially from those projected may be described from time to time in reports the Company files with the Securities and Exchange Commission, including reports on Form 8-K. Additionally, this presentation contains estimates and information concerning our industry, including market size and growth rates of the markets in which we participate, that are based on industry publications and reports. This information involves many assumptions and limitations, and you are cautioned not to give undue weight to these estimates. We have not independently verified the accuracy or completeness of the data contained in these industry publications and reports. The industry in which we operate is subject to a high degree of uncertainty and risk due to a variety of factors, including those referred to above, that could cause results to differ materially from those expressed in these publications and reports.
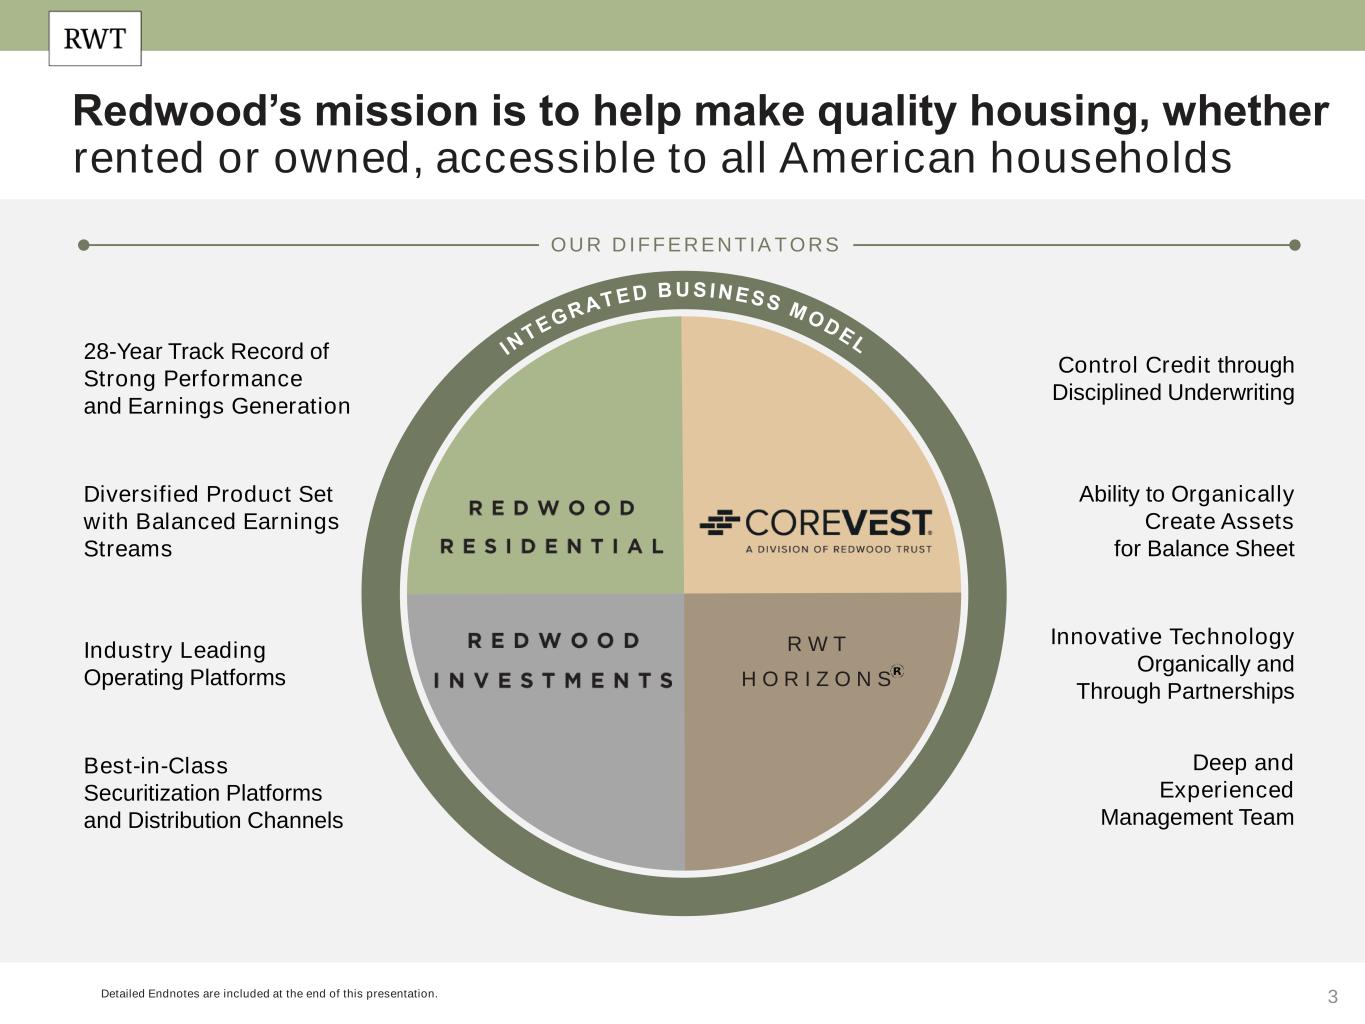
3 Redwood’s mission is to help make quality housing, whether rented or owned, accessible to all American households Detailed Endnotes are included at the end of this presentation. 28-Year Track Record of Strong Performance and Earnings Generation Diversified Product Set with Balanced Earnings Streams Industry Leading Operating Platforms Best-in-Class Securitization Platforms and Distribution Channels Control Credit through Disciplined Underwriting Ability to Organically Create Assets for Balance Sheet Innovative Technology Organically and Through Partnerships Deep and Experienced Management Team O U R D I FFER EN TIAT O R S R W T H O R I Z O N S

4Detailed Endnotes are included at the end of this presentation. Redwood Operates Across Three Complementary Business Lines Redwood’s business model is geared toward providing strategic capital for sustainable innovation in housing finance Residential Mortgage Banking Business Purpose Mortgage Banking Investment Portfolio Strategy / Overview ~$300bn ~$7bn~$100bn (Single Family Rental + Multifamily) 81%9% 10% % of Total Allocated Capital(1) Annual Market Opportunity(2) Organically Created Assets (RMBS and BPL loans), Third-Party Assets (RPLs, HEI, CRT, Multifamily Securities) Prime Jumbo, Expanded Prime Jumbo and Non-QM Loans SFR (Term) & Bridge (Multifamily, Build/Renovate to Rent, Fix & Flip) Products Market leading non-Agency correspondent platform serving 150+ bank and non-bank originators Includes assets organically created through mortgage banking activities and investments sourced through partnerships and third-parties Leading direct life-cycle lender to single-family and multifamily housing investors; single family rental (“SFR”) and bridge loans
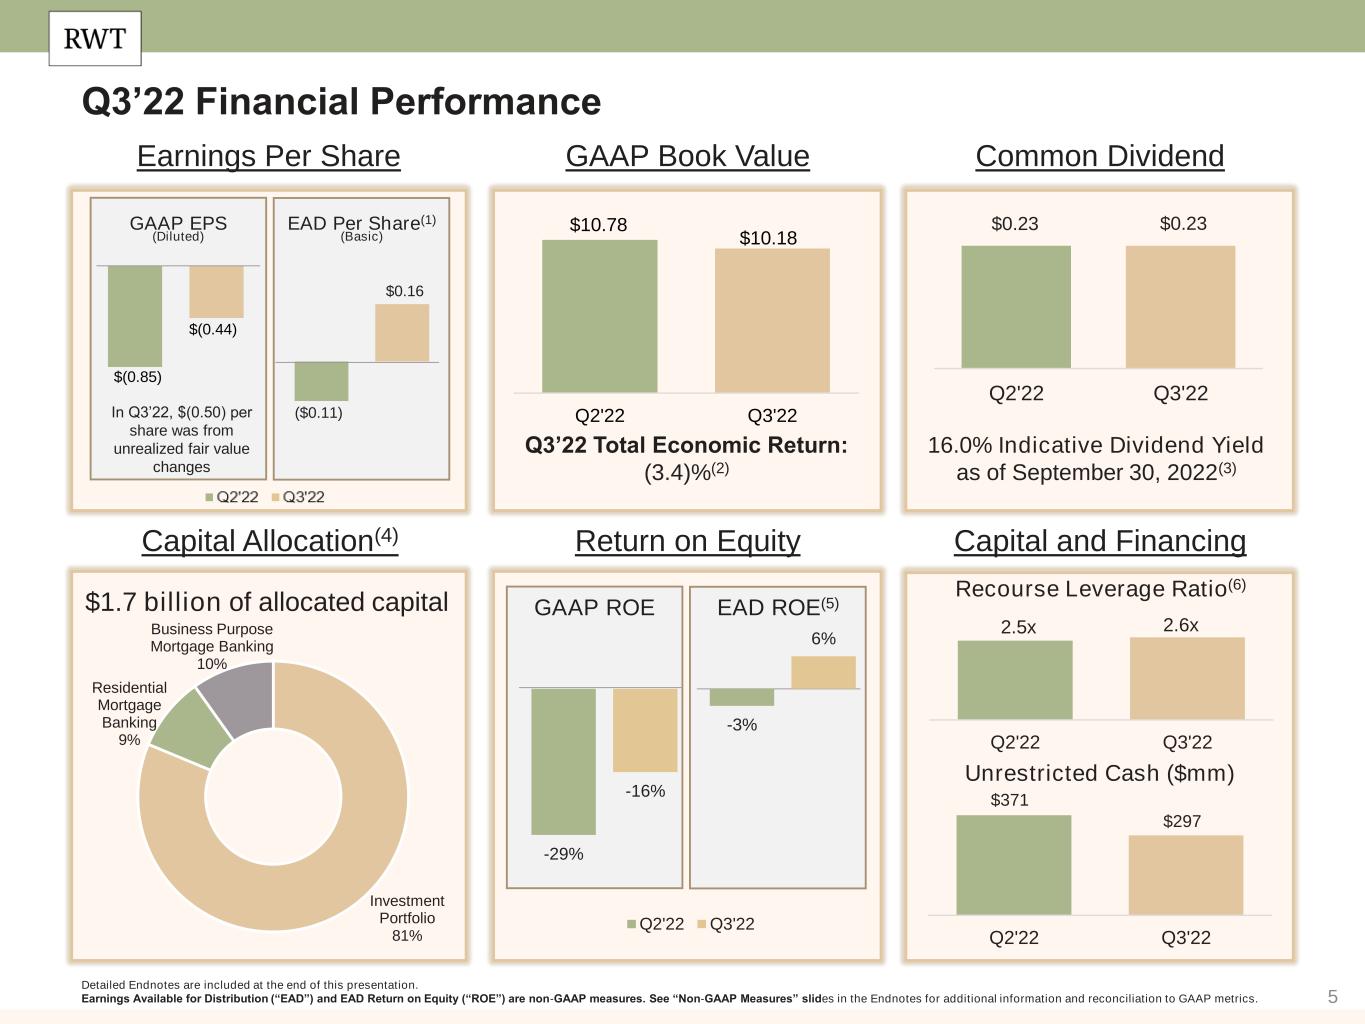
5 Q3’22 Financial Performance $1.7 billion of allocated capital Detailed Endnotes are included at the end of this presentation. Earnings Available for Distribution (“EAD”) and EAD Return on Equity (“ROE”) are non-GAAP measures. See “Non-GAAP Measures” slides in the Endnotes for additional information and reconciliation to GAAP metrics. Earnings Per Share GAAP Book Value Common Dividend Capital Allocation(4) Return on Equity Capital and Financing Recourse Leverage Ratio(6) Unrestricted Cash ($mm) Q3’22 Total Economic Return: (3.4)%(2) 16.0% Indicative Dividend Yield as of September 30, 2022(3) GAAP ROE EAD ROE(5) $10.78 $10.18 Q2'22 Q3'22 $0.23 $0.23 Q2'22 Q3'22 2.5x 2.6x Q2'22 Q3'22 $371 $297 Q2'22 Q3'22 ($0.11) $0.16 $(0.85) $(0.44) In Q3’22, $(0.50) per share was from unrealized fair value changes GAAP EPS (Diluted) EAD Per Share(1) (Basic) -29% -3% -16% 6% Q2'22 Q3'22 Investment Portfolio 81% Residential Mortgage Banking 9% Business Purpose Mortgage Banking 10%
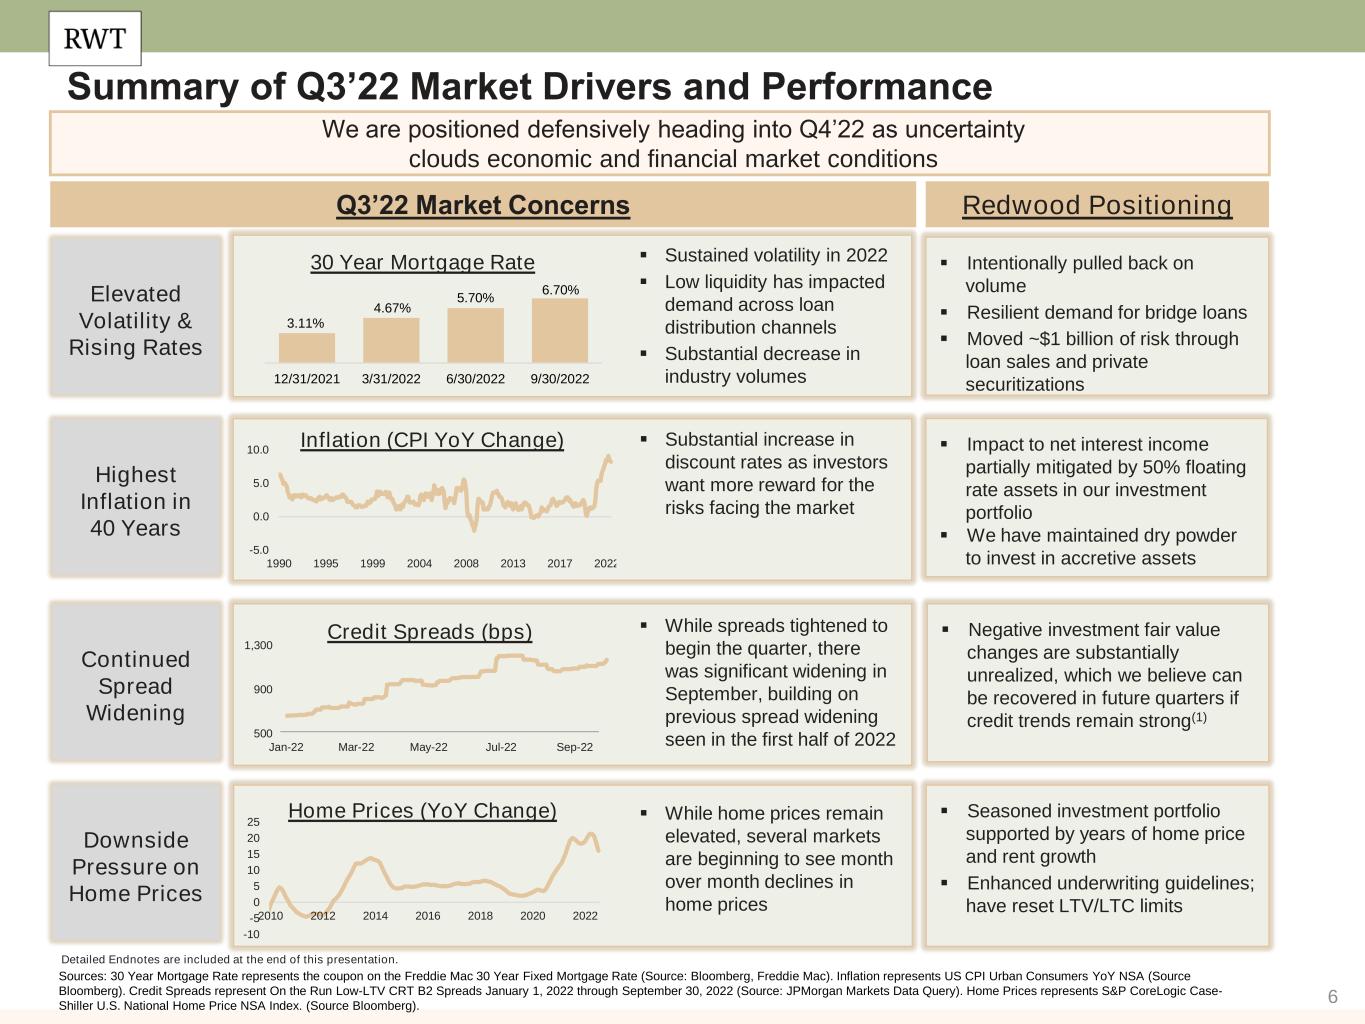
6 ▪ Negative investment fair value changes are substantially unrealized, which we believe can be recovered in future quarters if credit trends remain strong(1) ▪ Seasoned investment portfolio supported by years of home price and rent growth ▪ Enhanced underwriting guidelines; have reset LTV/LTC limits Summary of Q3’22 Market Drivers and Performance We are positioned defensively heading into Q4’22 as uncertainty clouds economic and financial market conditions Q3’22 Market Concerns Continued Spread Widening Downside Pressure on Home Prices Credit Spreads (bps) Home Prices (YoY Change) Elevated Volatility & Rising Rates Highest Inflation in 40 Years 30 Year Mortgage Rate ▪ Intentionally pulled back on volume ▪ Resilient demand for bridge loans ▪ Moved ~$1 billion of risk through loan sales and private securitizations Redwood Positioning Sources: 30 Year Mortgage Rate represents the coupon on the Freddie Mac 30 Year Fixed Mortgage Rate (Source: Bloomberg, Freddie Mac). Inflation represents US CPI Urban Consumers YoY NSA (Source Bloomberg). Credit Spreads represent On the Run Low-LTV CRT B2 Spreads January 1, 2022 through September 30, 2022 (Source: JPMorgan Markets Data Query). Home Prices represents S&P CoreLogic Case- Shiller U.S. National Home Price NSA Index. (Source Bloomberg). ▪ Sustained volatility in 2022 ▪ Low liquidity has impacted demand across loan distribution channels ▪ Substantial decrease in industry volumes ▪ Substantial increase in discount rates as investors want more reward for the risks facing the market ▪ While spreads tightened to begin the quarter, there was significant widening in September, building on previous spread widening seen in the first half of 2022 ▪ While home prices remain elevated, several markets are beginning to see month over month declines in home prices 3.11% 4.67% 5.70% 6.70% 12/31/2021 3/31/2022 6/30/2022 9/30/2022 500 900 1,300 Jan-22 Mar-22 May-22 Jul-22 Sep-22 ▪ Impact to net interest income partially mitigated by 50% floating rate assets in our investment portfolio ▪ We have maintained dry powder to invest in accretive assets Inflation (CPI YoY Change) -5.0 0.0 5.0 10.0 1990 1995 1999 2004 2008 2013 2017 2022 Detailed Endnotes are included at the end of this presentation. -10 -5 0 5 10 15 20 25 2010 2012 2014 2016 2018 2020 2022
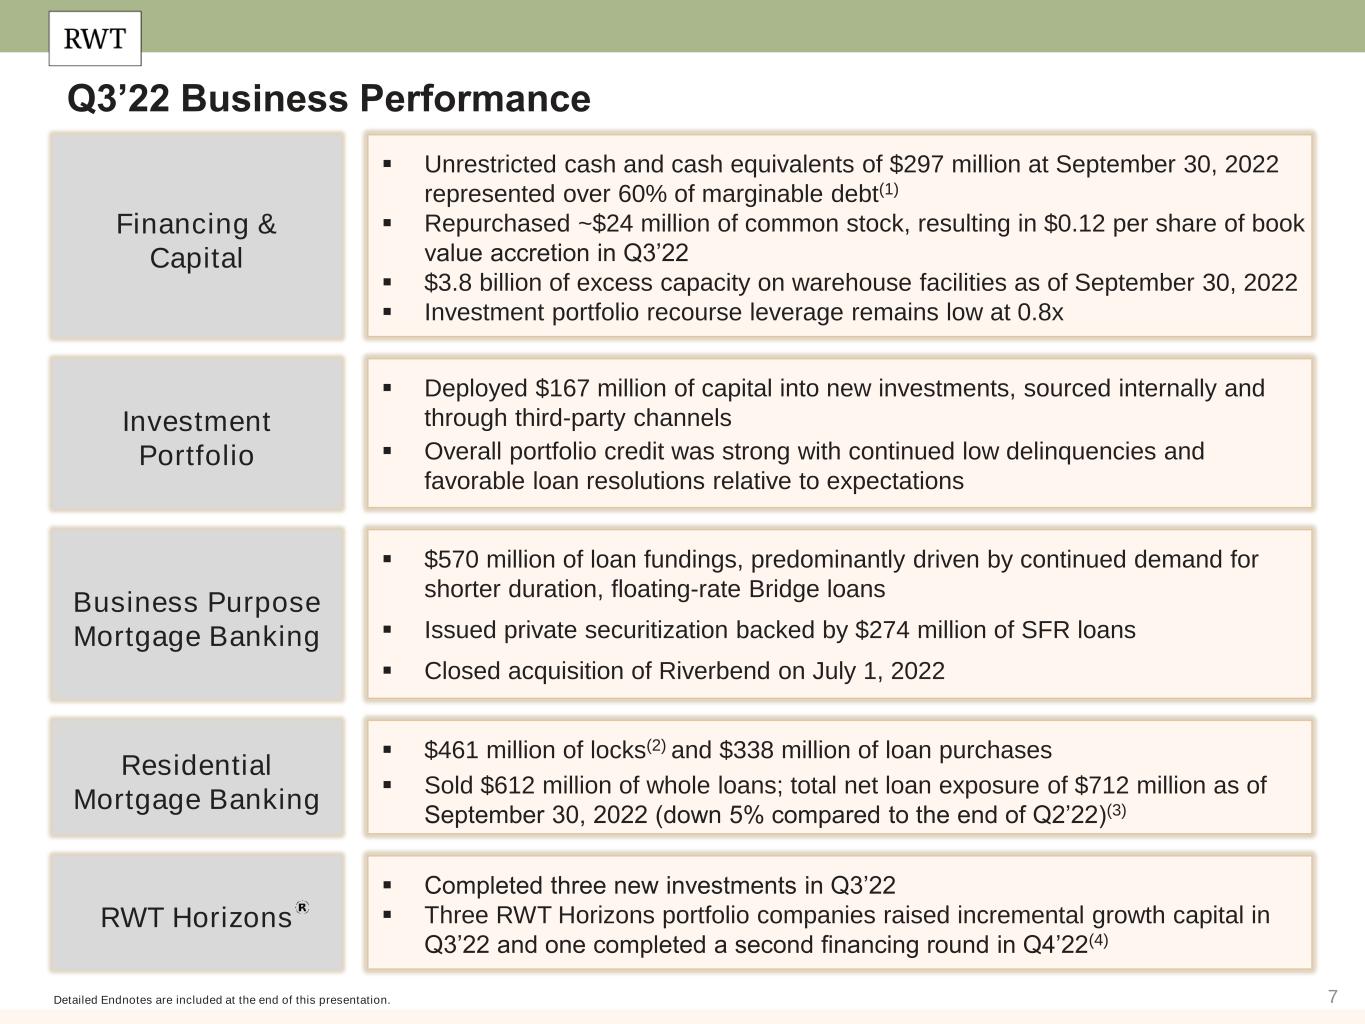
7 Q3’22 Business Performance Detailed Endnotes are included at the end of this presentation. ▪ $461 million of locks(2) and $338 million of loan purchases ▪ Sold $612 million of whole loans; total net loan exposure of $712 million as of September 30, 2022 (down 5% compared to the end of Q2’22)(3) Residential Mortgage Banking ▪ Completed three new investments in Q3’22 ▪ Three RWT Horizons portfolio companies raised incremental growth capital in Q3’22 and one completed a second financing round in Q4’22(4) RWT Horizons ▪ $570 million of loan fundings, predominantly driven by continued demand for shorter duration, floating-rate Bridge loans ▪ Issued private securitization backed by $274 million of SFR loans ▪ Closed acquisition of Riverbend on July 1, 2022 Business Purpose Mortgage Banking ▪ Deployed $167 million of capital into new investments, sourced internally and through third-party channels ▪ Overall portfolio credit was strong with continued low delinquencies and favorable loan resolutions relative to expectations Investment Portfolio ▪ Unrestricted cash and cash equivalents of $297 million at September 30, 2022 represented over 60% of marginable debt(1) ▪ Repurchased ~$24 million of common stock, resulting in $0.12 per share of book value accretion in Q3’22 ▪ $3.8 billion of excess capacity on warehouse facilities as of September 30, 2022 ▪ Investment portfolio recourse leverage remains low at 0.8x Financing & Capital
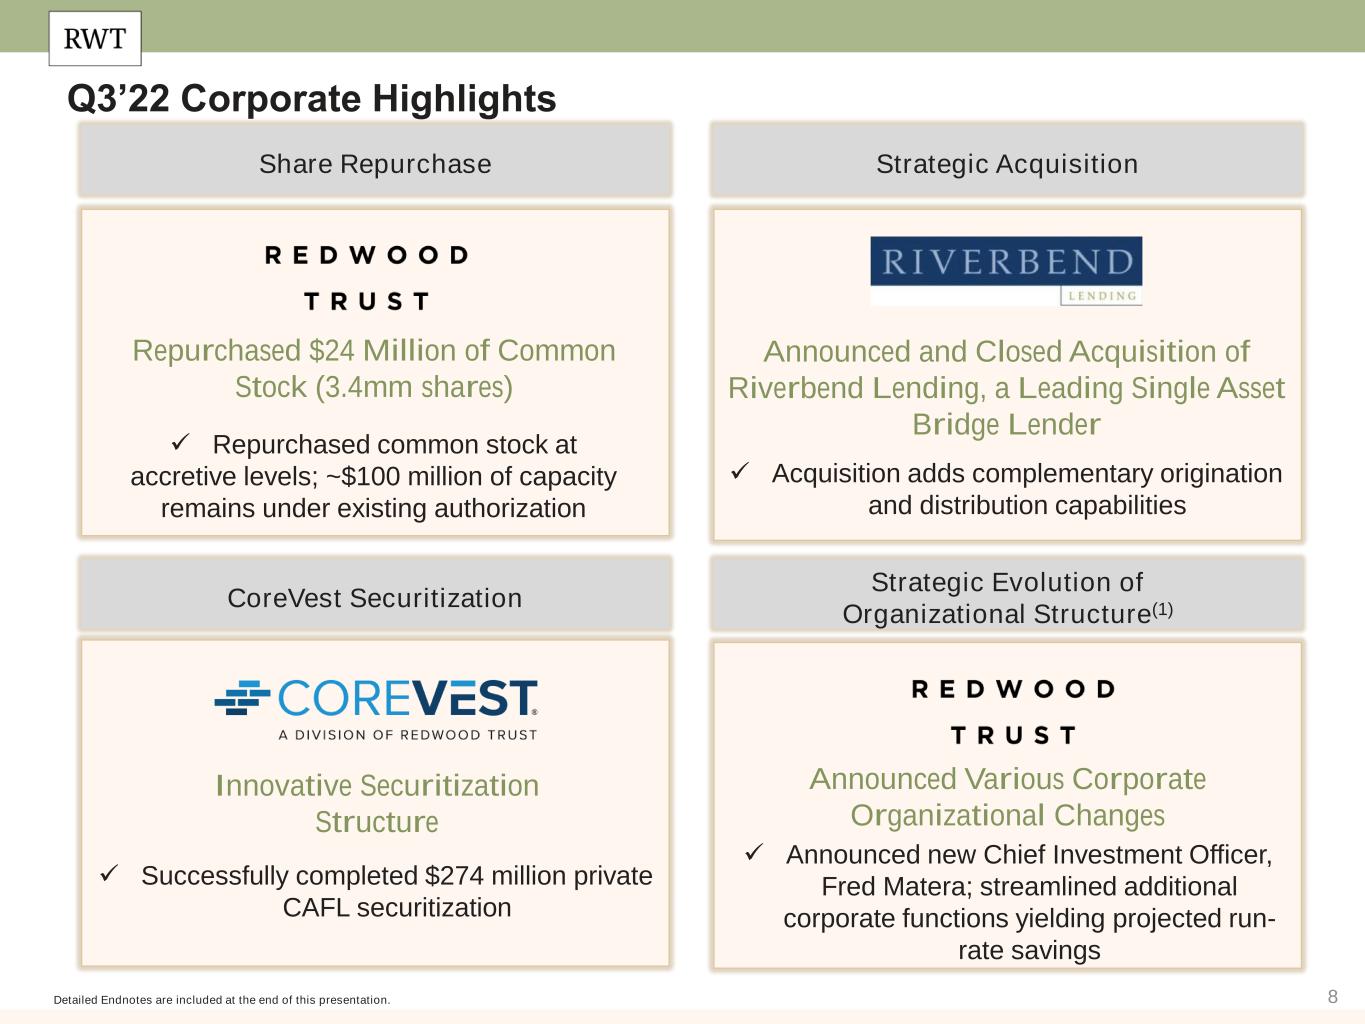
8 Q3’22 Corporate Highlights Detailed Endnotes are included at the end of this presentation. Strategic Evolution of Organizational Structure(1) Strategic Acquisition CoreVest Securitization Innovative Securitization Structure Announced and Closed Acquisition of Riverbend Lending, a Leading Single Asset Bridge Lender Announced Various Corporate Organizational Changes ✓ Announced new Chief Investment Officer, Fred Matera; streamlined additional corporate functions yielding projected run- rate savings ✓ Acquisition adds complementary origination and distribution capabilities ✓ Successfully completed $274 million private CAFL securitization Share Repurchase Repurchased $24 Million of Common Stock (3.4mm shares) ✓ Repurchased common stock at accretive levels; ~$100 million of capacity remains under existing authorization
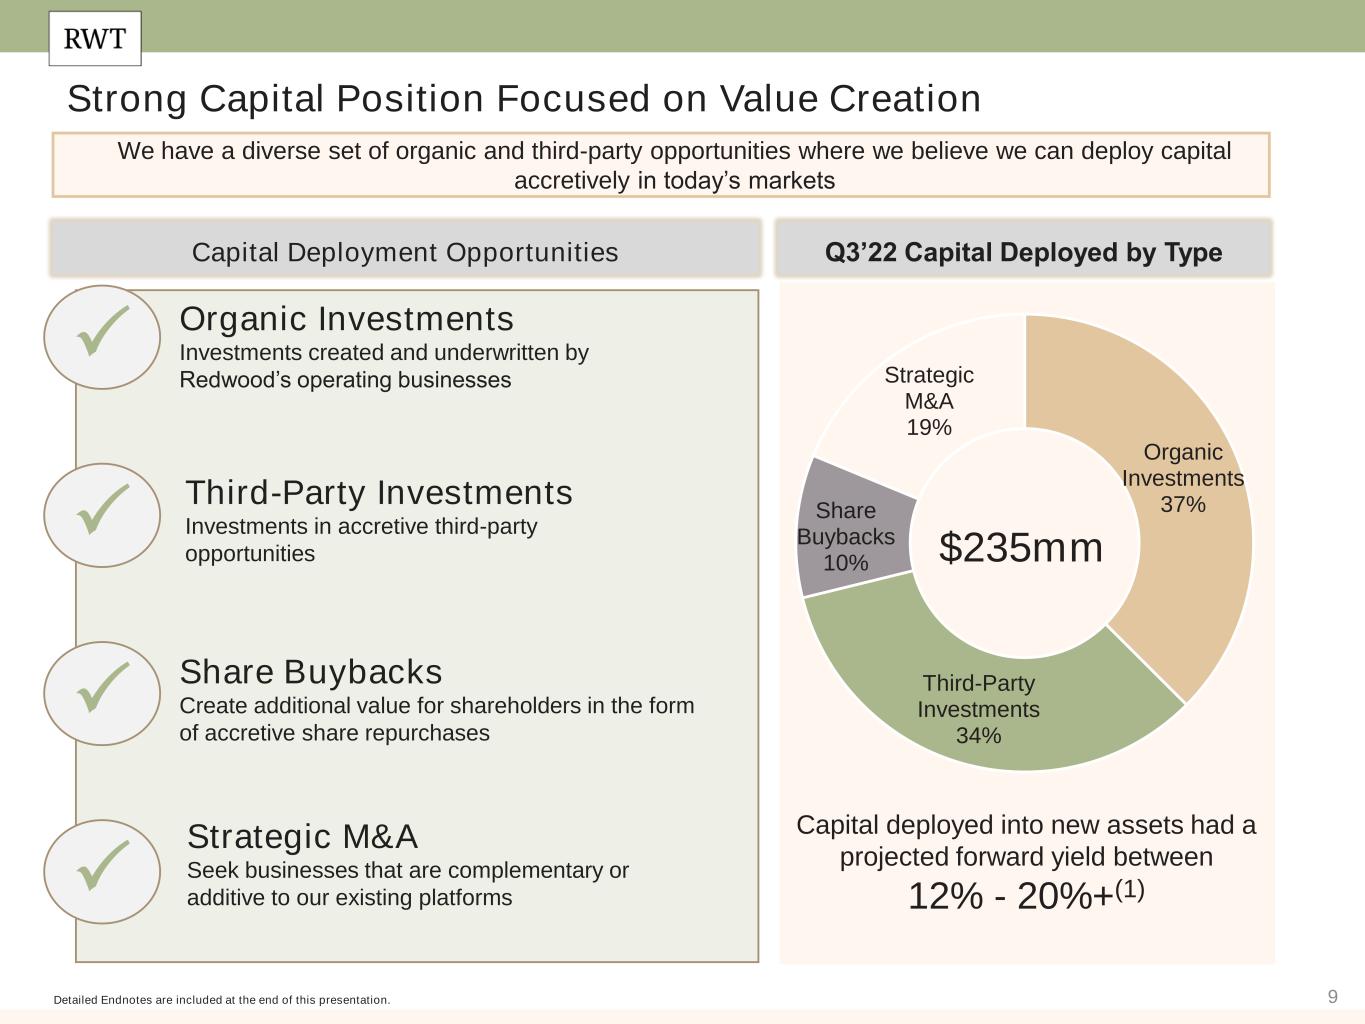
9 Strong Capital Position Focused on Value Creation Detailed Endnotes are included at the end of this presentation. We have a diverse set of organic and third-party opportunities where we believe we can deploy capital accretively in today’s markets P P P P Capital Deployment Opportunities Organic Investments Investments created and underwritten by Redwood’s operating businesses Third-Party Investments Investments in accretive third-party opportunities Share Buybacks Create additional value for shareholders in the form of accretive share repurchases Strategic M&A Seek businesses that are complementary or additive to our existing platforms Q3’22 Capital Deployed by Type $235mm Capital deployed into new assets had a projected forward yield between 12% - 20%+(1) Organic Investments 37% Third-Party Investments 34% Share Buybacks 10% Strategic M&A 19%
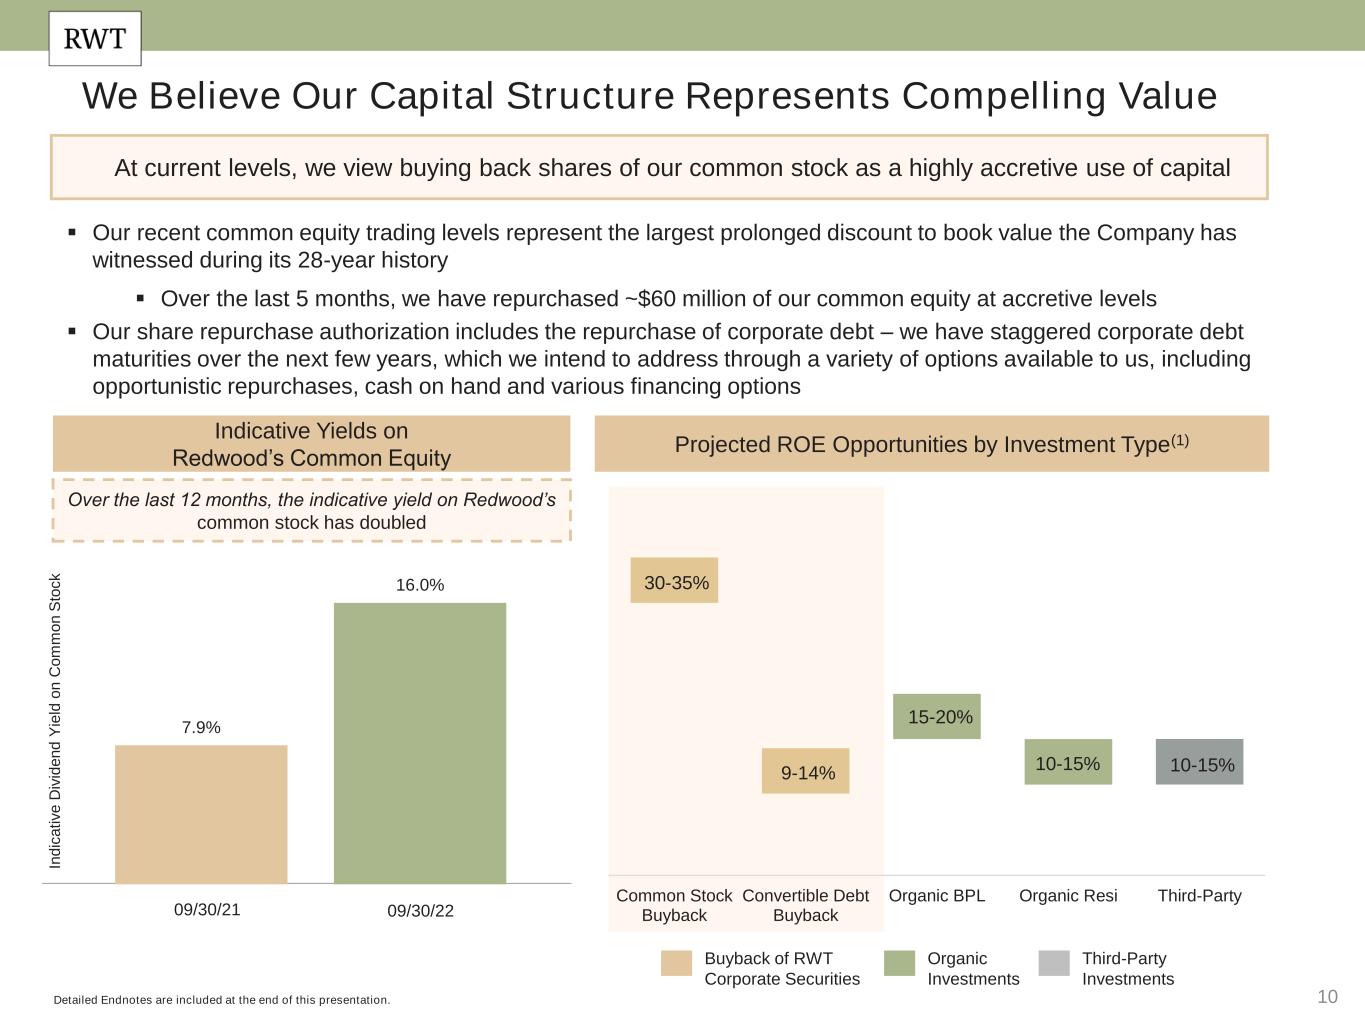
10 Common Stock Buyback Convertible Debt Buyback Organic BPL Organic Resi Third-Party 30-35% We Believe Our Capital Structure Represents Compelling Value Indicative Yields on Redwood’s Common Equity Projected ROE Opportunities by Investment Type(1) At current levels, we view buying back shares of our common stock as a highly accretive use of capital Detailed Endnotes are included at the end of this presentation. Over the last 12 months, the indicative yield on Redwood’s common stock has doubled Buyback of RWT Corporate Securities Organic Investments Third-Party Investments 15-20% 10-15% 10-15% 09/30/21 09/30/22 9-14% 7.9% 16.0% In d ic a ti v e D iv id e n d Y ie ld o n C o m m o n S to c k ▪ Our recent common equity trading levels represent the largest prolonged discount to book value the Company has witnessed during its 28-year history ▪ Over the last 5 months, we have repurchased ~$60 million of our common equity at accretive levels ▪ Our share repurchase authorization includes the repurchase of corporate debt – we have staggered corporate debt maturities over the next few years, which we intend to address through a variety of options available to us, including opportunistic repurchases, cash on hand and various financing options
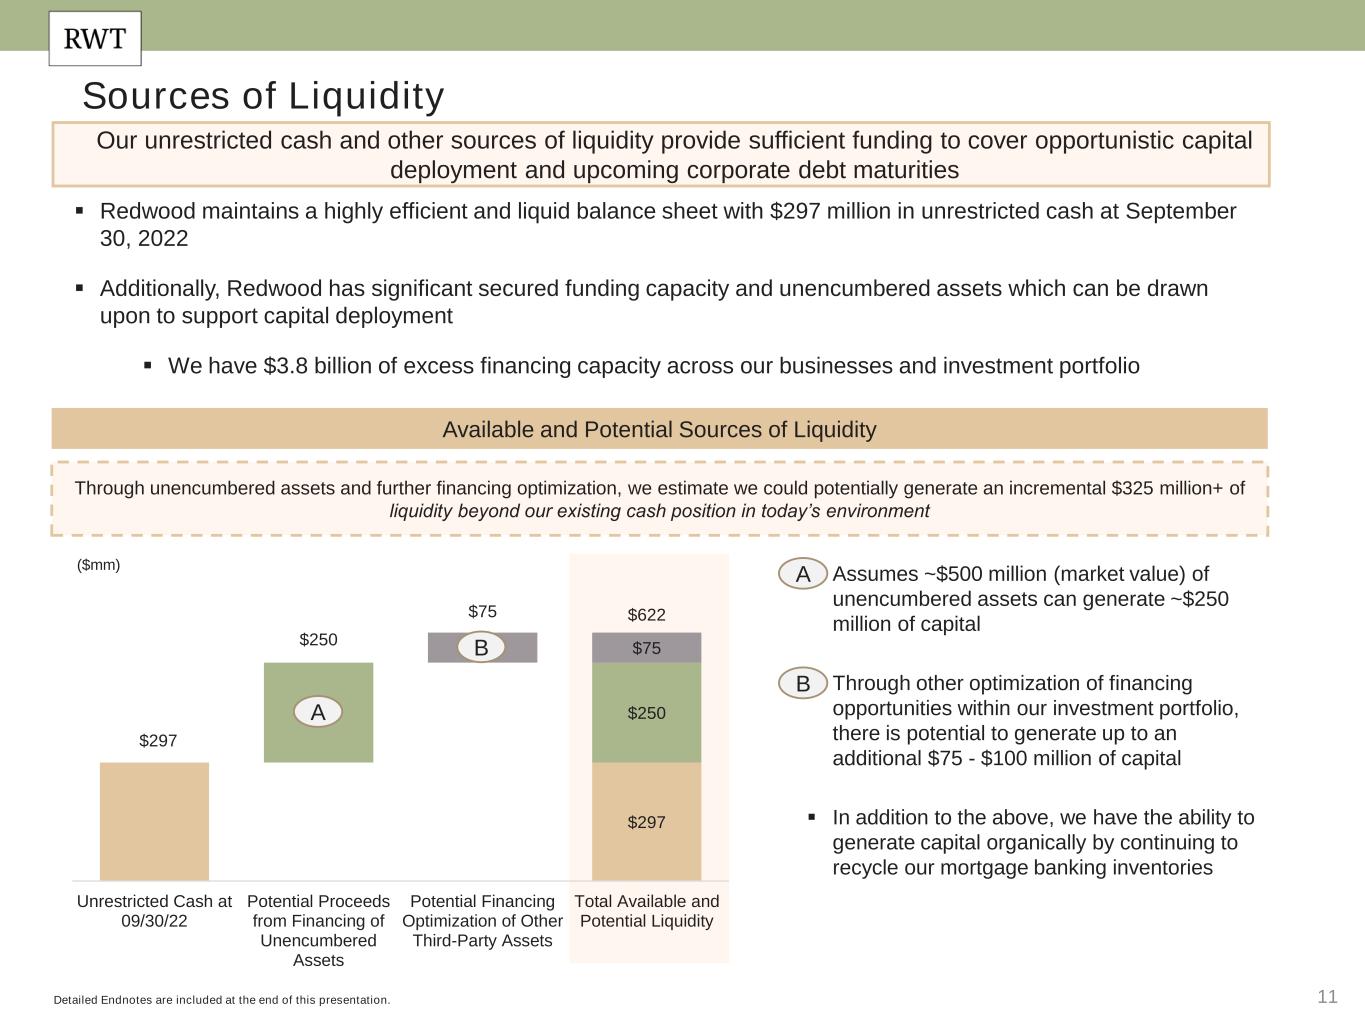
11 $297 $297 $250 $250 $75 $75 $622 Unrestricted Cash at 09/30/22 Potential Proceeds from Financing of Unencumbered Assets Potential Financing Optimization of Other Third-Party Assets Total Available and Potential Liquidity Sources of Liquidity Available and Potential Sources of Liquidity ▪ Assumes ~$500 million (market value) of unencumbered assets can generate ~$250 million of capital ▪ Through other optimization of financing opportunities within our investment portfolio, there is potential to generate up to an additional $75 - $100 million of capital ▪ In addition to the above, we have the ability to generate capital organically by continuing to recycle our mortgage banking inventories Our unrestricted cash and other sources of liquidity provide sufficient funding to cover opportunistic capital deployment and upcoming corporate debt maturities Detailed Endnotes are included at the end of this presentation. Through unencumbered assets and further financing optimization, we estimate we could potentially generate an incremental $325 million+ of liquidity beyond our existing cash position in today’s environment ($mm) ▪ Redwood maintains a highly efficient and liquid balance sheet with $297 million in unrestricted cash at September 30, 2022 ▪ Additionally, Redwood has significant secured funding capacity and unencumbered assets which can be drawn upon to support capital deployment ▪ We have $3.8 billion of excess financing capacity across our businesses and investment portfolio A B A B

12 Conservative Leverage Profile Redwood has consistently maintained a conservative leverage posture across our operating businesses and investment portfolio Q3’22 Recourse Leverage(1) Detailed Endnotes are included at the end of this presentation. ▪ We maintain a conservative leverage posture ▪ While leverage in our mortgage banking businesses is higher than in our Investment Portfolio, we generally turn mortgage banking capital over quickly ▪ Our total recourse leverage is less than half the mREIT peer average(1)(2) ▪ Throughout 2022, we have been successful in both establishing new financing lines and upsizing or extending existing lines ▪ In Q3’22, we successfully increased or extended warehouse lines representing $300 million of capacity for the Residential Mortgage Banking business and initiated a new warehouse line to support BPL originations Redwood Q3’22 mREIT Peers(2) 2.5x 4.0x 0.8x 0.4x 2.6x 5.8x BPL Mortgage Banking Residential Mortgage Banking Investment Portfolio Corporate Total RWT Peer Average Agency Range Hybrid Range 7.2x-8.7x 0.7x-7.1x
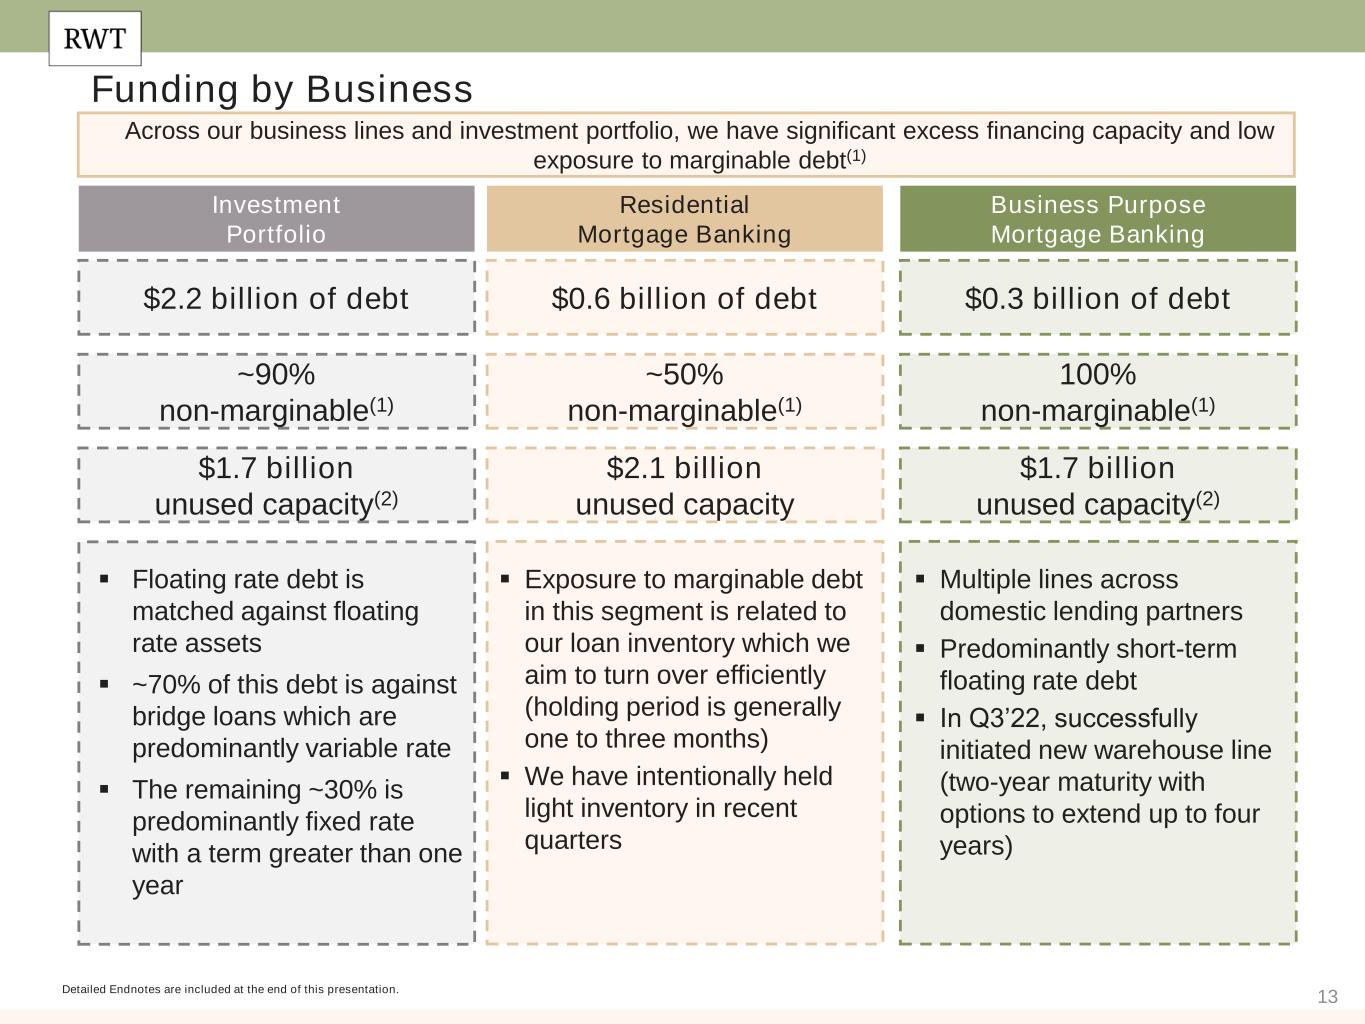
13 Funding by Business Across our business lines and investment portfolio, we have significant excess financing capacity and low exposure to marginable debt(1) Detailed Endnotes are included at the end of this presentation. Investment Portfolio Residential Mortgage Banking Business Purpose Mortgage Banking ~90% non-marginable(1) ~50% non-marginable(1) 100% non-marginable(1) $1.7 billion unused capacity(2) $2.1 billion unused capacity $1.7 billion unused capacity(2) ▪ Exposure to marginable debt in this segment is related to our loan inventory which we aim to turn over efficiently (holding period is generally one to three months) ▪ We have intentionally held light inventory in recent quarters ▪ Multiple lines across domestic lending partners ▪ Predominantly short-term floating rate debt ▪ In Q3’22, successfully initiated new warehouse line (two-year maturity with options to extend up to four years) ▪ Floating rate debt is matched against floating rate assets ▪ ~70% of this debt is against bridge loans which are predominantly variable rate ▪ The remaining ~30% is predominantly fixed rate with a term greater than one year $2.2 billion of debt $0.6 billion of debt $0.3 billion of debt

14 Investment Portfolio & Operating Businesses
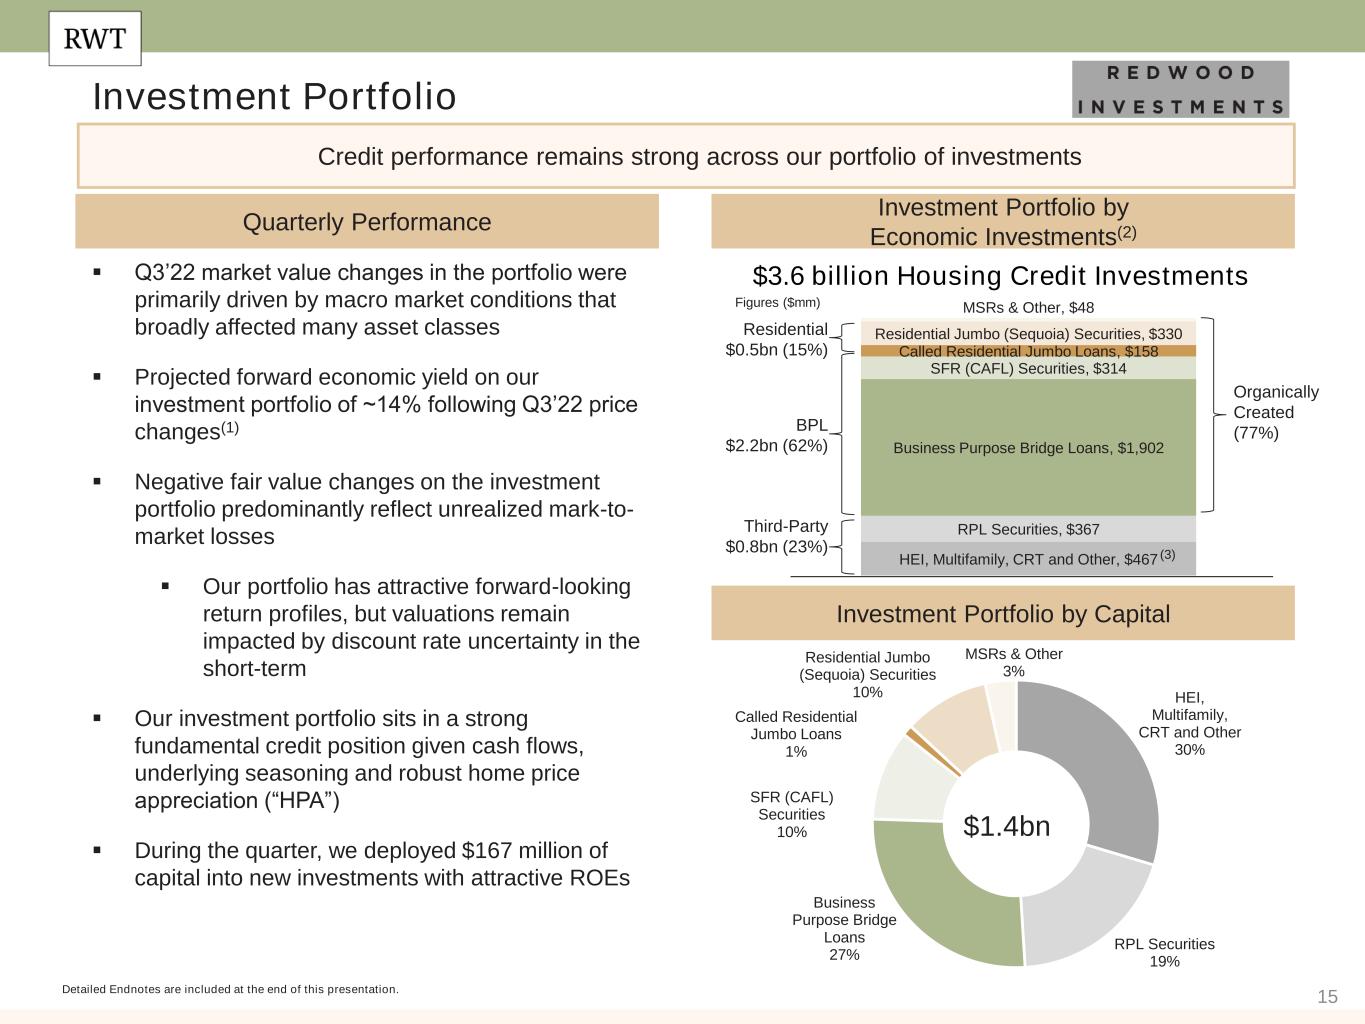
15 HEI, Multifamily, CRT and Other, $467 RPL Securities, $367 Business Purpose Bridge Loans, $1,902 SFR (CAFL) Securities, $314 Called Residential Jumbo Loans, $158 Residential Jumbo (Sequoia) Securities, $330 MSRs & Other, $48 Investment Portfolio Investment Portfolio by Economic Investments(2)Quarterly Performance ▪ Q3’22 market value changes in the portfolio were primarily driven by macro market conditions that broadly affected many asset classes ▪ Projected forward economic yield on our investment portfolio of ~14% following Q3’22 price changes(1) ▪ Negative fair value changes on the investment portfolio predominantly reflect unrealized mark-to- market losses ▪ Our portfolio has attractive forward-looking return profiles, but valuations remain impacted by discount rate uncertainty in the short-term ▪ Our investment portfolio sits in a strong fundamental credit position given cash flows, underlying seasoning and robust home price appreciation (“HPA”) ▪ During the quarter, we deployed $167 million of capital into new investments with attractive ROEs $3.6 billion Housing Credit Investments Organically Created (77%) Detailed Endnotes are included at the end of this presentation. Credit performance remains strong across our portfolio of investments Investment Portfolio by Capital $1.4bn Third-Party $0.8bn (23%) BPL $2.2bn (62%) (3) Residential $0.5bn (15%) HEI, Multifamily, CRT and Other 30% RPL Securities 19% Business Purpose Bridge Loans 27% SFR (CAFL) Securities 10% Called Residential Jumbo Loans 1% Residential Jumbo (Sequoia) Securities 10% MSRs & Other 3% Figures ($mm)
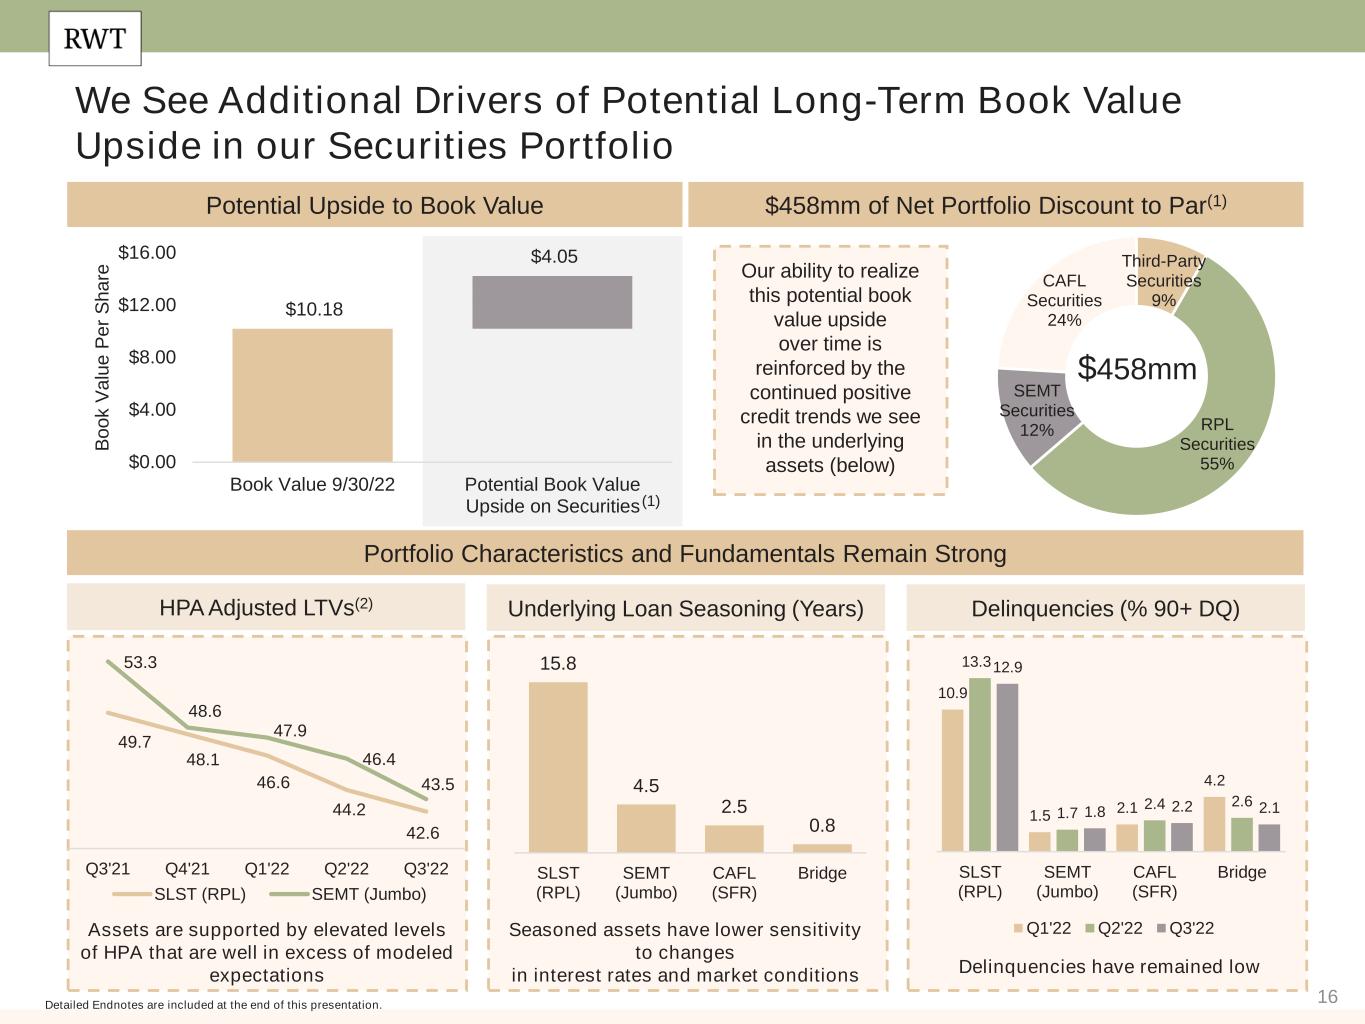
16 Detailed Endnotes are included at the end of this presentation. We See Additional Drivers of Potential Long-Term Book Value Upside in our Securities Portfolio (1) $458mm of Net Portfolio Discount to Par(1) $458mm Underlying Loan Seasoning (Years) Delinquencies (% 90+ DQ) Seasoned assets have lower sensitivity to changes in interest rates and market conditions Delinquencies have remained low HPA Adjusted LTVs(2) Assets are supported by elevated levels of HPA that are well in excess of modeled expectations 49.7 48.1 46.6 44.2 42.6 53.3 48.6 47.9 46.4 43.5 Q3'21 Q4'21 Q1'22 Q2'22 Q3'22 SLST (RPL) SEMT (Jumbo) 15.8 4.5 2.5 0.8 SLST (RPL) SEMT (Jumbo) CAFL (SFR) Bridge 10.9 1.5 2.1 4.2 13.3 1.7 2.4 2.6 12.9 1.8 2.2 2.1 SLST (RPL) SEMT (Jumbo) CAFL (SFR) Bridge Q1'22 Q2'22 Q3'22 Portfolio Characteristics and Fundamentals Remain Strong Third-Party Securities 9% RPL Securities 55% SEMT Securities 12% CAFL Securities 24% Potential Upside to Book Value $10.18 $4.05 $0.00 $4.00 $8.00 $12.00 $16.00 Book Value 9/30/22 Potential Book Value Upside on Securities B o o k V a lu e P e r S h a re Our ability to realize this potential book value upside over time is reinforced by the continued positive credit trends we see in the underlying assets (below)
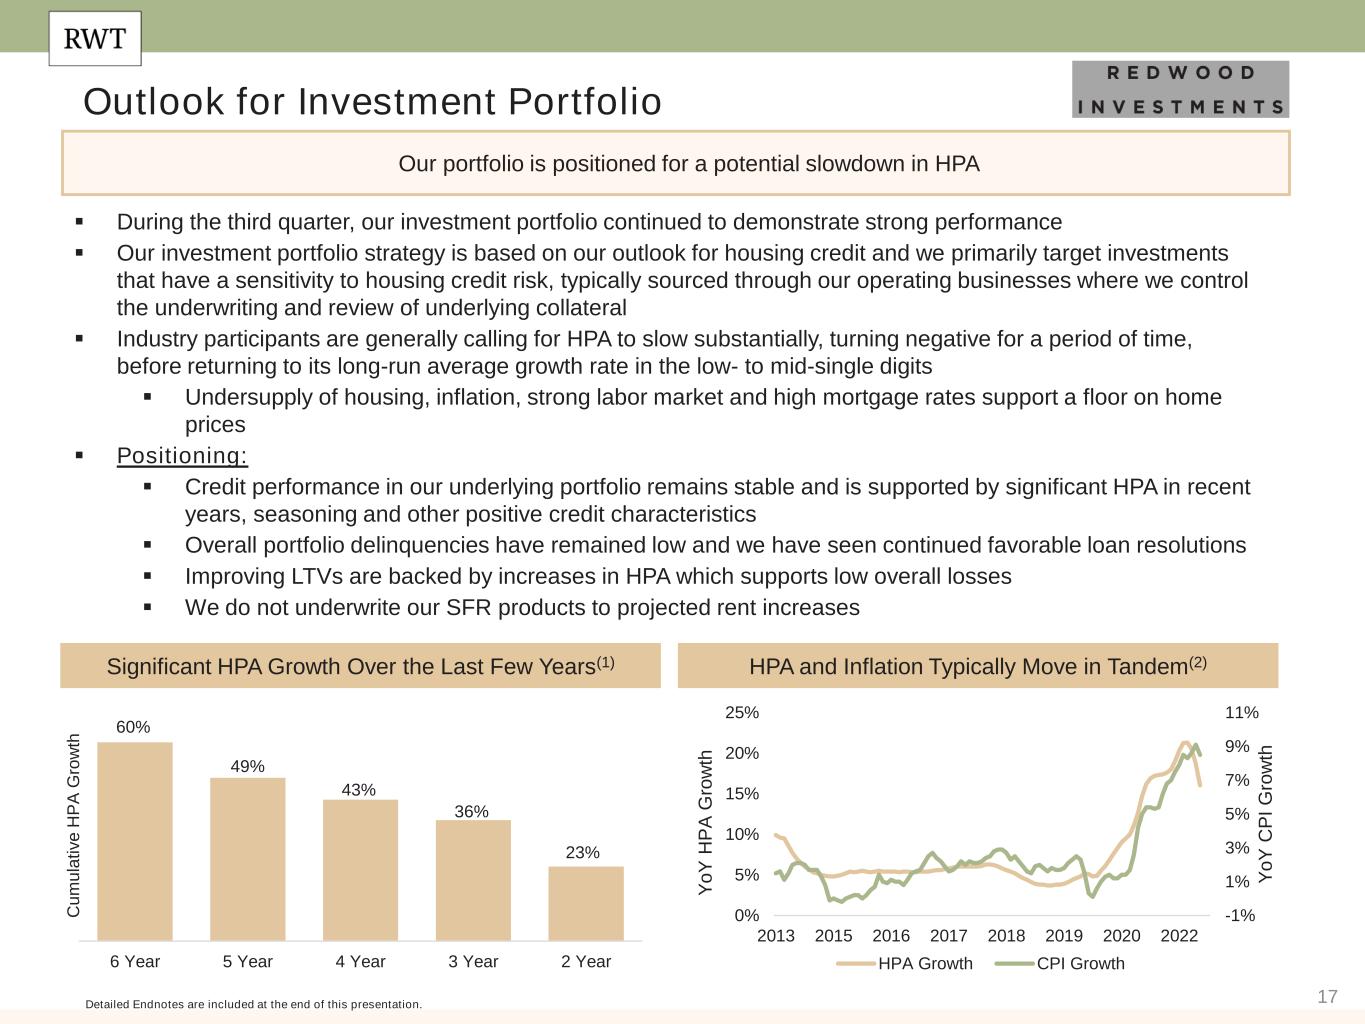
17 Outlook for Investment Portfolio Our portfolio is positioned for a potential slowdown in HPA HPA and Inflation Typically Move in Tandem(2) ▪ During the third quarter, our investment portfolio continued to demonstrate strong performance ▪ Our investment portfolio strategy is based on our outlook for housing credit and we primarily target investments that have a sensitivity to housing credit risk, typically sourced through our operating businesses where we control the underwriting and review of underlying collateral ▪ Industry participants are generally calling for HPA to slow substantially, turning negative for a period of time, before returning to its long-run average growth rate in the low- to mid-single digits ▪ Undersupply of housing, inflation, strong labor market and high mortgage rates support a floor on home prices ▪ Positioning: ▪ Credit performance in our underlying portfolio remains stable and is supported by significant HPA in recent years, seasoning and other positive credit characteristics ▪ Overall portfolio delinquencies have remained low and we have seen continued favorable loan resolutions ▪ Improving LTVs are backed by increases in HPA which supports low overall losses ▪ We do not underwrite our SFR products to projected rent increases Significant HPA Growth Over the Last Few Years(1) 60% 49% 43% 36% 23% 6 Year 5 Year 4 Year 3 Year 2 Year C u m u la ti v e H P A G ro w th Detailed Endnotes are included at the end of this presentation. -1% 1% 3% 5% 7% 9% 11% 0% 5% 10% 15% 20% 25% 2013 2015 2016 2017 2018 2019 2020 2022 Y o Y C P I G ro w th Y o Y H P A G ro w th HPA Growth CPI Growth
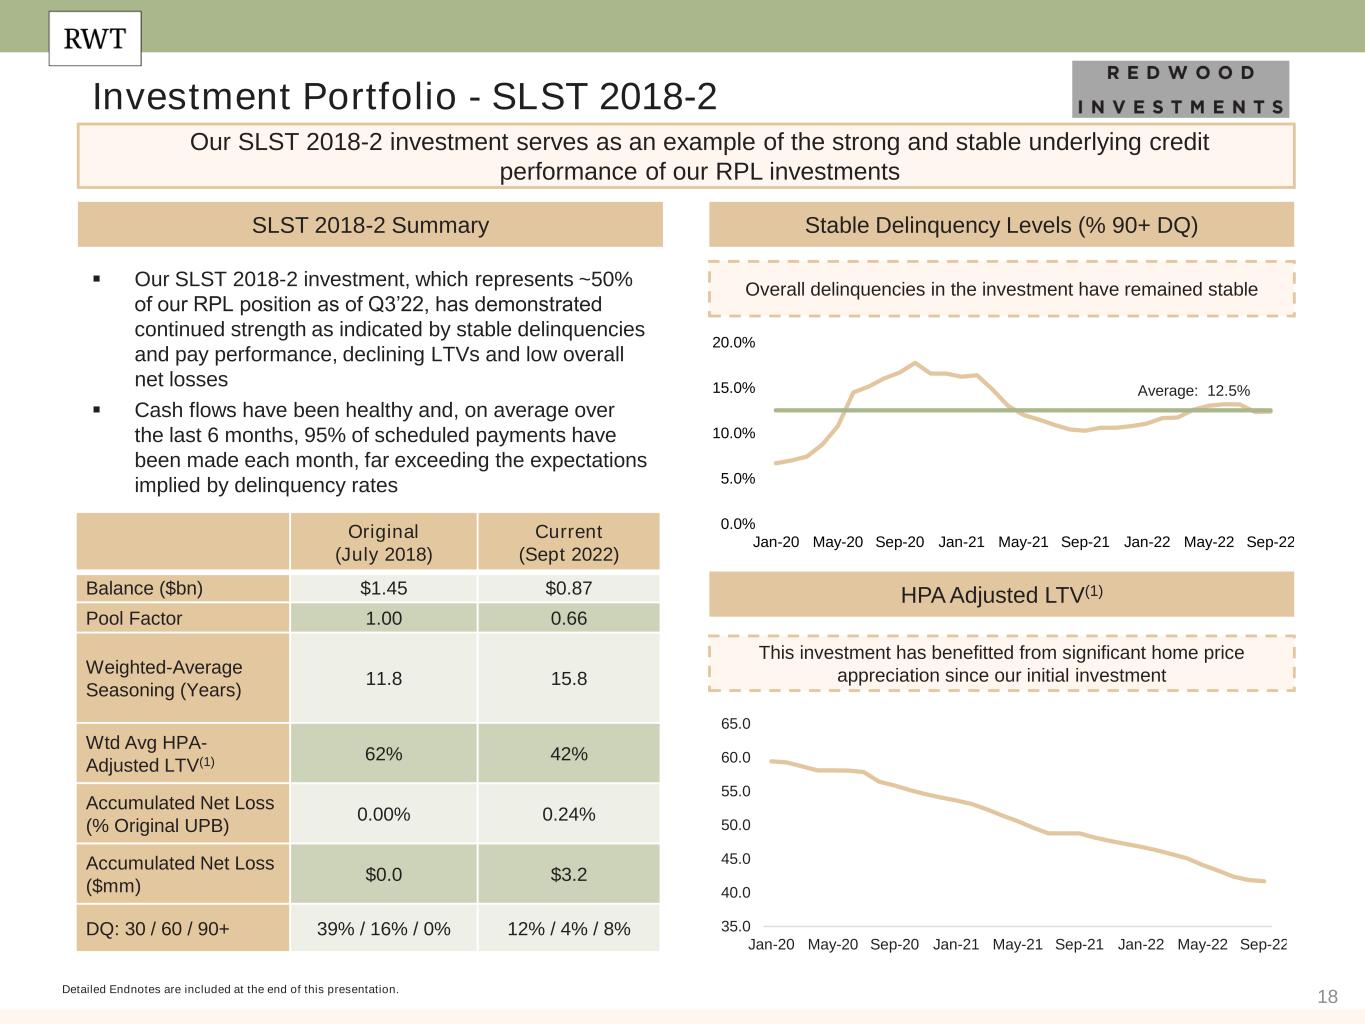
18 Investment Portfolio - SLST 2018-2 Detailed Endnotes are included at the end of this presentation. Our SLST 2018-2 investment serves as an example of the strong and stable underlying credit performance of our RPL investments Original (July 2018) Current (Sept 2022) Balance ($bn) $1.45 $0.87 Pool Factor 1.00 0.66 Weighted-Average Seasoning (Years) 11.8 15.8 Wtd Avg HPA- Adjusted LTV(1) 62% 42% Accumulated Net Loss (% Original UPB) 0.00% 0.24% Accumulated Net Loss ($mm) $0.0 $3.2 DQ: 30 / 60 / 90+ 39% / 16% / 0% 12% / 4% / 8% SLST 2018-2 Summary ▪ Our SLST 2018-2 investment, which represents ~50% of our RPL position as of Q3’22, has demonstrated continued strength as indicated by stable delinquencies and pay performance, declining LTVs and low overall net losses ▪ Cash flows have been healthy and, on average over the last 6 months, 95% of scheduled payments have been made each month, far exceeding the expectations implied by delinquency rates Stable Delinquency Levels (% 90+ DQ) HPA Adjusted LTV(1) This investment has benefitted from significant home price appreciation since our initial investment Overall delinquencies in the investment have remained stable Average: 12.5% 35.0 40.0 45.0 50.0 55.0 60.0 65.0 Jan-20 May-20 Sep-20 Jan-21 May-21 Sep-21 Jan-22 May-22 Sep-22 0.0% 5.0% 10.0% 15.0% 20.0% Jan-20 May-20 Sep-20 Jan-21 May-21 Sep-21 Jan-22 May-22 Sep-22
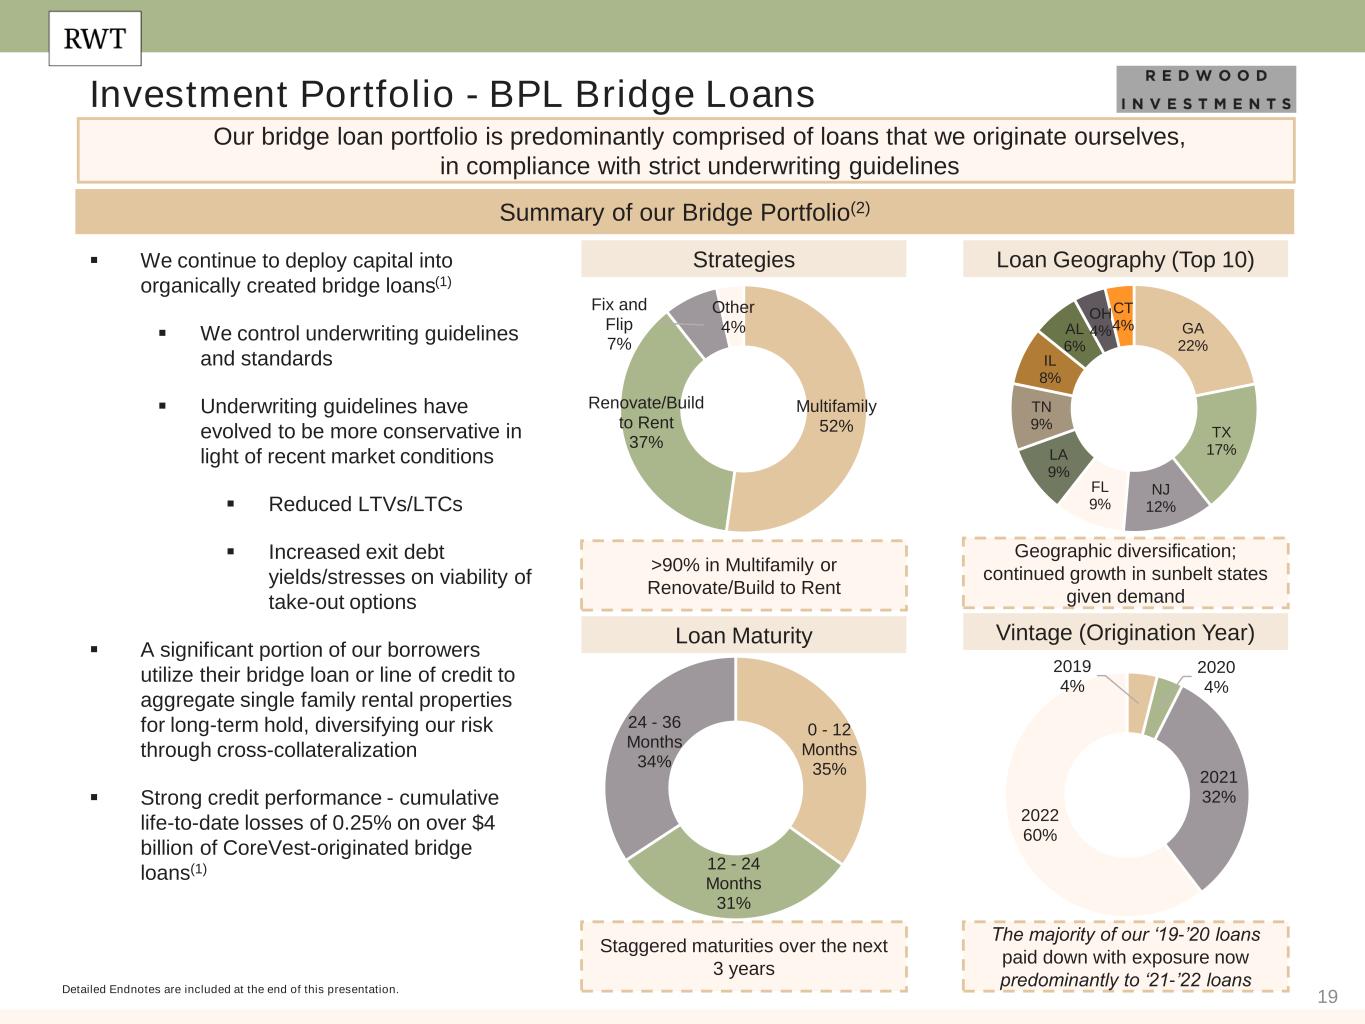
19 Investment Portfolio - BPL Bridge Loans Detailed Endnotes are included at the end of this presentation. Our bridge loan portfolio is predominantly comprised of loans that we originate ourselves, in compliance with strict underwriting guidelines ▪ We continue to deploy capital into organically created bridge loans(1) ▪ We control underwriting guidelines and standards ▪ Underwriting guidelines have evolved to be more conservative in light of recent market conditions ▪ Reduced LTVs/LTCs ▪ Increased exit debt yields/stresses on viability of take-out options ▪ A significant portion of our borrowers utilize their bridge loan or line of credit to aggregate single family rental properties for long-term hold, diversifying our risk through cross-collateralization ▪ Strong credit performance - cumulative life-to-date losses of 0.25% on over $4 billion of CoreVest-originated bridge loans(1) Strategies Loan Geography (Top 10) Vintage (Origination Year) Geographic diversification; continued growth in sunbelt states given demand >90% in Multifamily or Renovate/Build to Rent Multifamily 52% Renovate/Build to Rent 37% Fix and Flip 7% Other 4% GA 22% TX 17% NJ 12% FL 9% LA 9% TN 9% IL 8% AL 6% OH 4% CT 4% 2019 4% 2020 4% 2021 32% 2022 60% The majority of our ‘19-’20 loans paid down with exposure now predominantly to ‘21-’22 loans Loan Maturity Staggered maturities over the next 3 years 0 - 12 Months 35% 12 - 24 Months 31% 24 - 36 Months 34% Summary of our Bridge Portfolio(2)
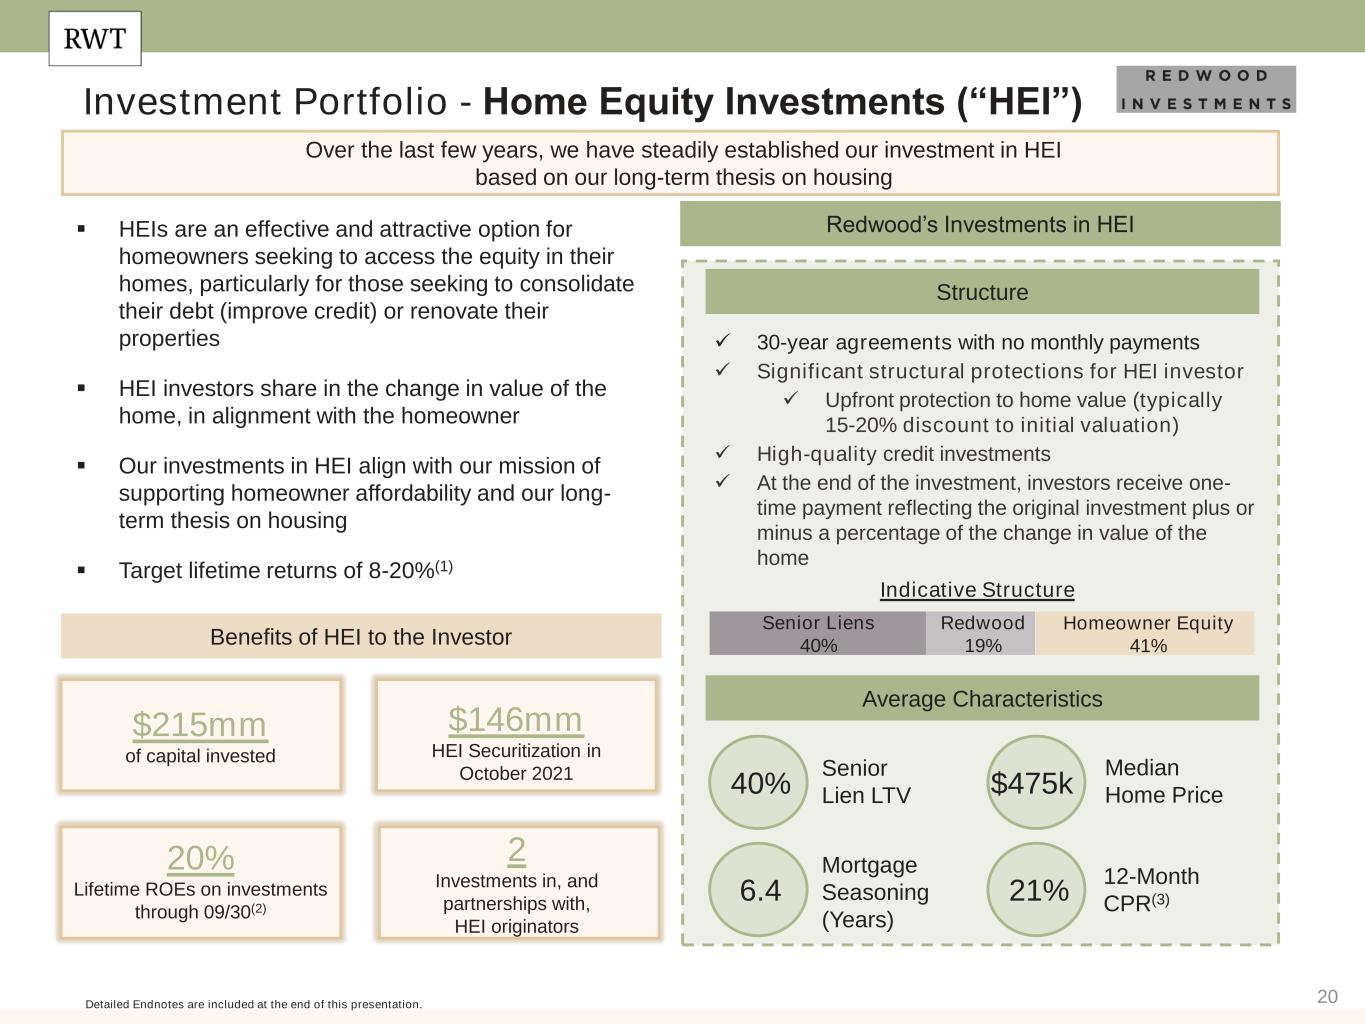
20 Investment Portfolio - Home Equity Investments (“HEI”) Over the last few years, we have steadily established our investment in HEI based on our long-term thesis on housing Structure ▪ HEIs are an effective and attractive option for homeowners seeking to access the equity in their homes, particularly for those seeking to consolidate their debt (improve credit) or renovate their properties ▪ HEI investors share in the change in value of the home, in alignment with the homeowner ▪ Our investments in HEI align with our mission of supporting homeowner affordability and our long- term thesis on housing ▪ Target lifetime returns of 8-20%(1) Detailed Endnotes are included at the end of this presentation. Average Characteristics $146mm HEI Securitization in October 2021 ✓ 30-year agreements with no monthly payments ✓ Significant structural protections for HEI investor ✓ Upfront protection to home value (typically 15-20% discount to initial valuation) ✓ High-quality credit investments ✓ At the end of the investment, investors receive one- time payment reflecting the original investment plus or minus a percentage of the change in value of the home Benefits of HEI to the Investor 2 Investments in, and partnerships with, HEI originators Redwood’s Investments in HEI 40% 6.4 $475k 21% Senior Lien LTV Mortgage Seasoning (Years) Median Home Price 12-Month CPR(3) Indicative Structure Senior Liens 40% Homeowner Equity 41% Redwood 19% $215mm of capital invested 20% Lifetime ROEs on investments through 09/30(2)
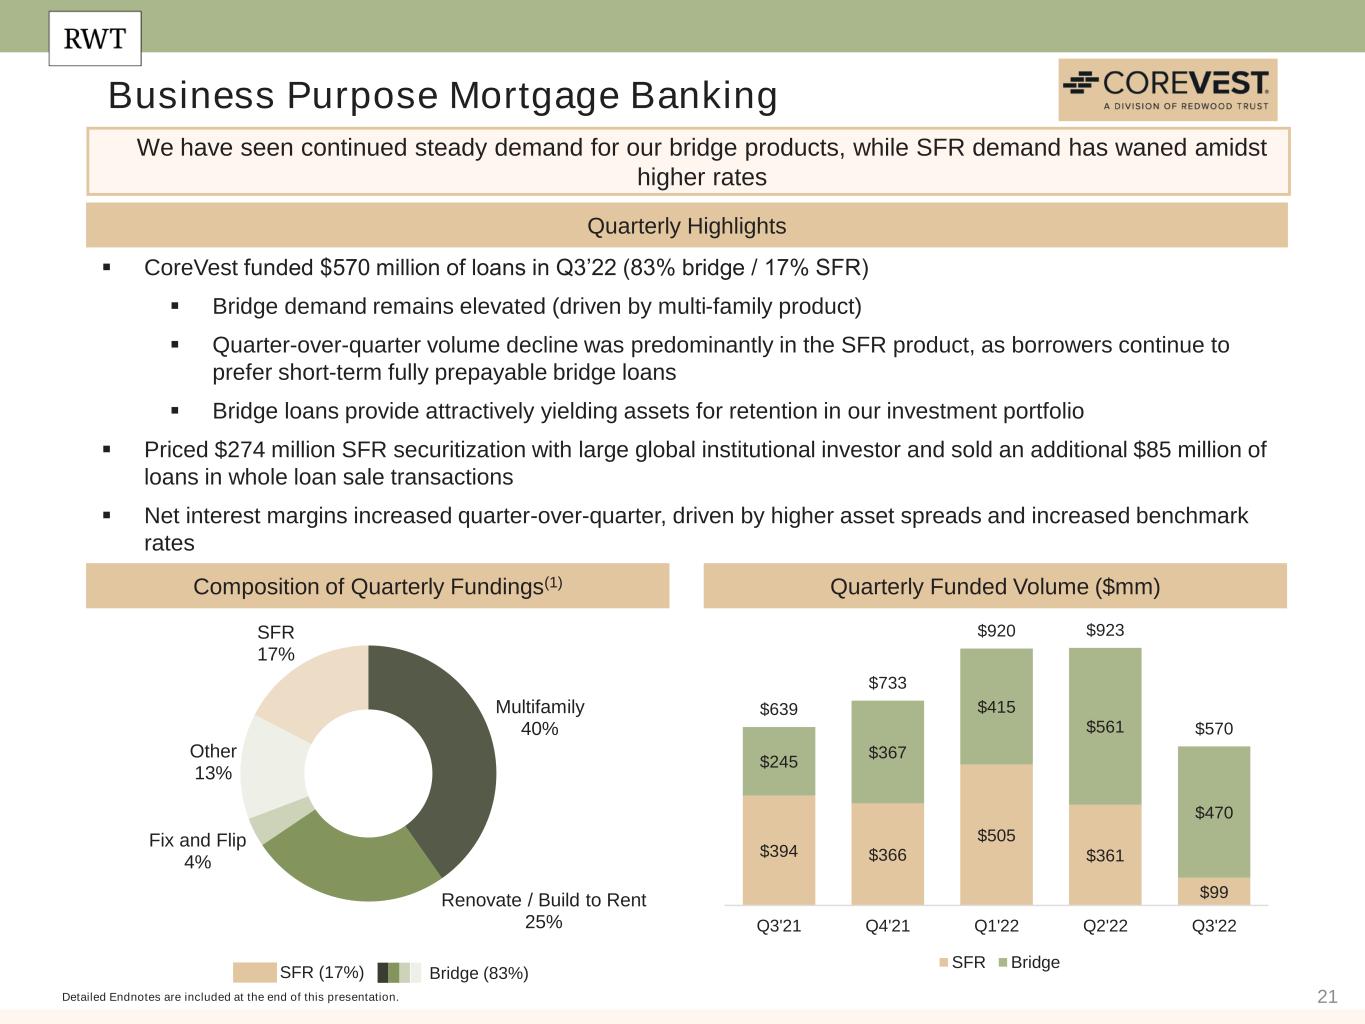
21 Business Purpose Mortgage Banking Quarterly Highlights Composition of Quarterly Fundings(1) Detailed Endnotes are included at the end of this presentation. We have seen continued steady demand for our bridge products, while SFR demand has waned amidst higher rates Quarterly Funded Volume ($mm) SFR (17%) Bridge (83%) $394 $366 $505 $361 $99 $245 $367 $415 $561 $470 $639 $733 $920 $923 $570 Q3'21 Q4'21 Q1'22 Q2'22 Q3'22 SFR Bridge ▪ CoreVest funded $570 million of loans in Q3’22 (83% bridge / 17% SFR) ▪ Bridge demand remains elevated (driven by multi-family product) ▪ Quarter-over-quarter volume decline was predominantly in the SFR product, as borrowers continue to prefer short-term fully prepayable bridge loans ▪ Bridge loans provide attractively yielding assets for retention in our investment portfolio ▪ Priced $274 million SFR securitization with large global institutional investor and sold an additional $85 million of loans in whole loan sale transactions ▪ Net interest margins increased quarter-over-quarter, driven by higher asset spreads and increased benchmark rates Multifamily 40% Renovate / Build to Rent 25% Fix and Flip 4% Other 13% SFR 17%
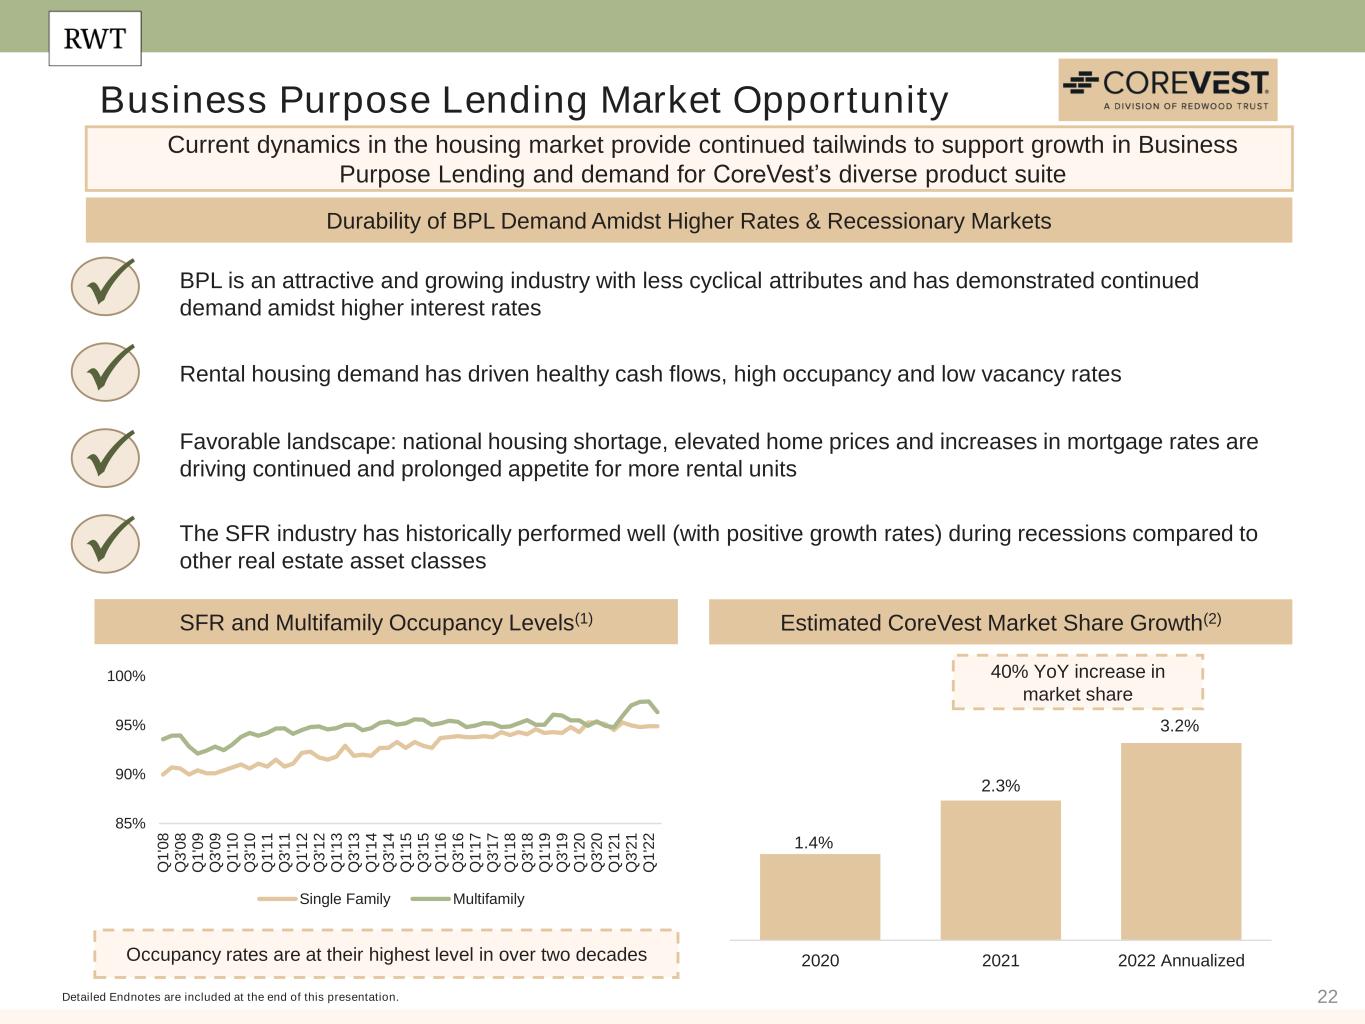
22 Business Purpose Lending Market Opportunity Durability of BPL Demand Amidst Higher Rates & Recessionary Markets Estimated CoreVest Market Share Growth(2) Detailed Endnotes are included at the end of this presentation. Current dynamics in the housing market provide continued tailwinds to support growth in Business Purpose Lending and demand for CoreVest’s diverse product suite SFR and Multifamily Occupancy Levels(1) 1.4% 2.3% 3.2% 2020 2021 2022 Annualized 40% YoY increase in market share Occupancy rates are at their highest level in over two decades P BPL is an attractive and growing industry with less cyclical attributes and has demonstrated continued demand amidst higher interest rates P Rental housing demand has driven healthy cash flows, high occupancy and low vacancy rates P Favorable landscape: national housing shortage, elevated home prices and increases in mortgage rates are driving continued and prolonged appetite for more rental units P The SFR industry has historically performed well (with positive growth rates) during recessions compared to other real estate asset classes 85% 90% 95% 100% Q 1 '0 8 Q 3 '0 8 Q 1 '0 9 Q 3 '0 9 Q 1 '1 0 Q 3 '1 0 Q 1 '1 1 Q 3 '1 1 Q 1 '1 2 Q 3 '1 2 Q 1 '1 3 Q 3 '1 3 Q 1 '1 4 Q 3 '1 4 Q 1 '1 5 Q 3 '1 5 Q 1 '1 6 Q 3 '1 6 Q 1 '1 7 Q 3 '1 7 Q 1 '1 8 Q 3 '1 8 Q 1 '1 9 Q 3 '1 9 Q 1 '2 0 Q 3 '2 0 Q 1 '2 1 Q 3 '2 1 Q 1 '2 2 Single Family Multifamily
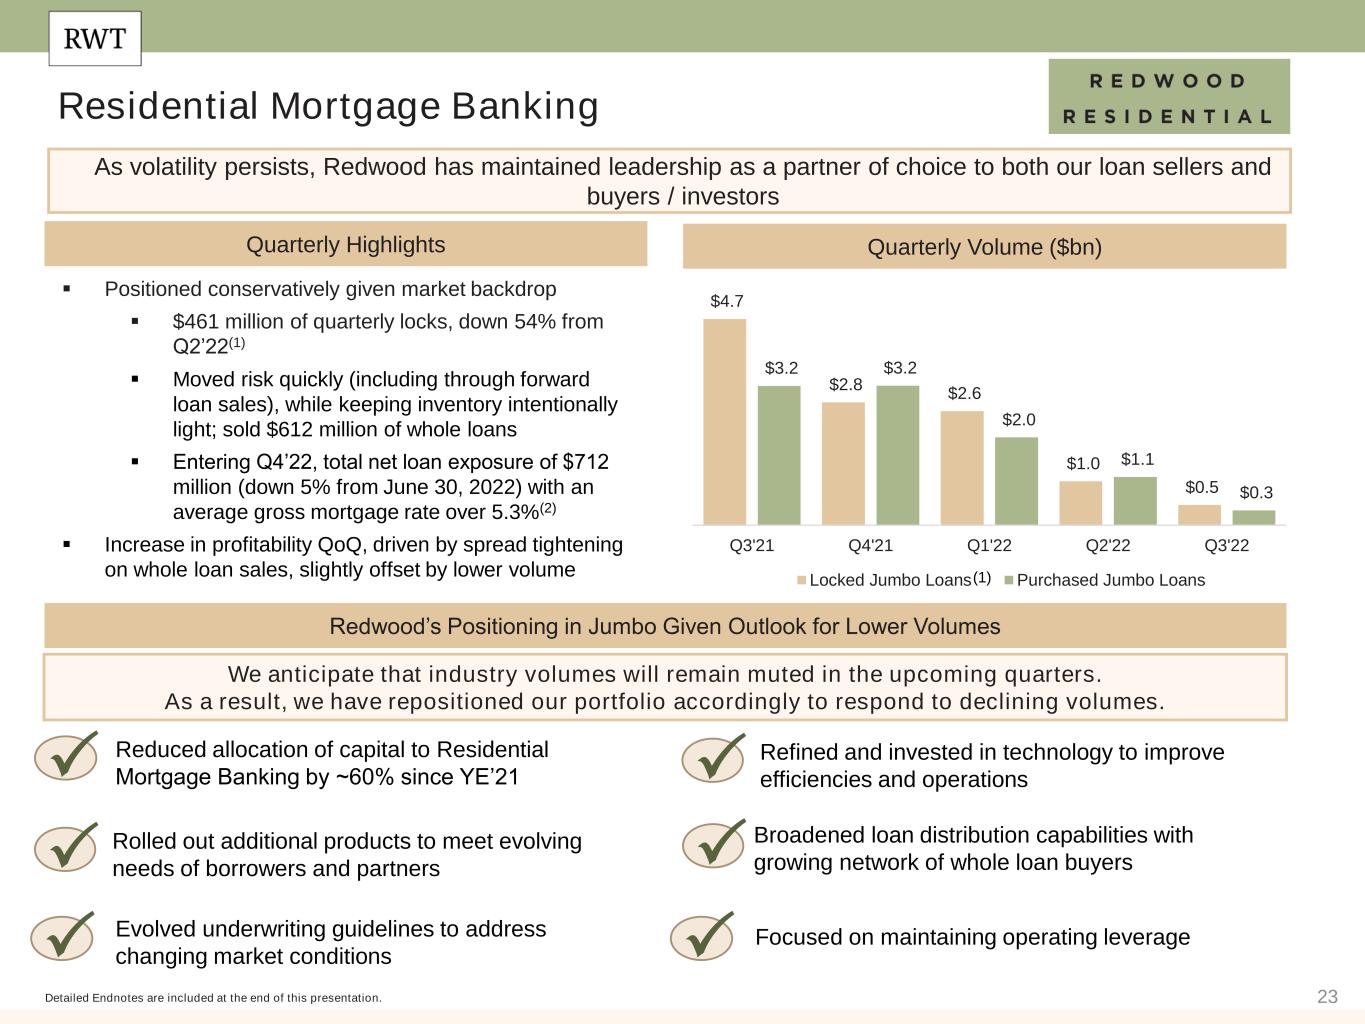
23 ▪ Positioned conservatively given market backdrop ▪ $461 million of quarterly locks, down 54% from Q2’22(1) ▪ Moved risk quickly (including through forward loan sales), while keeping inventory intentionally light; sold $612 million of whole loans ▪ Entering Q4’22, total net loan exposure of $712 million (down 5% from June 30, 2022) with an average gross mortgage rate over 5.3%(2) ▪ Increase in profitability QoQ, driven by spread tightening on whole loan sales, slightly offset by lower volume Residential Mortgage Banking Quarterly Volume ($bn) Redwood’s Positioning in Jumbo Given Outlook for Lower Volumes Quarterly Highlights Detailed Endnotes are included at the end of this presentation. As volatility persists, Redwood has maintained leadership as a partner of choice to both our loan sellers and buyers / investors (1) We anticipate that industry volumes will remain muted in the upcoming quarters. As a result, we have repositioned our portfolio accordingly to respond to declining volumes. $4.7 $2.8 $2.6 $1.0 $0.5 $3.2 $3.2 $2.0 $1.1 $0.3 Q3'21 Q4'21 Q1'22 Q2'22 Q3'22 Locked Jumbo Loans Purchased Jumbo Loans P Reduced allocation of capital to Residential Mortgage Banking by ~60% since YE’21 Rolled out additional products to meet evolving needs of borrowers and partnersP P Evolved underwriting guidelines to address changing market conditions Refined and invested in technology to improve efficiencies and operations Broadened loan distribution capabilities with growing network of whole loan buyers P P P Focused on maintaining operating leverage
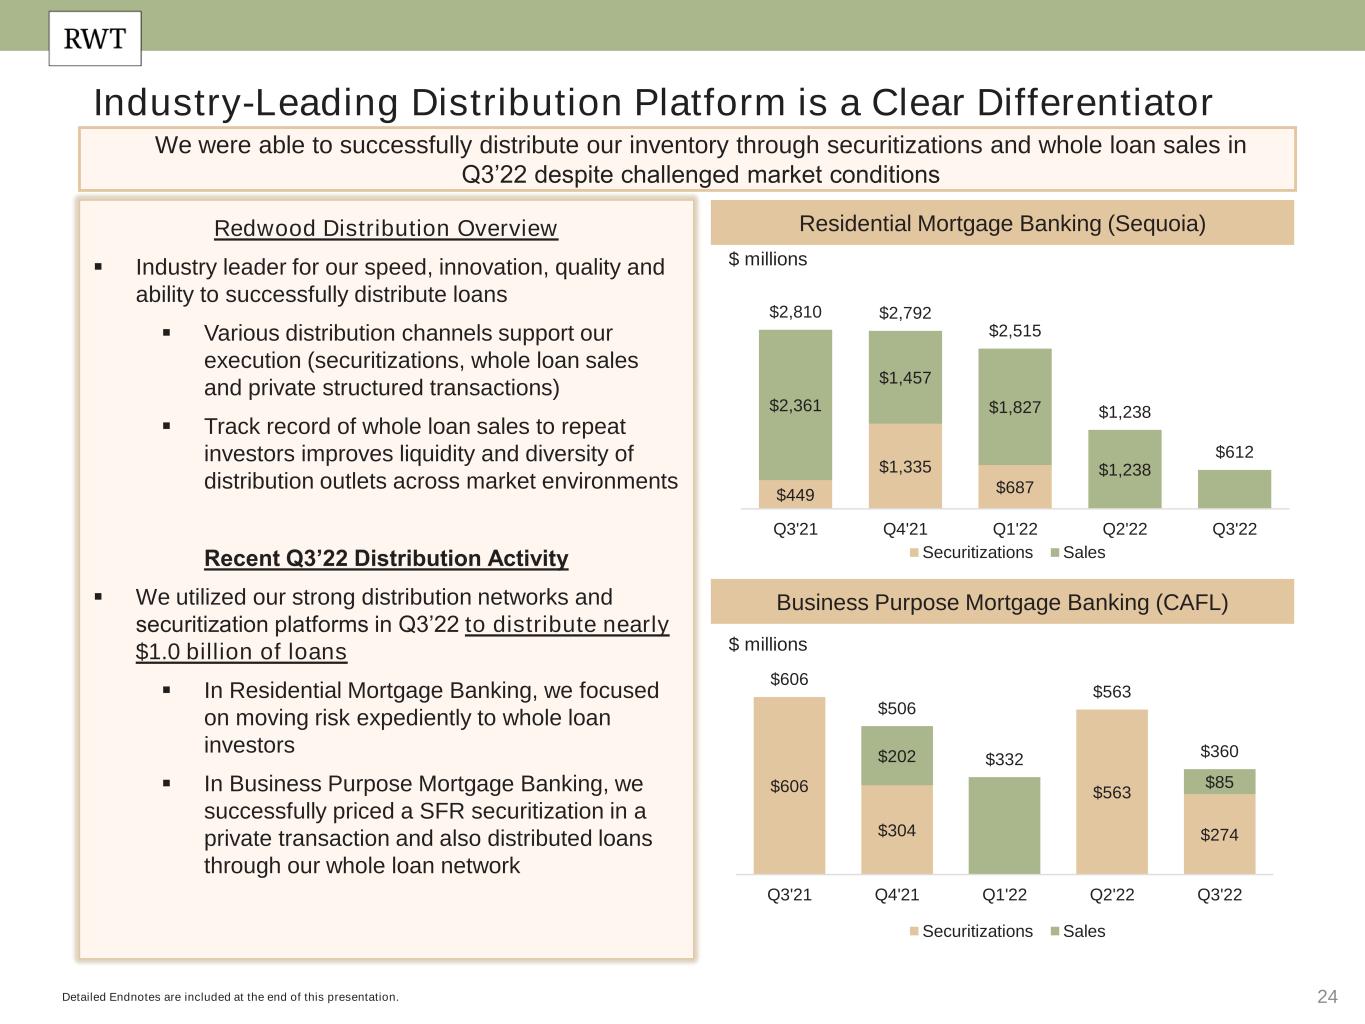
24 Industry-Leading Distribution Platform is a Clear Differentiator Business Purpose Mortgage Banking (CAFL) Residential Mortgage Banking (Sequoia) Detailed Endnotes are included at the end of this presentation. We were able to successfully distribute our inventory through securitizations and whole loan sales in Q3’22 despite challenged market conditions $ millions $ millions Redwood Distribution Overview ▪ Industry leader for our speed, innovation, quality and ability to successfully distribute loans ▪ Various distribution channels support our execution (securitizations, whole loan sales and private structured transactions) ▪ Track record of whole loan sales to repeat investors improves liquidity and diversity of distribution outlets across market environments Recent Q3’22 Distribution Activity ▪ We utilized our strong distribution networks and securitization platforms in Q3’22 to distribute nearly $1.0 billion of loans ▪ In Residential Mortgage Banking, we focused on moving risk expediently to whole loan investors ▪ In Business Purpose Mortgage Banking, we successfully priced a SFR securitization in a private transaction and also distributed loans through our whole loan network $606 $304 $563 $274 $202 $85 $606 $506 $332 $563 $360 Q3'21 Q4'21 Q1'22 Q2'22 Q3'22 Securitizations Sales $449 $1,335 $687 $2,361 $1,457 $1,827 $1,238 $2,810 $2,792 $2,515 $1,238 $612 Q3'21 Q4'21 Q1'22 Q2'22 Q3'22 Securitizations Sales
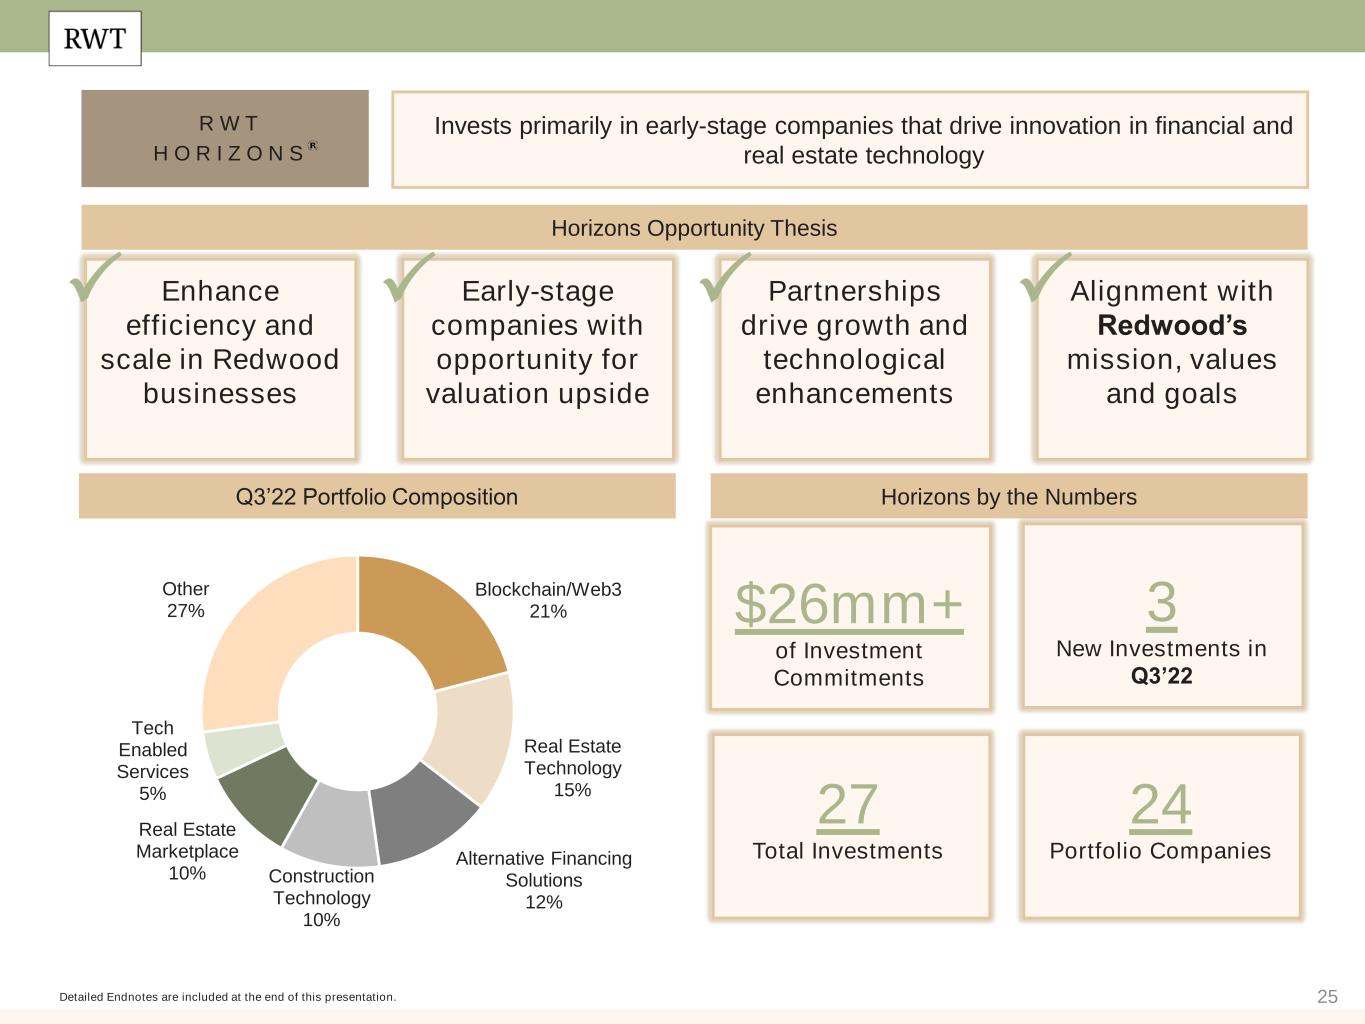
25 R W T H O R I Z O N S Horizons by the Numbers Detailed Endnotes are included at the end of this presentation. Invests primarily in early-stage companies that drive innovation in financial and real estate technology Horizons Opportunity Thesis Enhance efficiency and scale in Redwood businesses Early-stage companies with opportunity for valuation upside Partnerships drive growth and technological enhancements Alignment with Redwood’s mission, values and goals P P P P $26mm+ of Investment Commitments 27 Total Investments 24 Portfolio Companies Q3’22 Portfolio Composition 3 New Investments in Q3’22 Blockchain/Web3 21% Real Estate Technology 15% Alternative Financing Solutions 12% Construction Technology 10% Real Estate Marketplace 10% Tech Enabled Services 5% Other 27%

26 Financial Results
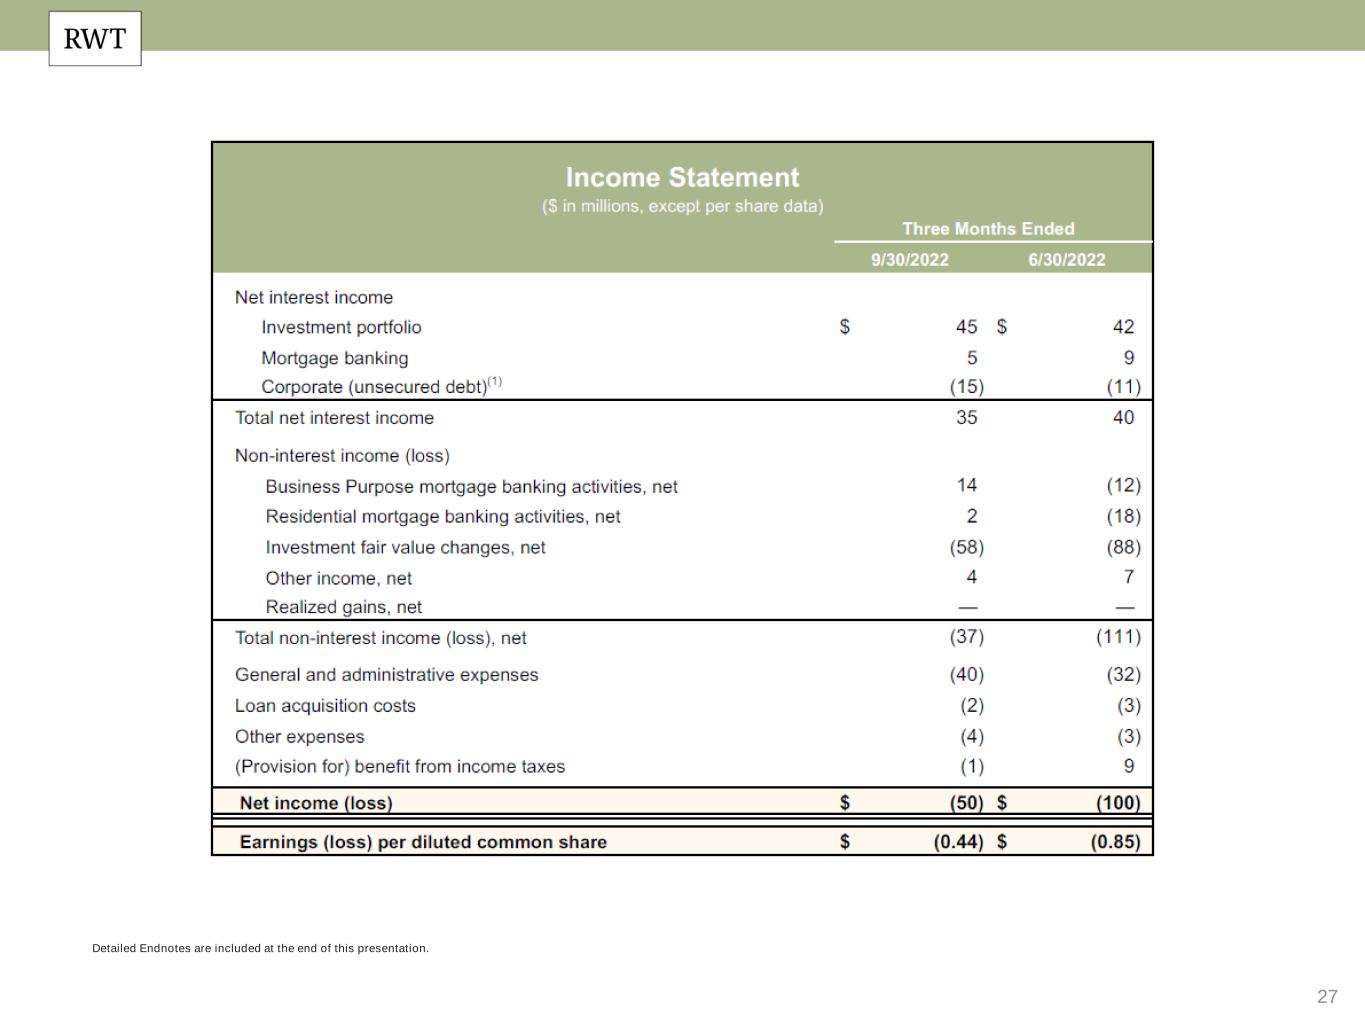
27 Detailed Endnotes are included at the end of this presentation.
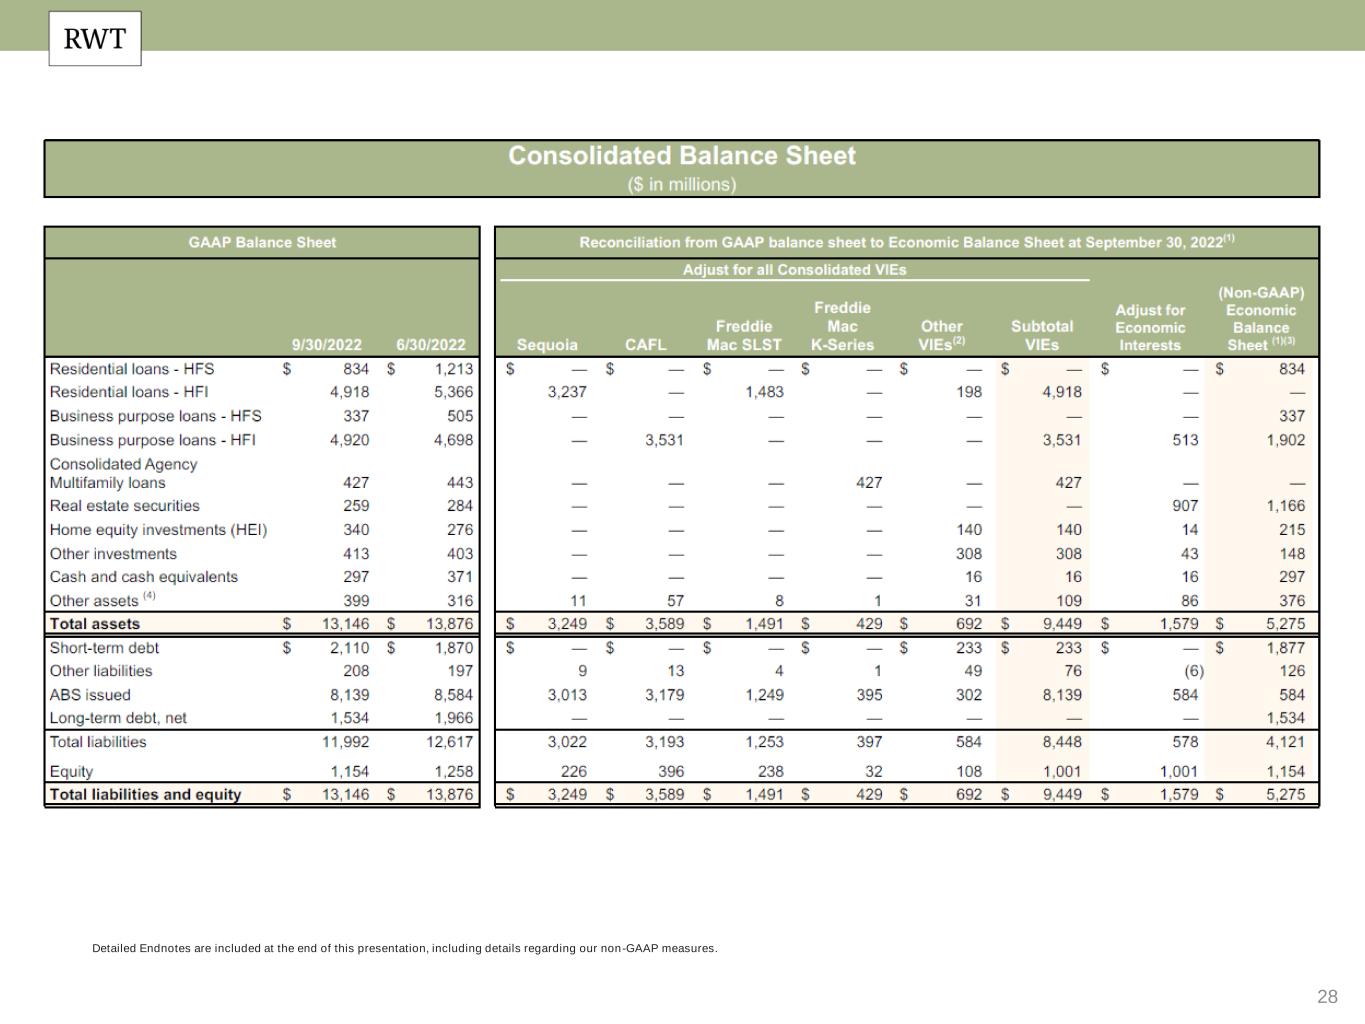
28 Detailed Endnotes are included at the end of this presentation, including details regarding our non-GAAP measures.
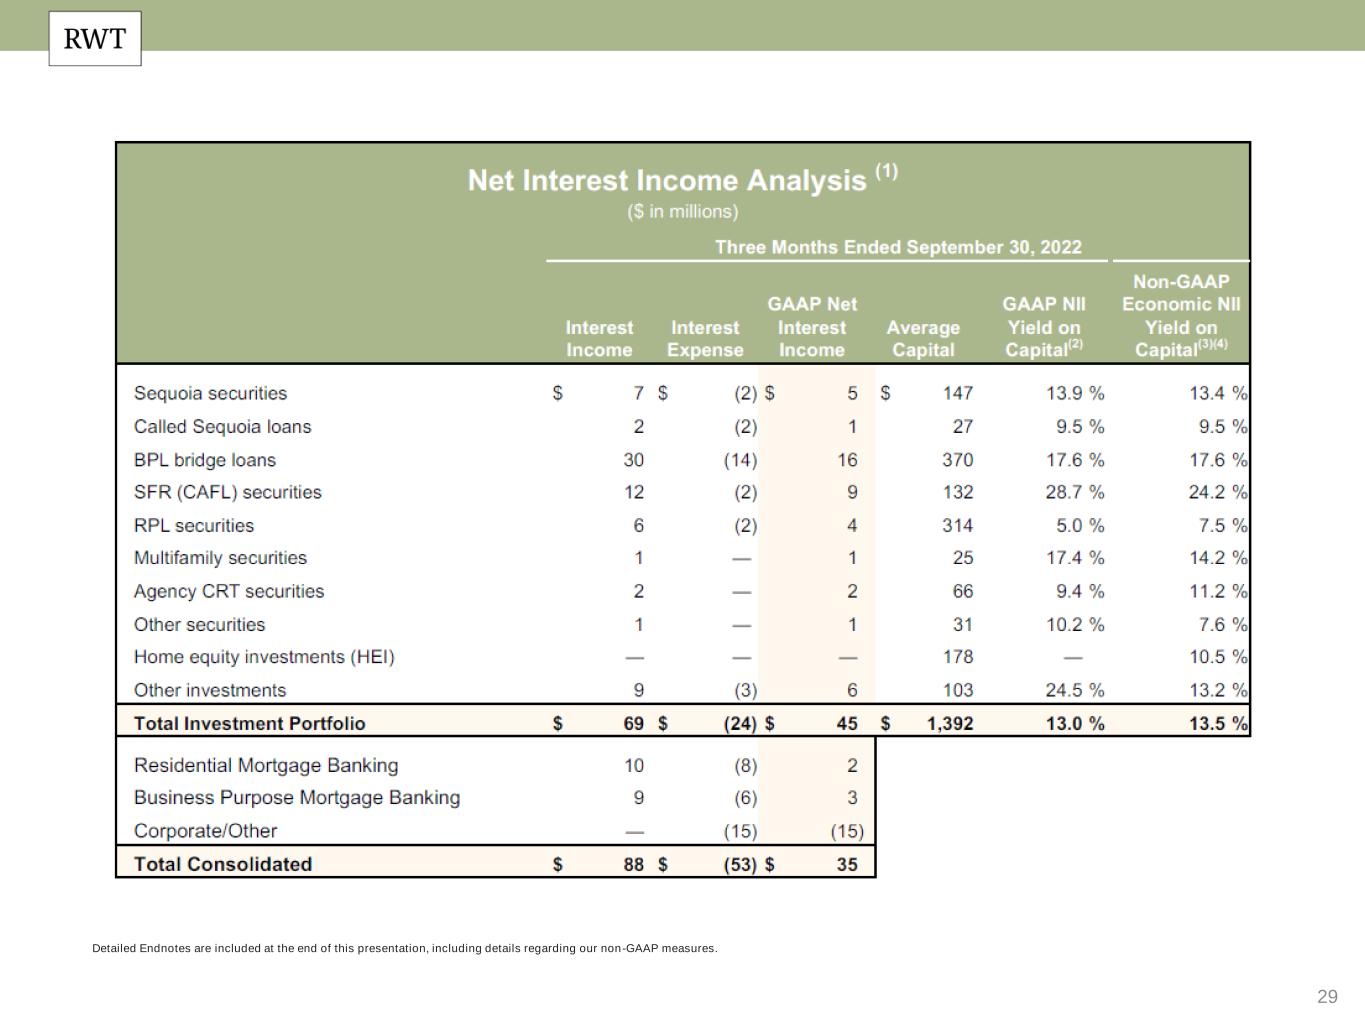
29 Detailed Endnotes are included at the end of this presentation, including details regarding our non-GAAP measures.

30 (1) Detailed Endnotes are included at the end of this presentation.
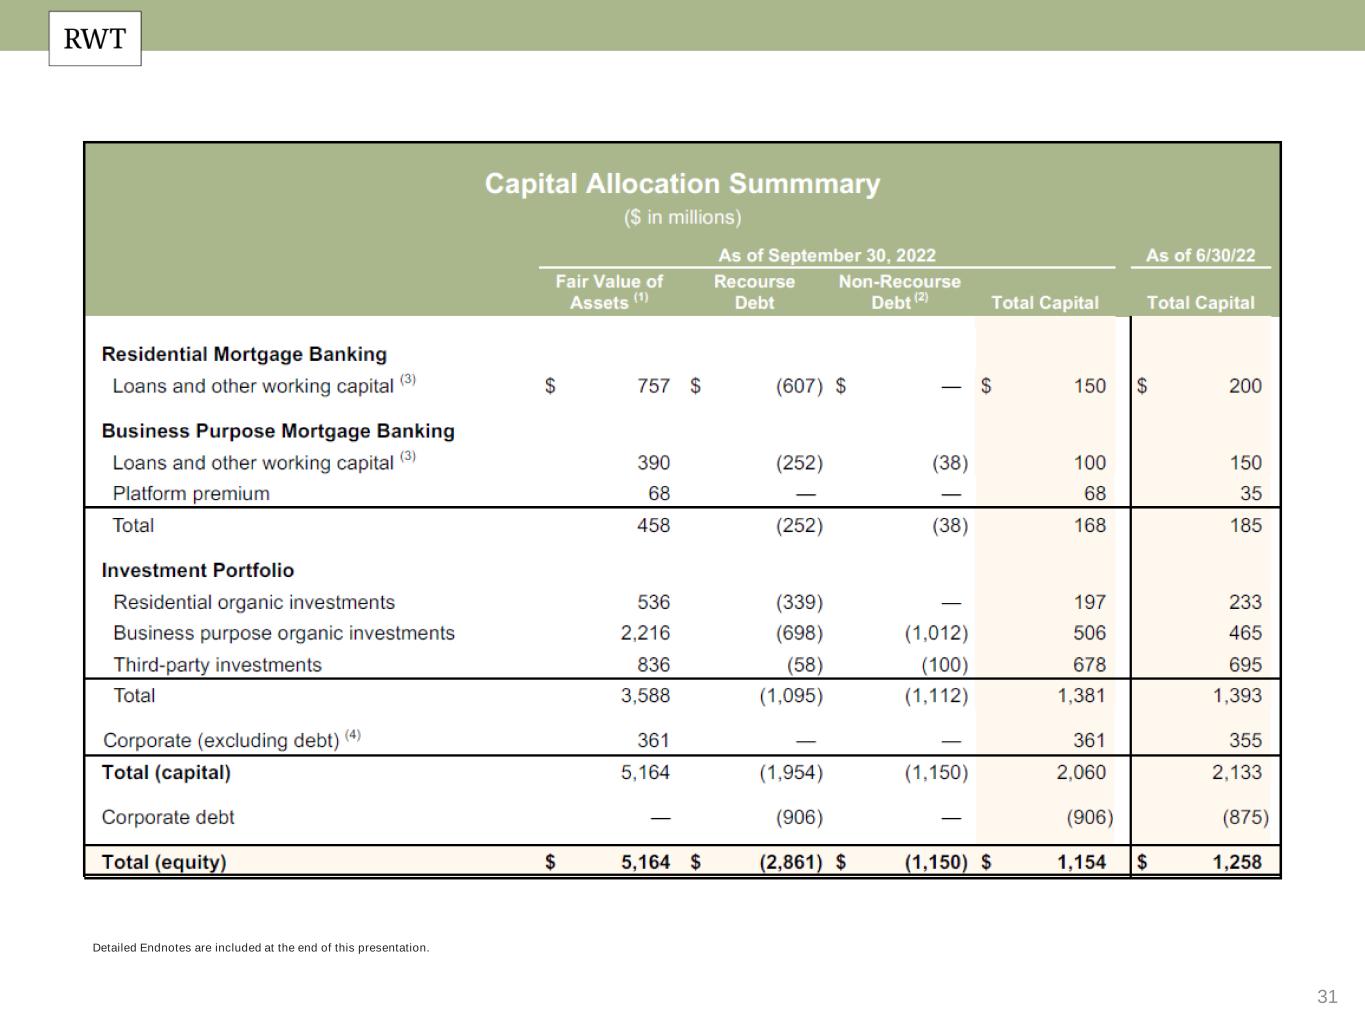
31 Detailed Endnotes are included at the end of this presentation.

32 Detailed Endnotes are included at the end of this presentation, including details regarding our non-GAAP measures.
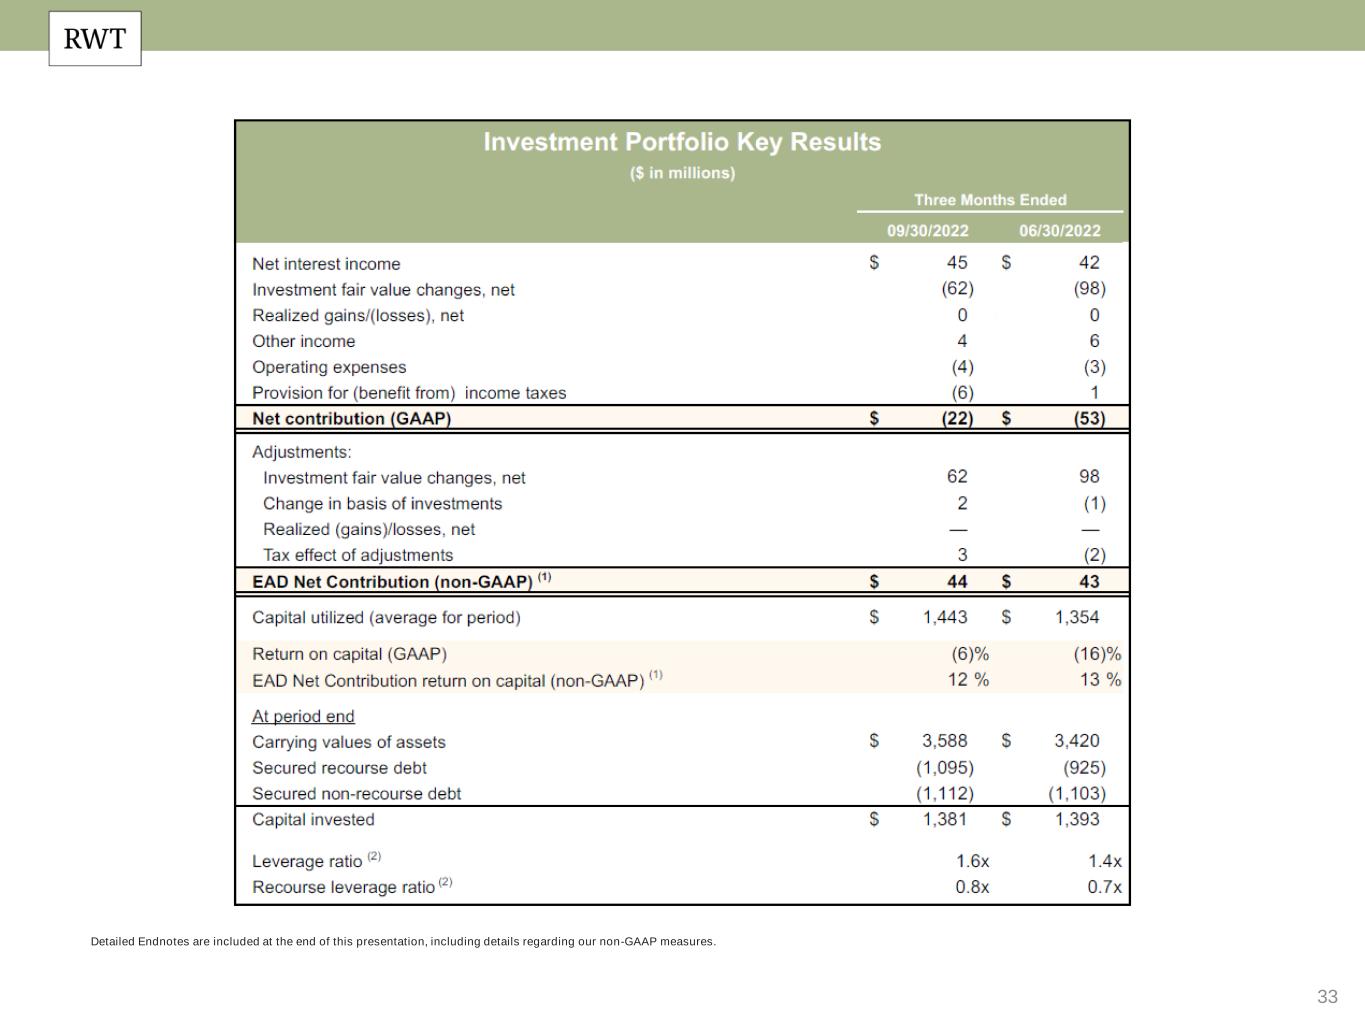
33 Detailed Endnotes are included at the end of this presentation, including details regarding our non-GAAP measures.
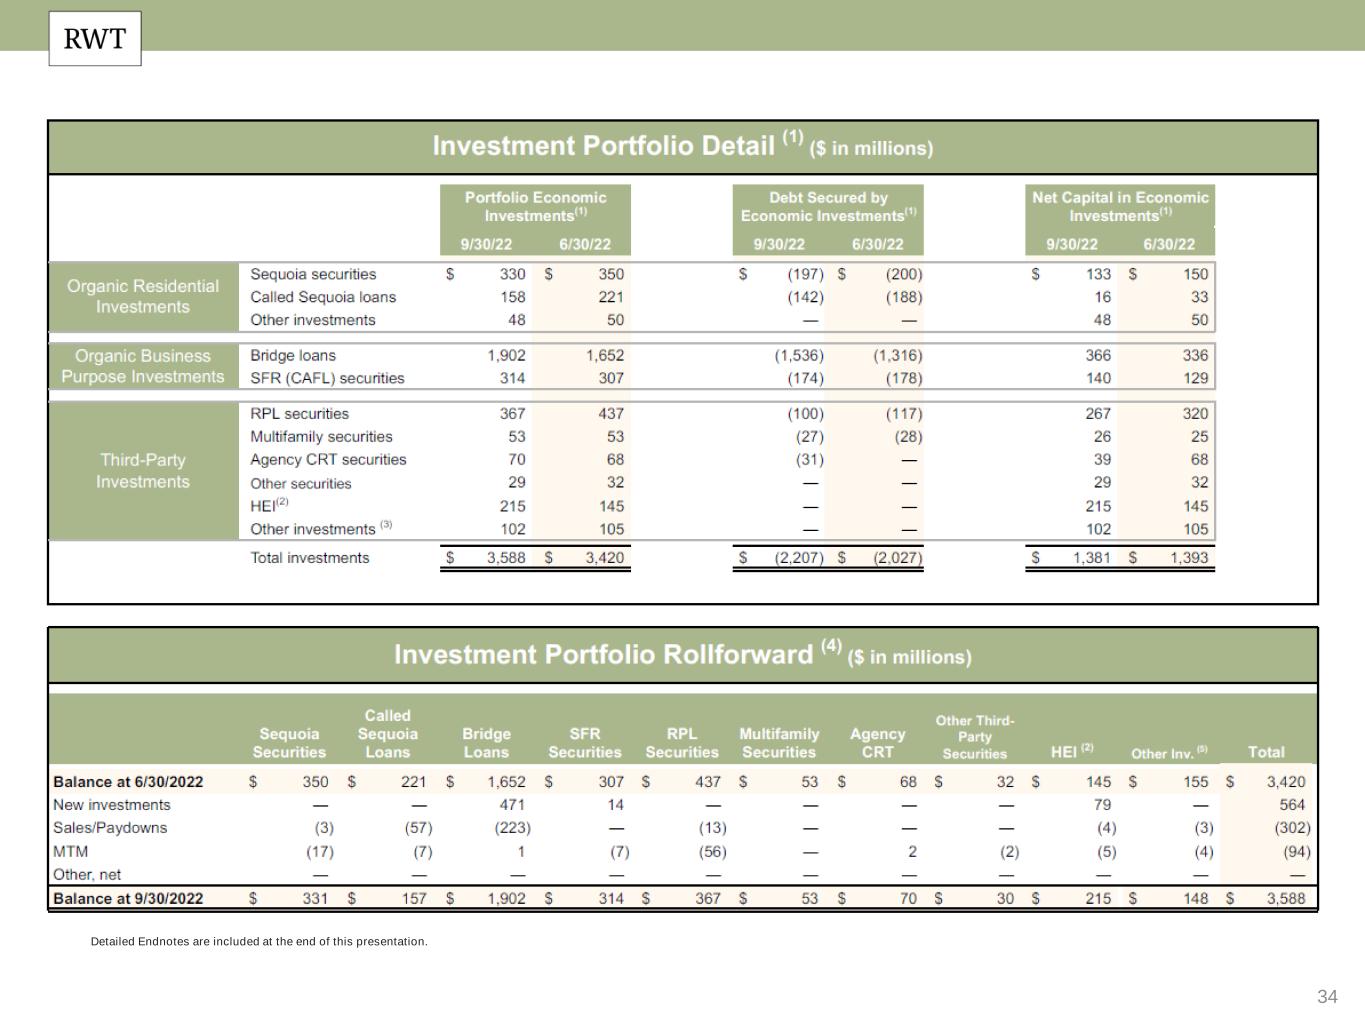
34 Detailed Endnotes are included at the end of this presentation.
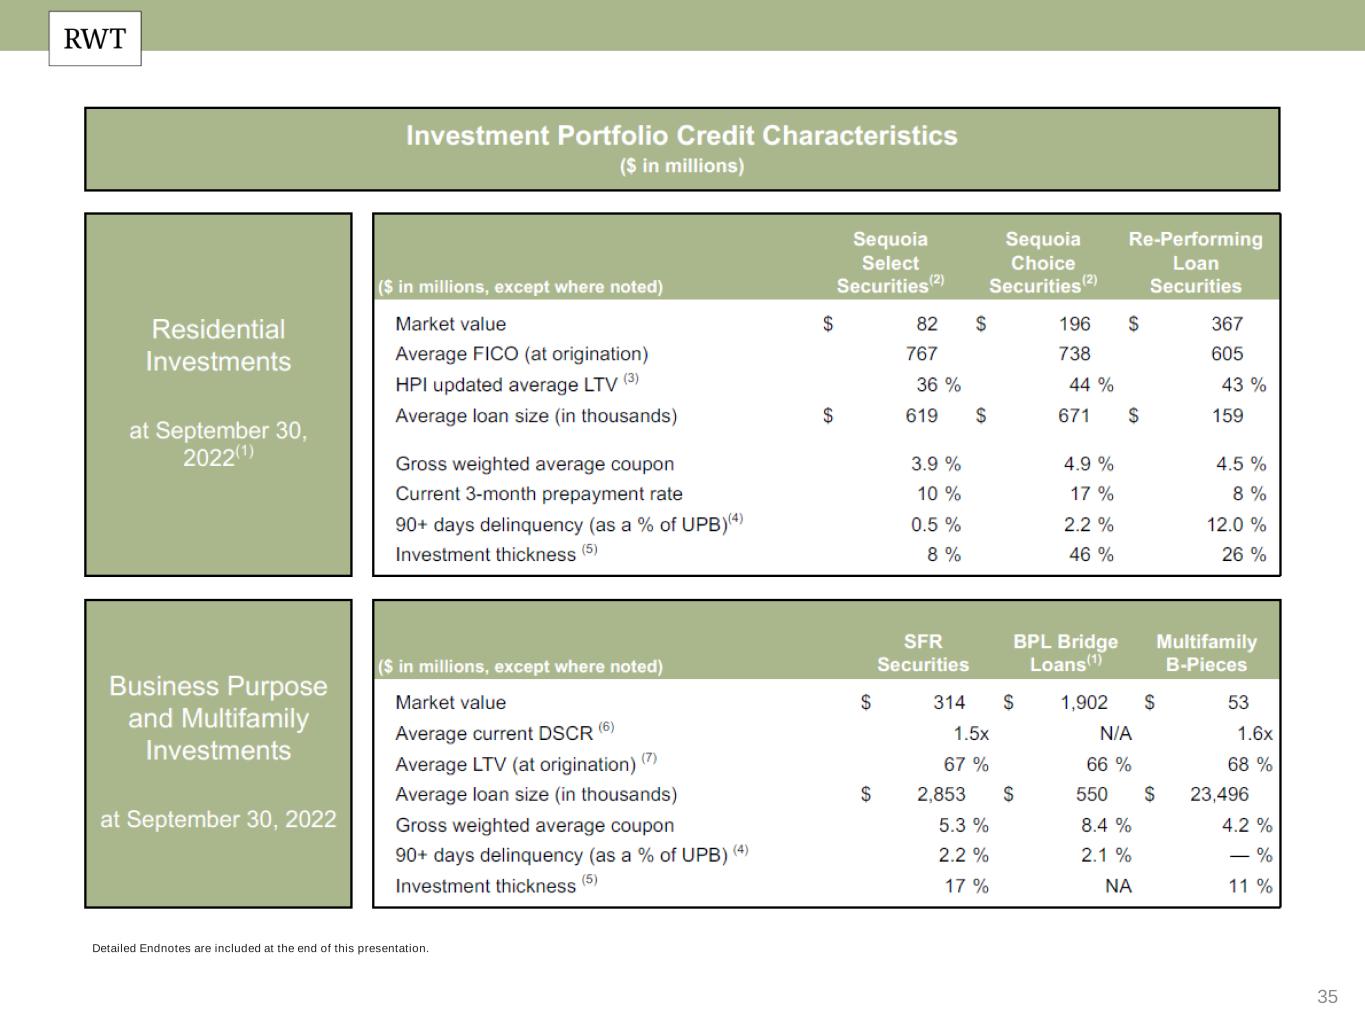
35 Detailed Endnotes are included at the end of this presentation.
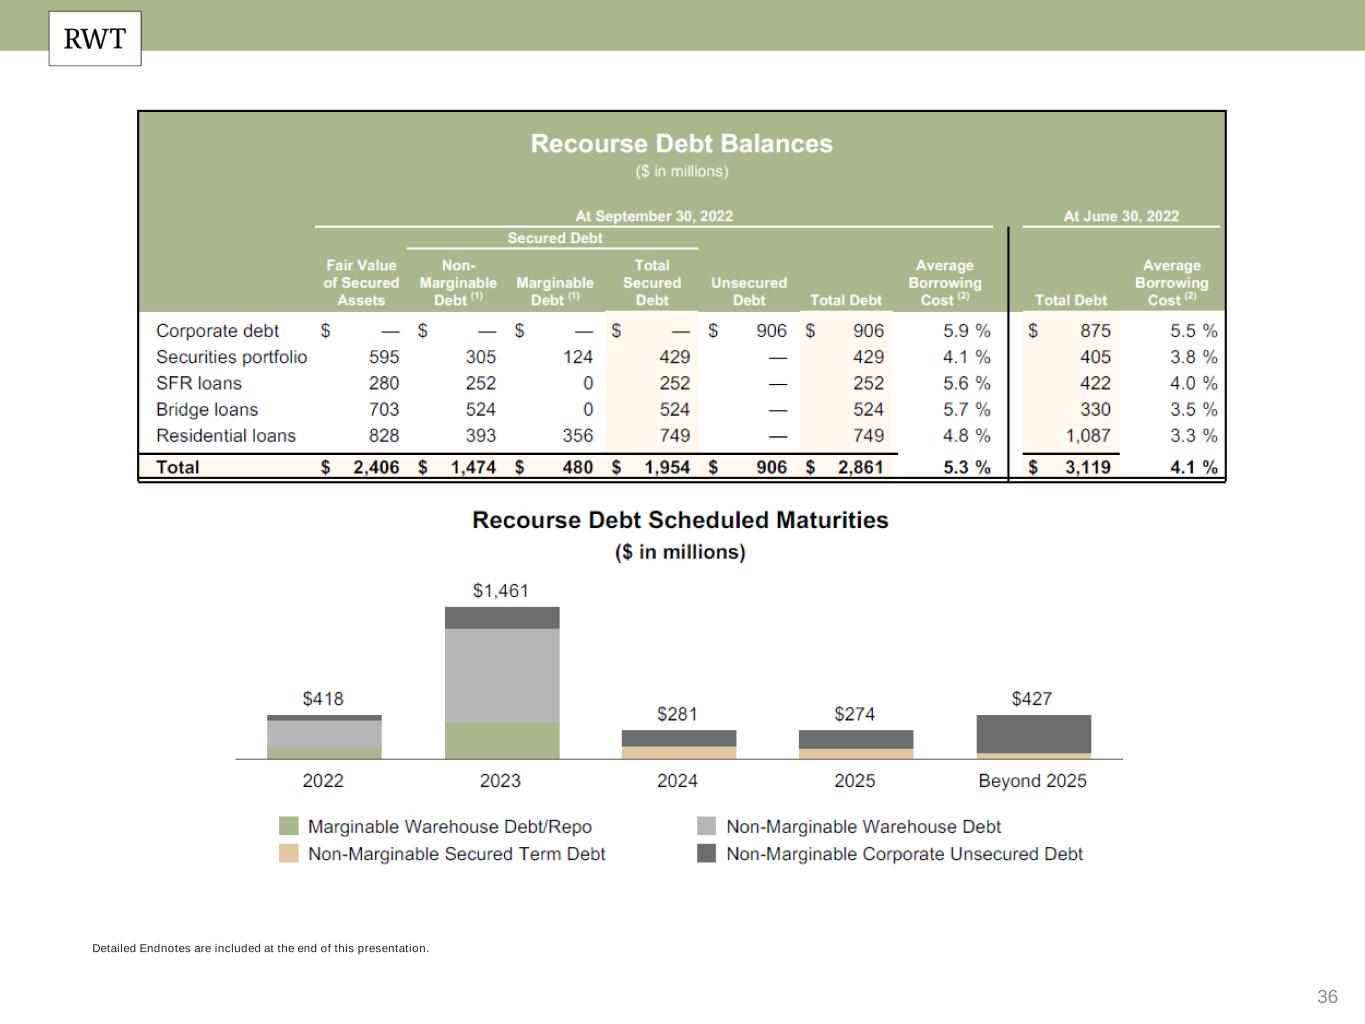
36 Detailed Endnotes are included at the end of this presentation.

37 Endnotes
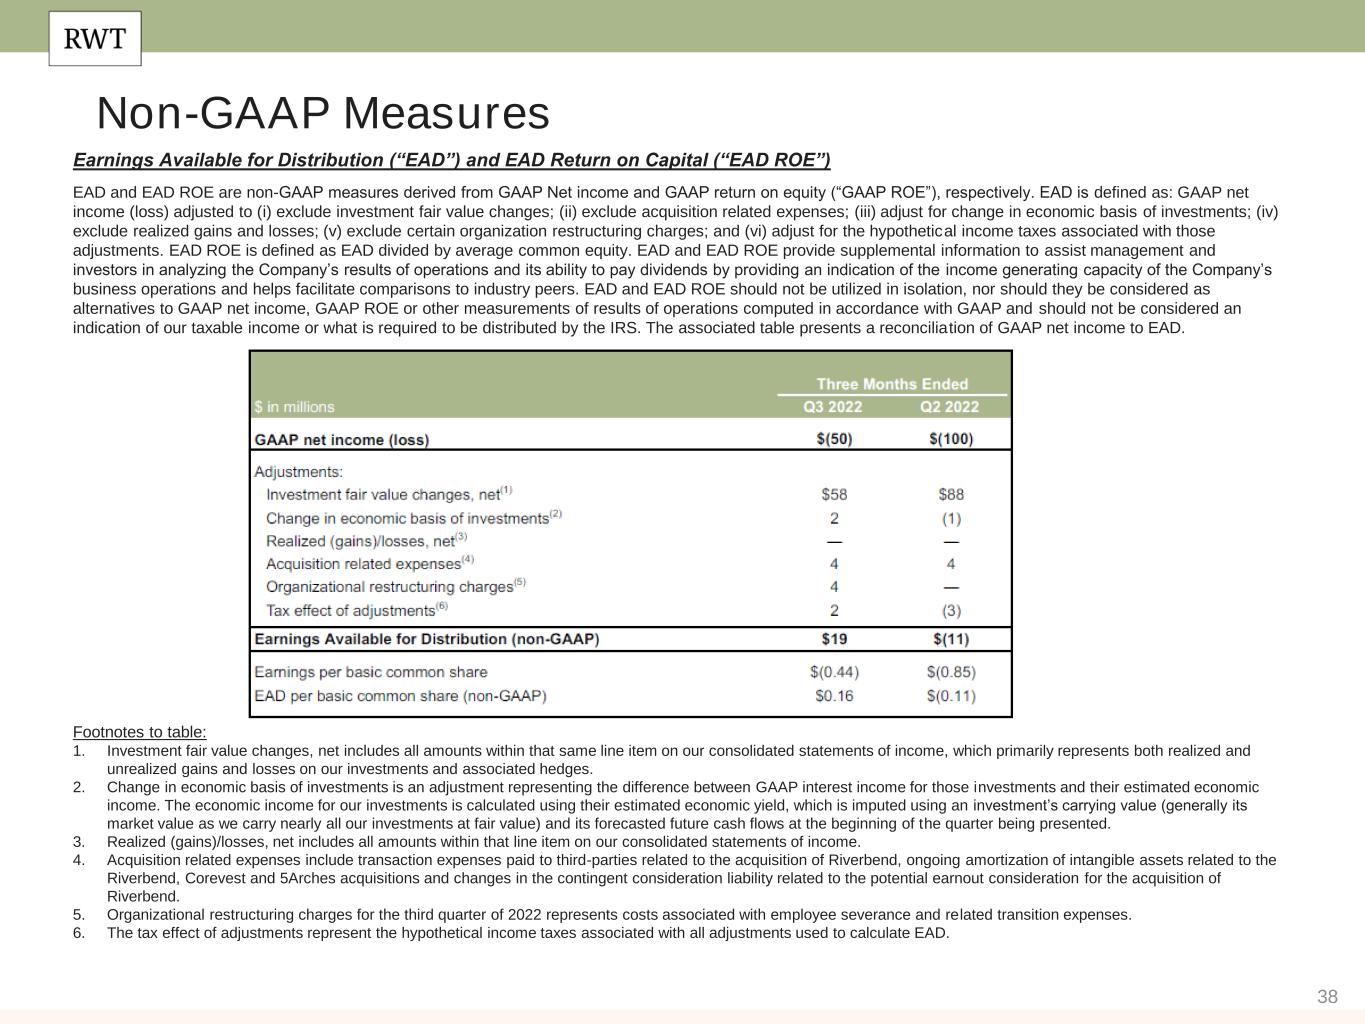
38 Non-GAAP Measures Earnings Available for Distribution (“EAD”) and EAD Return on Capital (“EAD ROE”) EAD and EAD ROE are non-GAAP measures derived from GAAP Net income and GAAP return on equity (“GAAP ROE”), respectively. EAD is defined as: GAAP net income (loss) adjusted to (i) exclude investment fair value changes; (ii) exclude acquisition related expenses; (iii) adjust for change in economic basis of investments; (iv) exclude realized gains and losses; (v) exclude certain organization restructuring charges; and (vi) adjust for the hypothetical income taxes associated with those adjustments. EAD ROE is defined as EAD divided by average common equity. EAD and EAD ROE provide supplemental information to assist management and investors in analyzing the Company’s results of operations and its ability to pay dividends by providing an indication of the income generating capacity of the Company’s business operations and helps facilitate comparisons to industry peers. EAD and EAD ROE should not be utilized in isolation, nor should they be considered as alternatives to GAAP net income, GAAP ROE or other measurements of results of operations computed in accordance with GAAP and should not be considered an indication of our taxable income or what is required to be distributed by the IRS. The associated table presents a reconciliation of GAAP net income to EAD. Footnotes to table: 1. Investment fair value changes, net includes all amounts within that same line item on our consolidated statements of income, which primarily represents both realized and unrealized gains and losses on our investments and associated hedges. 2. Change in economic basis of investments is an adjustment representing the difference between GAAP interest income for those investments and their estimated economic income. The economic income for our investments is calculated using their estimated economic yield, which is imputed using an investment’s carrying value (generally its market value as we carry nearly all our investments at fair value) and its forecasted future cash flows at the beginning of the quarter being presented. 3. Realized (gains)/losses, net includes all amounts within that line item on our consolidated statements of income. 4. Acquisition related expenses include transaction expenses paid to third-parties related to the acquisition of Riverbend, ongoing amortization of intangible assets related to the Riverbend, Corevest and 5Arches acquisitions and changes in the contingent consideration liability related to the potential earnout consideration for the acquisition of Riverbend. 5. Organizational restructuring charges for the third quarter of 2022 represents costs associated with employee severance and related transition expenses. 6. The tax effect of adjustments represent the hypothetical income taxes associated with all adjustments used to calculate EAD.
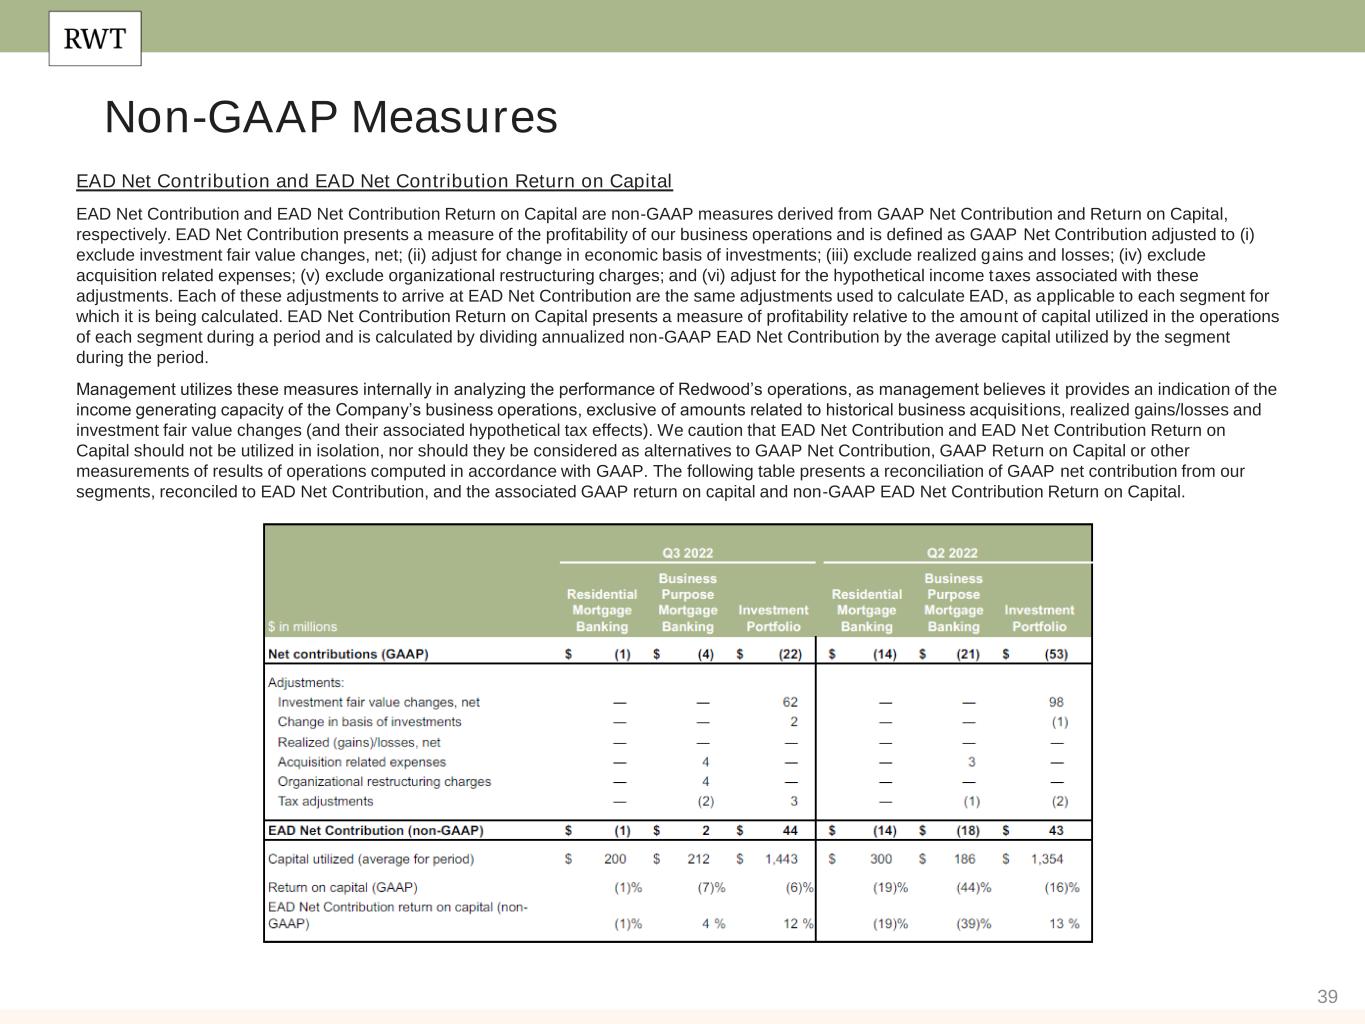
39 Non-GAAP Measures EAD Net Contribution and EAD Net Contribution Return on Capital EAD Net Contribution and EAD Net Contribution Return on Capital are non-GAAP measures derived from GAAP Net Contribution and Return on Capital, respectively. EAD Net Contribution presents a measure of the profitability of our business operations and is defined as GAAP Net Contribution adjusted to (i) exclude investment fair value changes, net; (ii) adjust for change in economic basis of investments; (iii) exclude realized gains and losses; (iv) exclude acquisition related expenses; (v) exclude organizational restructuring charges; and (vi) adjust for the hypothetical income taxes associated with these adjustments. Each of these adjustments to arrive at EAD Net Contribution are the same adjustments used to calculate EAD, as applicable to each segment for which it is being calculated. EAD Net Contribution Return on Capital presents a measure of profitability relative to the amount of capital utilized in the operations of each segment during a period and is calculated by dividing annualized non-GAAP EAD Net Contribution by the average capital utilized by the segment during the period. Management utilizes these measures internally in analyzing the performance of Redwood’s operations, as management believes it provides an indication of the income generating capacity of the Company’s business operations, exclusive of amounts related to historical business acquisit ions, realized gains/losses and investment fair value changes (and their associated hypothetical tax effects). We caution that EAD Net Contribution and EAD Net Contribution Return on Capital should not be utilized in isolation, nor should they be considered as alternatives to GAAP Net Contribution, GAAP Return on Capital or other measurements of results of operations computed in accordance with GAAP. The following table presents a reconciliation of GAAP net contribution from our segments, reconciled to EAD Net Contribution, and the associated GAAP return on capital and non-GAAP EAD Net Contribution Return on Capital.
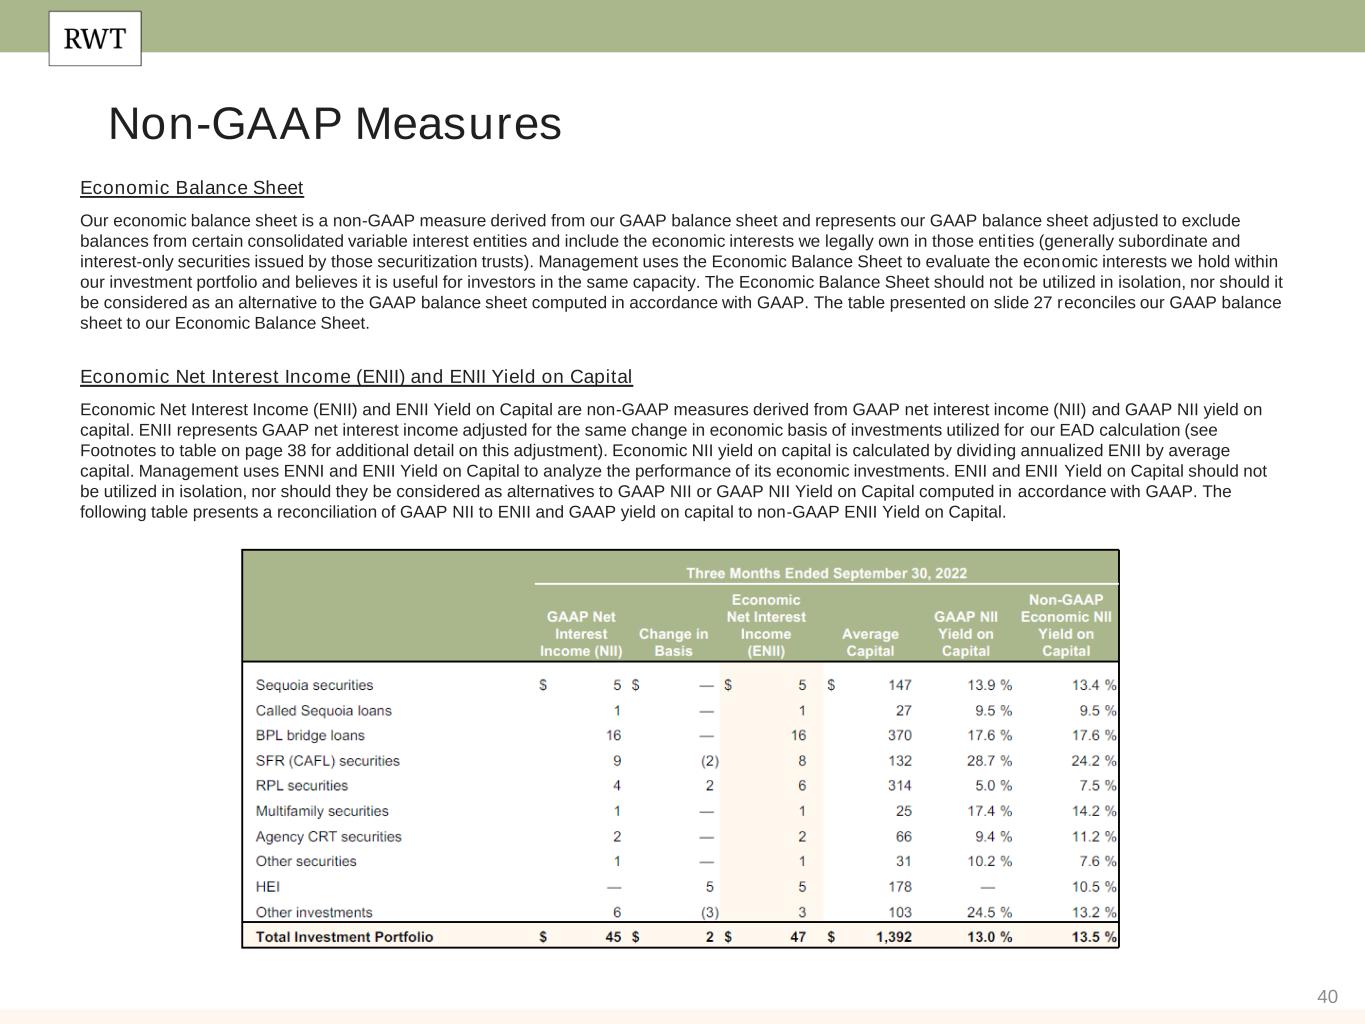
40 Non-GAAP Measures Economic Balance Sheet Our economic balance sheet is a non-GAAP measure derived from our GAAP balance sheet and represents our GAAP balance sheet adjusted to exclude balances from certain consolidated variable interest entities and include the economic interests we legally own in those enti ties (generally subordinate and interest-only securities issued by those securitization trusts). Management uses the Economic Balance Sheet to evaluate the economic interests we hold within our investment portfolio and believes it is useful for investors in the same capacity. The Economic Balance Sheet should not be utilized in isolation, nor should it be considered as an alternative to the GAAP balance sheet computed in accordance with GAAP. The table presented on slide 27 reconciles our GAAP balance sheet to our Economic Balance Sheet. Economic Net Interest Income (ENII) and ENII Yield on Capital Economic Net Interest Income (ENII) and ENII Yield on Capital are non-GAAP measures derived from GAAP net interest income (NII) and GAAP NII yield on capital. ENII represents GAAP net interest income adjusted for the same change in economic basis of investments utilized for our EAD calculation (see Footnotes to table on page 38 for additional detail on this adjustment). Economic NII yield on capital is calculated by dividing annualized ENII by average capital. Management uses ENNI and ENII Yield on Capital to analyze the performance of its economic investments. ENII and ENII Yield on Capital should not be utilized in isolation, nor should they be considered as alternatives to GAAP NII or GAAP NII Yield on Capital computed in accordance with GAAP. The following table presents a reconciliation of GAAP NII to ENII and GAAP yield on capital to non-GAAP ENII Yield on Capital.
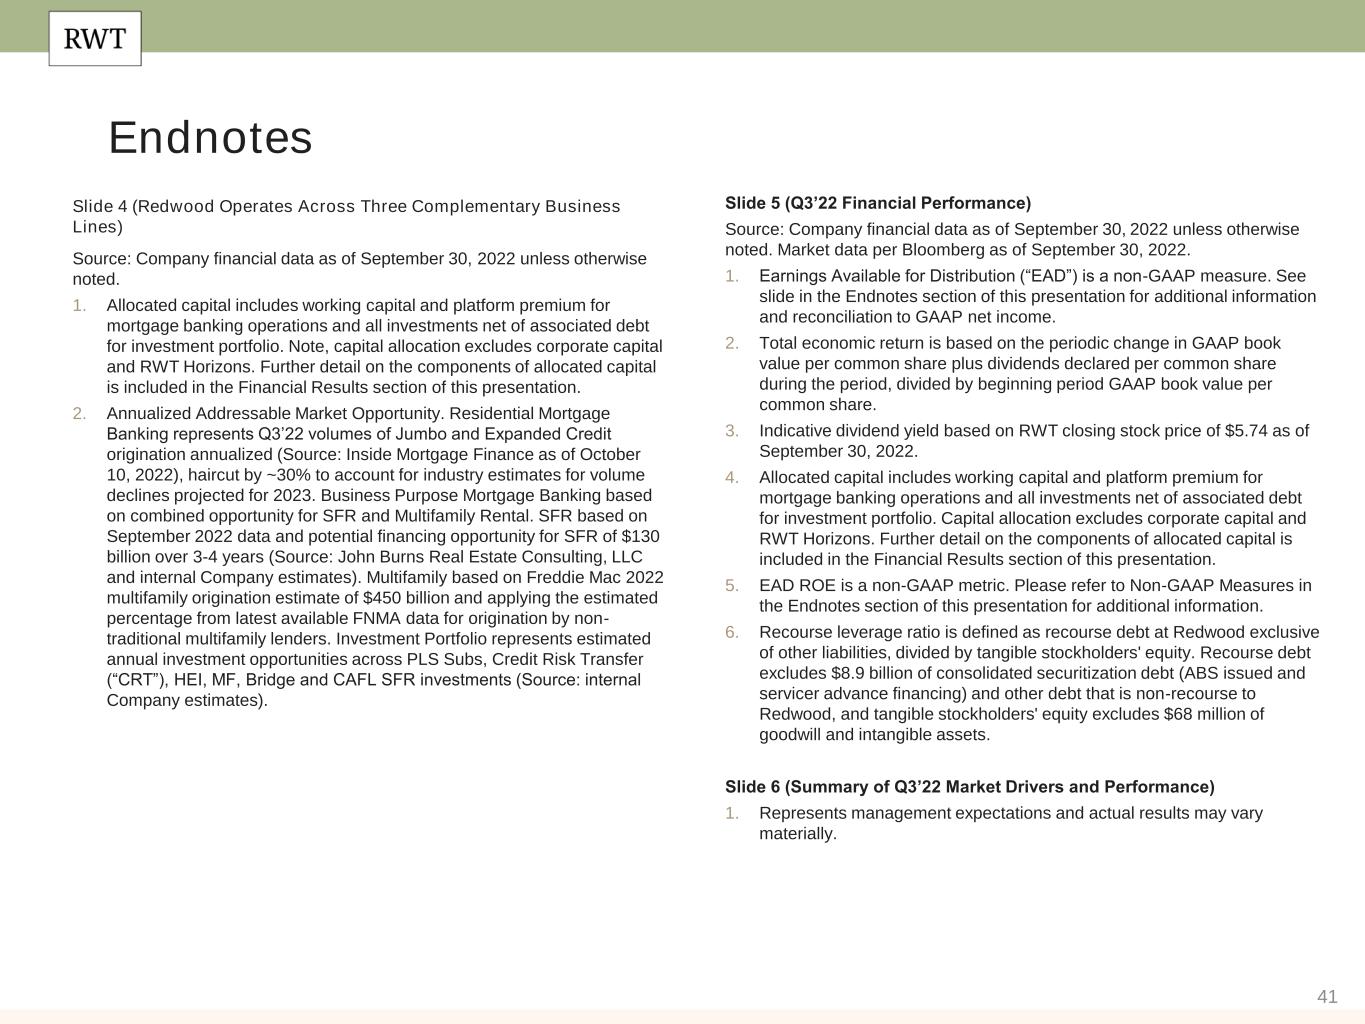
41 Slide 4 (Redwood Operates Across Three Complementary Business Lines) Source: Company financial data as of September 30, 2022 unless otherwise noted. 1. Allocated capital includes working capital and platform premium for mortgage banking operations and all investments net of associated debt for investment portfolio. Note, capital allocation excludes corporate capital and RWT Horizons. Further detail on the components of allocated capital is included in the Financial Results section of this presentation. 2. Annualized Addressable Market Opportunity. Residential Mortgage Banking represents Q3’22 volumes of Jumbo and Expanded Credit origination annualized (Source: Inside Mortgage Finance as of October 10, 2022), haircut by ~30% to account for industry estimates for volume declines projected for 2023. Business Purpose Mortgage Banking based on combined opportunity for SFR and Multifamily Rental. SFR based on September 2022 data and potential financing opportunity for SFR of $130 billion over 3-4 years (Source: John Burns Real Estate Consulting, LLC and internal Company estimates). Multifamily based on Freddie Mac 2022 multifamily origination estimate of $450 billion and applying the estimated percentage from latest available FNMA data for origination by non- traditional multifamily lenders. Investment Portfolio represents estimated annual investment opportunities across PLS Subs, Credit Risk Transfer (“CRT”), HEI, MF, Bridge and CAFL SFR investments (Source: internal Company estimates). Endnotes Slide 5 (Q3’22 Financial Performance) Source: Company financial data as of September 30, 2022 unless otherwise noted. Market data per Bloomberg as of September 30, 2022. 1. Earnings Available for Distribution (“EAD”) is a non-GAAP measure. See slide in the Endnotes section of this presentation for additional information and reconciliation to GAAP net income. 2. Total economic return is based on the periodic change in GAAP book value per common share plus dividends declared per common share during the period, divided by beginning period GAAP book value per common share. 3. Indicative dividend yield based on RWT closing stock price of $5.74 as of September 30, 2022. 4. Allocated capital includes working capital and platform premium for mortgage banking operations and all investments net of associated debt for investment portfolio. Capital allocation excludes corporate capital and RWT Horizons. Further detail on the components of allocated capital is included in the Financial Results section of this presentation. 5. EAD ROE is a non-GAAP metric. Please refer to Non-GAAP Measures in the Endnotes section of this presentation for additional information. 6. Recourse leverage ratio is defined as recourse debt at Redwood exclusive of other liabilities, divided by tangible stockholders' equity. Recourse debt excludes $8.9 billion of consolidated securitization debt (ABS issued and servicer advance financing) and other debt that is non-recourse to Redwood, and tangible stockholders' equity excludes $68 million of goodwill and intangible assets. Slide 6 (Summary of Q3’22 Market Drivers and Performance) 1. Represents management expectations and actual results may vary materially.

42 Endnotes Slide 7 (Q3’22 Business Performance) Source: Company financial data as of September 30, 2022. 1. Non-marginable debt and marginable debt refers to whether such debt is subject to margin calls based solely on the lender’s determination, in its discretion, of the market value of underlying collateral that is non- delinquent. 2. Lock volume does not account for potential fallout from pipeline that typically occurs through the lending process. 3. Total net loan exposure represents the sum of $0.7 billion of loans held on balance sheet and $0.1 billion of loans identified for purchase (locked loans not yet purchased), less $0.1 billion of loans subject to forward sale commitments, each at September 30, 2022. 4. Represents activity that occurred during Q4’22. Slide 8 (Q3’22 Corporate Highlights) Source: Company financial data as of September 30, 2022 unless otherwise noted. 1. Represents activity that occurred during Q4’22. Slide 9 (Strong Capital Position Focused on Value Creation) Source: Company financial data as of September 30, 2022 unless otherwise noted. 1. Projected forward yields on investment opportunities are based on our current market observations, estimates and assumptions, including our assumptions regarding credit losses, prepayment speeds, market interest rates, and discount rates, all of which are subject to significant uncertainty. Actual results may vary materially. Slide 10 (We Believe Our Capital Structure Represents Compelling Value) Source: Company financial data as of September 30, 2022 unless otherwise noted. 1. Projected ROE Opportunities by Investment Type are based on our current market observations, estimates and assumptions, including our assumptions regarding credit losses, prepayment speeds, market interest rates, and discount rates, all of which are subject to significant uncertainty. Actual results may vary materially. Common Stock Buyback and Convertible Debt Buyback yields are based on the trading prices of these securities as of September 30, 2022 (Source: Bloomberg). “Organic” refers to investments that are created through Redwood’s Residential and Business Purpose Mortgage Banking businesses. Slide 11 (Sources of Liquidity) Source: Company financial data as of September 30, 2022 unless otherwise noted. Slide 12 (Conservative Leverage Profile) Source: Company financial data as of September 30, 2022 unless otherwise noted. 1. Recourse leverage ratio is defined as recourse debt at Redwood divided by tangible stockholders' equity. Recourse debt excludes $8.9 billion of consolidated securitization debt (ABS issued and servicer advance financing) and other debt that is non-recourse to Redwood, and tangible stockholders' equity excludes $68 million of intangible assets. 2. Q3’22 mREIT Peer Leverage is based on the available recourse leverage numbers published by mREIT peers for Q3’22 as of October 26, 2022 (AGNC, ARR, DX, NLY, NYMT, MITT, TWO). Slide 13 (Funding by Business) Source: Company financial data as of September 30, 2022 unless otherwise noted. 1. Non-marginable debt and marginable debt refers to whether such debt is subject to margin calls based solely on the lender’s determination, in its discretion, of the market value of underlying collateral that is non- delinquent. 2. Investment Portfolio and Business Purpose Mortgage Banking unused capacity are shown as the same given that certain financing is not mutually exclusive for certain assets in these segments. .

43 Slide 15 (Investment Portfolio) Source: Company financial data as of September 30, 2022 unless otherwise noted. 1. The projected forward economic yield is calculated using September 30, 2022 market values of the assets and associated financing in our investment portfolio and management’s projection of future cashflows from these investments. Projections are based on management’s expectations and calculations and actual results may vary materially. 2. Figures reflect our investments held in our Investment Portfolio on balance sheet and our economic interests in securities we own in securitizations we consolidate in accordance with GAAP (and excludes the assets within these consolidated securitizations that appear on our balance sheet) as of period end for each of the periods presented. 3. “HEI, Multifamily, CRT, and Other” includes $215 million of net investments in HEI assets, $53 million of multifamily securities, $70 million of CRT, $29 million of third-party securities, and $100 million of other investments. Slide 16 (We See Additional Drivers of Potential Long-Term Book Value Upside in our Securities Portfolio) Source: Company financial data as of September 30, 2022 unless otherwise noted. 1. Represents potential book value per share upside on the securities portfolio due to the net discount to par value, net of portfolio hedges. There are several factors that may impact our ability to realize all, or a portion, of this amount which may be outside our control, including credit performance and prepayment speeds. Actual realized book value returns may differ materially. 2. Source: Bloomberg (HPI LTV (Amort) %), Home Price Indexed Amortized Loan to Value. Slide 17 (Outlook for Investment Portfolio) 1. Source: John Burns Real Estate Consulting, LLC. Data subject to revisions. 2. Bloomberg available data January 1, 2013 through September 30, 2022. Endnotes Slide 18 (Investment Portfolio - SLST 2018-2) Source: Company financial data as of September 30, 2022 unless otherwise noted. 1. Source: Bloomberg (HPI LTV (Amort) %), Home Price Indexed Amortized Loan to Value. Slide 19 (Investment Portfolio - BPL Bridge Loans) Source: Company financial data as of September 30, 2022 unless otherwise noted. 1. Organically created refers to CoreVest originated bridge loans. 2. Pie charts include all CoreVest-originated bridge loans as well as those purchased from third-parties. 3. Composition percentages are based on unpaid principal balance. Slide 20 (Investment Portfolio - Home Equity Investments (“HEI”)) Source: Company financial data as of September 30, 2022. 1. Target lifetime returns are based on management’s expectations and calculations and actual results may vary materially. 2. Lifetime ROEs reflect ROEs achieved on Redwood’s existing HEI investments. 3. Underlying HEI population from October 2021 Redwood HEI securitization. Slide 21 (Business Purpose Mortgage Banking) Source: Company financial data as of September 30, 2022. 1. Composition percentages are based on unpaid principal balance. Slide 22 (Business Purpose Lending Market Opportunity) Source: Company financial data as of September 30, 2022. 1. Source: John Burns Real Estate Consulting, LLC; US Census. Data subject to revisions. 2. Market share based on combined opportunity for Single Family Rental (“SFR”) and Multifamily Rental. Business Purpose Mortgage Banking based on combined opportunity for SFR and Multifamily Rental. SFR based on September 2022 data and potential financing opportunity for SFR of $130 billion over 3-4 years (Source: John Burns Real Estate Consulting, LLC and internal Company estimates). Multifamily based on Freddie Mac 2022 multifamily origination estimate of $450 billion and applying the estimated percentage from latest available FNMA data for origination by non-traditional multifamily lenders.

44 Endnotes Slide 23 (Residential Mortgage Banking) Source: Company financial data as of September 30, 2022 unless otherwise noted. 1. Lock volume does not account for potential fallout from pipeline that typically occurs through the lending process. 2. Total net loan exposure represents the sum of $0.7 billion of loans held on balance sheet and $0.1 billion of loans identified for purchase (locked loans not yet purchased), less $0.1 billion of loans subject to forward sale commitments, each at September 30, 2022. Slide 24 (Industry Leading Distribution Platform is a Clear Differentiator) Source: Company financial data as of September 30, 2022 unless otherwise noted. Slide 25 (RWT Horizons) Source: Company financial data as of September 30, 2022 unless otherwise noted. Slide 27 (Appendix: Income Statement) 1. Net interest expense from “Corporate (unsecured debt)” consists primarily of interest expense on corporate unsecured debt as well as net interest income from Legacy Sequoia consolidated VIEs. Slide 28 (Appendix: Consolidated Balance Sheet) 1. This table provides a reconciliation of our GAAP balance sheet to our non- GAAP Economic Balance Sheet. Each line item of the GAAP balance sheet is adjusted to remove amounts from all of our consolidated variable interest entities (“VIEs”), and then adjusted to add back our economic interests in those entities. Each of our Consolidated VIEs is independent of Redwood and of each other and the assets and liabilities of these entities are not owned by and are not legal obligations of ours. Our economic interests that we add back include the securities we own in VIEs we account for under the collateralized financing entities (“CFE”) election, the assets and liabilities of our CAFL bridge securitizations and our SLST resecuritization that we view as financing vehicles, and certain other minor reclassifications between line items. 2. Includes our consolidated Legacy Sequoia, Servicing Investment, and Point entities. Slide 28 (Appendix: Consolidated Balance Sheet), Continued 3. Our Economic Balance Sheet represents a non-GAAP measure. See the “Non-GAAP Measures” section at the beginning of the Endnotes section of this document for additional information regarding this measure. 4. At September 30, 2022, and June 30, 2022, other assets at Redwood included a total of $30 million and $34 million, respectively, of assets held by third-party custodians and pledged as collateral to the GSEs in connection with credit risk-sharing arrangements. These pledged assets can only be used to settle obligations to the GSEs under these risk- sharing arrangements. Slide 29 (Appendix: Net Interest Income Analysis) 1. Interest Income, interest expense and average capital for investment portfolio assets presented in this table are in relation to our economic investments (including our economic investments in consolidated VIEs) and do not present amounts associated with the assets within VIEs that we consolidate under GAAP. See the Consolidated Balance Sheet in the Financial Results section of this presentation for additional information on our consolidated VIEs and our Economic Balance Sheet. 2. GAAP NII yield on capital represents our annualized levered yield only in respect to GAAP net interest income earned on associated investments, which for the majority of our assets represents only cash interest received for those investments and the interest expense associated with financing those investments. 3. Economic Yield on Capital is a non-GAAP measure, which for most of our investments, represents the annualized levered yield for the investment based on the implied asset yield imputed by using the carrying value of our investments at the beginning of the period being presented (which for most of our assets is also their fair value) and their projected cash flows. See the “Non-GAAP Measures” at the beginning of the Endnotes section of this document for additional information regarding this measure. 4. Several investment categories (including Sequoia securities, SFR securities, RPL securities and Other investments) include interest-only (IO) securities, for which there is a negative change in basis reflected in the non-GAAP Economic NII Yield on Capital, causing the Economic NII Yield on Capital to be lower than the GAAP NII Yield on Capital.
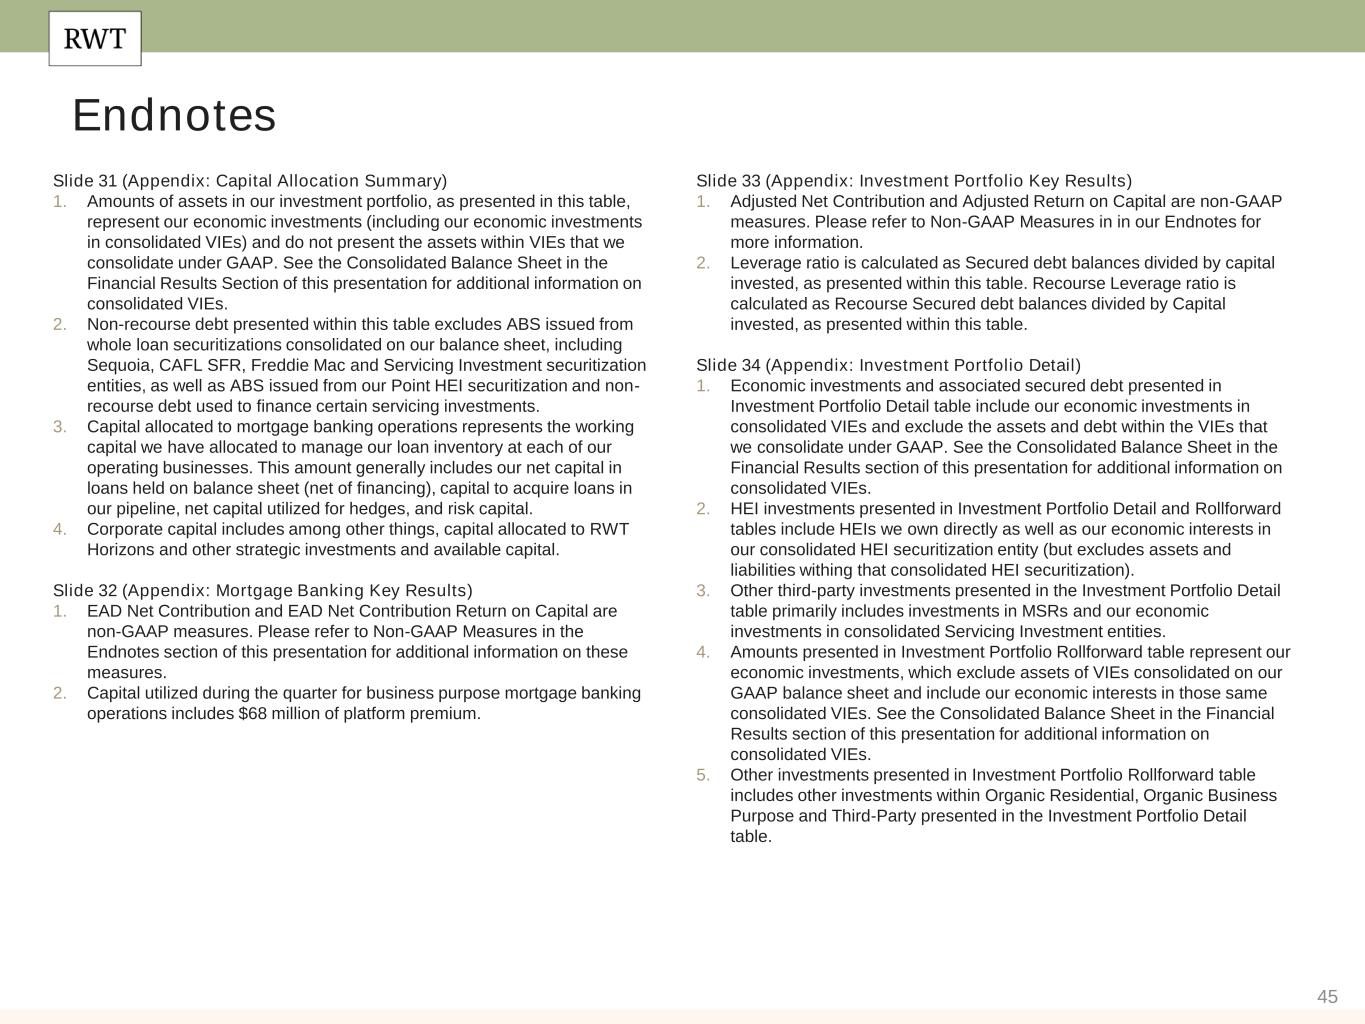
45 Endnotes Slide 31 (Appendix: Capital Allocation Summary) 1. Amounts of assets in our investment portfolio, as presented in this table, represent our economic investments (including our economic investments in consolidated VIEs) and do not present the assets within VIEs that we consolidate under GAAP. See the Consolidated Balance Sheet in the Financial Results Section of this presentation for additional information on consolidated VIEs. 2. Non-recourse debt presented within this table excludes ABS issued from whole loan securitizations consolidated on our balance sheet, including Sequoia, CAFL SFR, Freddie Mac and Servicing Investment securitization entities, as well as ABS issued from our Point HEI securitization and non- recourse debt used to finance certain servicing investments. 3. Capital allocated to mortgage banking operations represents the working capital we have allocated to manage our loan inventory at each of our operating businesses. This amount generally includes our net capital in loans held on balance sheet (net of financing), capital to acquire loans in our pipeline, net capital utilized for hedges, and risk capital. 4. Corporate capital includes among other things, capital allocated to RWT Horizons and other strategic investments and available capital. Slide 32 (Appendix: Mortgage Banking Key Results) 1. EAD Net Contribution and EAD Net Contribution Return on Capital are non-GAAP measures. Please refer to Non-GAAP Measures in the Endnotes section of this presentation for additional information on these measures. 2. Capital utilized during the quarter for business purpose mortgage banking operations includes $68 million of platform premium. Slide 33 (Appendix: Investment Portfolio Key Results) 1. Adjusted Net Contribution and Adjusted Return on Capital are non-GAAP measures. Please refer to Non-GAAP Measures in in our Endnotes for more information. 2. Leverage ratio is calculated as Secured debt balances divided by capital invested, as presented within this table. Recourse Leverage ratio is calculated as Recourse Secured debt balances divided by Capital invested, as presented within this table. Slide 34 (Appendix: Investment Portfolio Detail) 1. Economic investments and associated secured debt presented in Investment Portfolio Detail table include our economic investments in consolidated VIEs and exclude the assets and debt within the VIEs that we consolidate under GAAP. See the Consolidated Balance Sheet in the Financial Results section of this presentation for additional information on consolidated VIEs. 2. HEI investments presented in Investment Portfolio Detail and Rollforward tables include HEIs we own directly as well as our economic interests in our consolidated HEI securitization entity (but excludes assets and liabilities withing that consolidated HEI securitization). 3. Other third-party investments presented in the Investment Portfolio Detail table primarily includes investments in MSRs and our economic investments in consolidated Servicing Investment entities. 4. Amounts presented in Investment Portfolio Rollforward table represent our economic investments, which exclude assets of VIEs consolidated on our GAAP balance sheet and include our economic interests in those same consolidated VIEs. See the Consolidated Balance Sheet in the Financial Results section of this presentation for additional information on consolidated VIEs. 5. Other investments presented in Investment Portfolio Rollforward table includes other investments within Organic Residential, Organic Business Purpose and Third-Party presented in the Investment Portfolio Detail table.
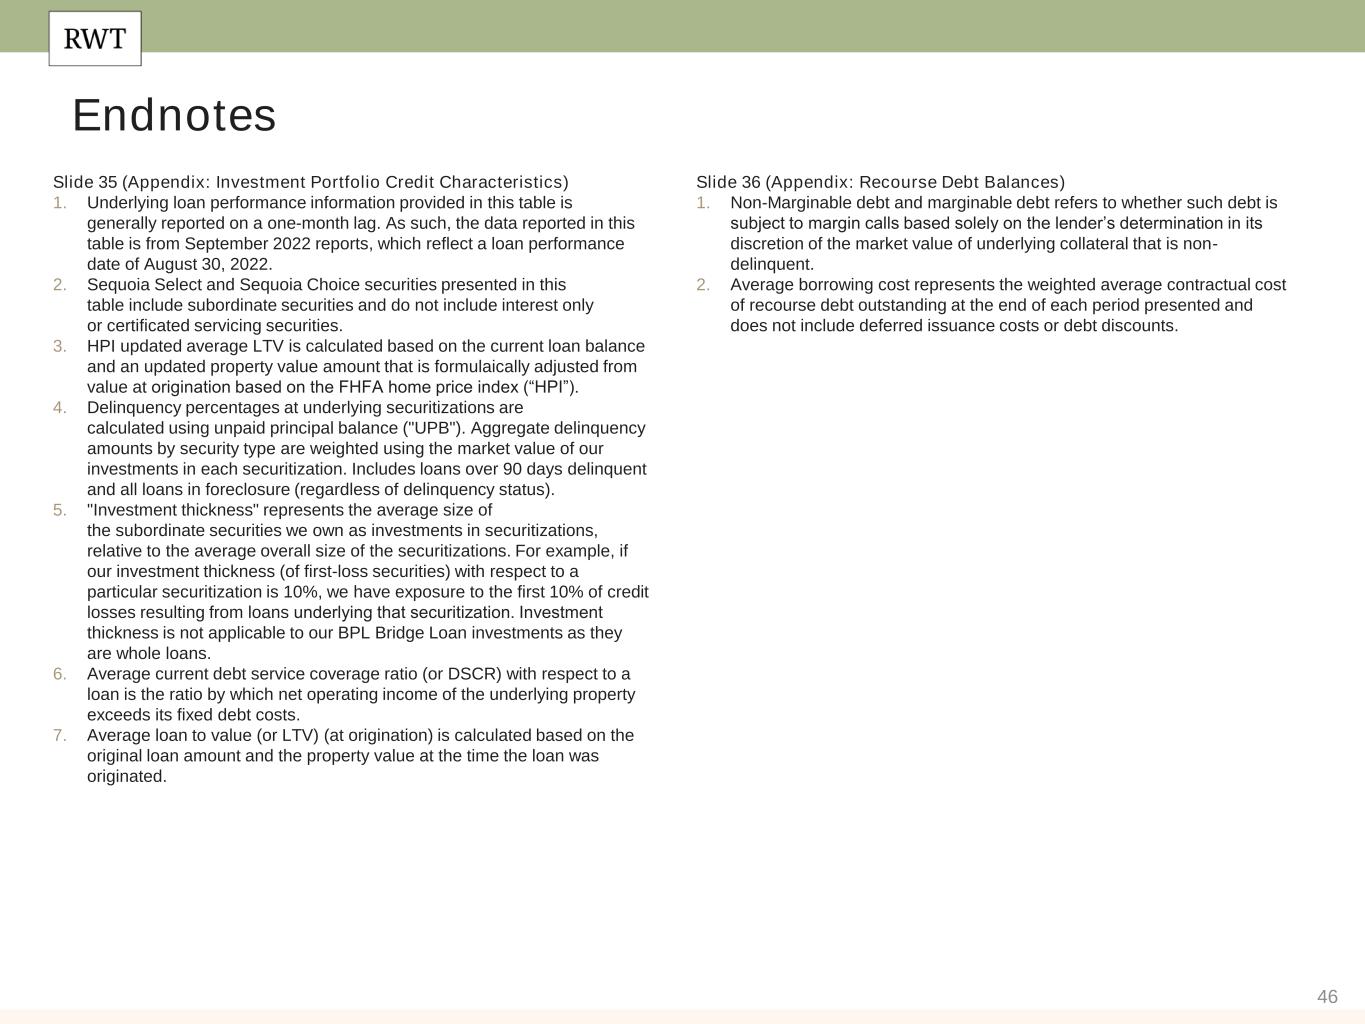
46 Endnotes Slide 35 (Appendix: Investment Portfolio Credit Characteristics) 1. Underlying loan performance information provided in this table is generally reported on a one-month lag. As such, the data reported in this table is from September 2022 reports, which reflect a loan performance date of August 30, 2022. 2. Sequoia Select and Sequoia Choice securities presented in this table include subordinate securities and do not include interest only or certificated servicing securities. 3. HPI updated average LTV is calculated based on the current loan balance and an updated property value amount that is formulaically adjusted from value at origination based on the FHFA home price index (“HPI”). 4. Delinquency percentages at underlying securitizations are calculated using unpaid principal balance ("UPB"). Aggregate delinquency amounts by security type are weighted using the market value of our investments in each securitization. Includes loans over 90 days delinquent and all loans in foreclosure (regardless of delinquency status). 5. "Investment thickness" represents the average size of the subordinate securities we own as investments in securitizations, relative to the average overall size of the securitizations. For example, if our investment thickness (of first-loss securities) with respect to a particular securitization is 10%, we have exposure to the first 10% of credit losses resulting from loans underlying that securitization. Investment thickness is not applicable to our BPL Bridge Loan investments as they are whole loans. 6. Average current debt service coverage ratio (or DSCR) with respect to a loan is the ratio by which net operating income of the underlying property exceeds its fixed debt costs. 7. Average loan to value (or LTV) (at origination) is calculated based on the original loan amount and the property value at the time the loan was originated. Slide 36 (Appendix: Recourse Debt Balances) 1. Non-Marginable debt and marginable debt refers to whether such debt is subject to margin calls based solely on the lender’s determination in its discretion of the market value of underlying collateral that is non- delinquent. 2. Average borrowing cost represents the weighted average contractual cost of recourse debt outstanding at the end of each period presented and does not include deferred issuance costs or debt discounts.