UNITED STATES OF AMERICA
SECURITIES AND EXCHANGE COMMISSION
Washington, D.C. 20549
FORM 10-K
| x |
ANNUAL REPORT PURSUANT TO SECTION 13 OR 15(d) OF THE SECURITIES EXCHANGE ACT OF 1934 |
For the Fiscal Year Ended: December 31, 2013
OR
| ¨ |
TRANSITION REPORT PURSUANT TO SECTION 13 OR 15(d) OF THE SECURITIES EXCHANGE ACT OF 1934 |
For the transition period from to
Commission file number 1-13759
REDWOOD TRUST, INC.
(Exact Name of Registrant as Specified in Its Charter)
| Maryland | 68-0329422 | |
| (State or Other Jurisdiction of Incorporation or Organization) |
(I.R.S. Employer Identification No.) |
One Belvedere Place, Suite 300
Mill Valley, California 94941
(Address of Principal Executive Offices) (Zip Code)
(415) 389-7373
(Registrant’s Telephone Number, Including Area Code)
Securities Registered Pursuant to Section 12(b) of the Act:
| Title of Each Class: |
Name of Exchange on Which Registered: | |
| Common Stock, par value $0.01 per share | New York Stock Exchange |
Securities registered pursuant to Section 12(g) of the Act: None
Indicate by check mark if the registrant is a well-known seasoned issuer, as defined in Rule 405 of the Securities Act. Yes x No ¨
Indicate by check mark if the registrant is not required to file reports pursuant to Section 13 or Section 15(d) of the Act. Yes ¨ No x
Indicate by check mark whether the registrant (1) has filed all reports required to be filed by Section 13 or 15(d) of the Securities Exchange Act of 1934 during the preceding 12 months (or for such shorter period that the registrant was required to file such reports), and (2) has been subject to such filing requirements for the past 90 days. Yes x No ¨
Indicate by check mark whether the registrant has submitted electronically and posted on its corporate Website, if any, every Interactive Data File required to be submitted and posted pursuant to Rule 405 of Regulation S-T during the preceding 12 months (or for such shorter period that the registrant was required to submit and post such files). Yes x No ¨
Indicate by check mark if disclosure of delinquent filers pursuant to Item 405 of Regulation S-K is not contained herein, and will not be contained, to the best of registrant’s knowledge, in definitive proxy or information statements incorporated by reference in Part III of this Form 10-K or any amendment to this Form 10-K. x
Indicate by check mark whether the registrant is a large accelerated filer, an accelerated filer, a non-accelerated filer, or a smaller reporting company. See definitions of “large accelerated filer,” “accelerated filer” and “smaller reporting company” in Rule 12b-2 of the Exchange Act. (Check one):
Large Accelerated Filer x Accelerated Filer ¨ Non-Accelerated Filer ¨ Smaller reporting company ¨
Indicate by check mark whether the registrant is a shell company (as defined in Rule 12b-2 of the Exchange Act). Yes ¨ No x
At June 30, 2013, the aggregate market value of the registrant’s common stock held by non-affiliates of the registrant was $1,385,595,030 based on the closing sale price as reported on the New York Stock Exchange.
The number of shares of the registrant’s Common Stock outstanding on February 21, 2014 was 82,534,625.
DOCUMENTS INCORPORATED BY REFERENCE
Portions of the registrant’s definitive Proxy Statement to be filed with the Securities and Exchange Commission under Regulation 14A within 120 days after the end of registrant’s fiscal year covered by this Annual Report are incorporated by reference into Part III.
REDWOOD TRUST, INC.
2013 ANNUAL REPORT ON FORM 10-K
i
PART I
Introduction
Redwood Trust, Inc., together with its subsidiaries, is an internally-managed specialty finance company focused on engaging in residential and commercial mortgage banking activities and investing in mortgage- and other real estate-related assets. We seek to invest in real estate-related assets that have the potential to generate attractive cash flow returns over time and to generate income through our mortgage banking activities. We operate our business in three segments: residential mortgage banking, residential investments, and commercial mortgage banking and investments.
Our primary sources of income are net interest income from our investment portfolios and income from our mortgage banking activities. Net interest income consists of the interest income we earn less the interest expenses we incur on borrowed funds and other liabilities. Income from mortgage banking activities consists of the profit we seek to generate through the acquisition or origination of loans and their subsequent sale or securitization. References herein to “Redwood,” the “company,” “we,” “us,” and “our” include Redwood Trust, Inc. and its consolidated subsidiaries, unless the context otherwise requires.
For tax purposes, Redwood Trust, Inc. is structured as a real estate investment trust (“REIT”) and we generally refer, collectively, to Redwood Trust, Inc. and those of its subsidiaries that are not subject to subsidiary-level corporate income tax as “the REIT” or “our REIT.” We generally refer to subsidiaries of Redwood Trust, Inc. that are subject to subsidiary-level corporate income tax as “our operating subsidiaries” or “our taxable REIT subsidiaries” or “TRS.” Our mortgage banking activities are generally carried out through our operating subsidiaries, while our portfolio of mortgage- and other real estate-related investments is primarily held at our REIT. We generally intend to retain profits generated and taxed at our operating subsidiaries, and to distribute as dividends at least 90% of the income we generate from the investment portfolio at our REIT.
Redwood Trust, Inc. was incorporated in the State of Maryland on April 11, 1994, and commenced operations on August 19, 1994. Our executive offices are located at One Belvedere Place, Suite 300, Mill Valley, California 94941.
Financial information concerning our business, both on a consolidated basis and with respect to each of our segments, is set forth in our consolidated financial statements and notes thereto included in this Annual Report on Form 10-K as well as in “Management’s Discussion and Analysis of Financial Condition and Results of Operations” and the supplemental financial information, which are included in Part II, Items 7 and 8 of this Annual Report on Form 10-K.
Our Operating Business Segments
Our residential mortgage banking segment primarily consists of operating a mortgage loan platform. This platform is engaged in the business of acquiring residential loans from third-party originators and then selling, financing, or securitizing those loans with the intent of profiting from these activities. Jumbo loans we acquire are typically sold through private-label securitization through our Sequoia securitization program or to institutions that acquire pools of whole loans. Loans we acquire that conform to the eligibility criteria of Fannie Mae and Freddie Mac are generally sold to these entities. Our residential loan acquisitions are usually made on a loan-by-loan, or flow basis, after origination by banks or mortgage companies, and are periodically augmented by bulk acquisitions. Our acquisition and accumulation of residential loans is generally funded with our capital and short-term debt. This segment also includes various derivative financial instruments and interest-only (“IO”) securities retained from our Sequoia securitizations that we utilize to manage certain risks associated with residential loans we acquire. Our residential mortgage banking segment’s main source of revenue is mortgage banking income, which includes valuation increases (or gains) on the loans we acquire for sale or securitization as well as valuation changes in associated derivatives and IO securities that are used in part to manage risks associated with our mortgage banking activities. Additionally, this segment may generate interest income on loans held for future sale or securitization and interest income from IO securities. Interest expense on short-term debt used to fund the purchase of residential loans, direct operating expenses and tax expenses associated with these activities are also included in the residential mortgage banking segment.
Our residential investments segment includes a portfolio of investments in residential mortgage-backed securities retained from our Sequoia securitizations, as well as residential mortgage-backed securities issued by third parties. This segment also includes mortgage servicing rights (“MSRs”) associated with residential loans securitized through our Sequoia program and MSRs purchased from third parties. The owner of an MSR is entitled to receive a portion of the interest payments from the associated residential loan and is obligated to directly service, or retain a sub-servicer to directly service, the associated loan. Residential loans for which we own
1
the MSR are directly serviced by a licensed sub-servicer we retain, as we do not originate or directly service any residential loans. Our residential investment segment’s main sources of revenue are interest income from investment portfolio securities, as well as the realized gains recognized upon sales of these securities and income from MSRs. Also included in this segment is interest expense on the short-term debt and asset-backed securities used to partially finance certain of these securities, as well as direct operating expenses and tax provisions associated with these activities.
Our commercial mortgage banking and investments segment consists of our commercial mortgage banking operations as well as our portfolio of held-for-investment commercial real estate loans. We operate as a commercial real estate lender by originating mortgage loans and providing other forms of commercial real estate financing. This may include senior or subordinate mortgage loans, mezzanine loans, and other forms of financing, such as preferred equity interests in special purpose entities that own commercial real estate. We typically sell the senior loans we originate to third parties for securitization and the mezzanine and subordinate loans we originate are generally held for investment. This segment also includes derivative financial instruments we utilize to manage certain risks associated with our commercial loan origination activity. Our commercial mortgage banking and investments segment’s main sources of revenue are interest income from our commercial loan investments as well as income from mortgage banking activities, which includes valuation increases (or gains) on the senior commercial loans we originate for sale as well as valuation changes in associated derivatives that are used to manage risks associated with our mortgage banking activities. Interest expense from our Commercial Securitization and from short-term debt used to fund the purchase of commercial loans as well as operating expenses and the tax provisions associated with these activities are also included in the commercial mortgage banking segment.
Sponsored, Managed, and Consolidated Entities
Throughout our history we have sponsored or managed other investment entities, including a private limited partnership fund that we managed, the Redwood Opportunity Fund, LP (the “Fund”), as well as Acacia securitization entities, certain of which we continue to manage. The Fund was primarily invested in residential securities and the Acacia entities are primarily invested in a variety of real estate-related assets. We are not currently seeking to sponsor or manage other entities like the Fund or the Acacia securitization entities.
During the third quarter of 2011, we engaged in a transaction in which we resecuritized a pool of senior residential securities (the “Residential Resecuritization”) primarily for the purpose of obtaining permanent non-recourse financing on a portion the residential securities we hold in our investment portfolio at the REIT. Similarly, during the fourth quarter of 2012, we engaged in a transaction in which we securitized a pool of commercial loans (the “Commercial Securitization”) primarily for the purpose of obtaining permanent non-recourse financing on a portion of the commercial loans we hold in our investment portfolio at the REIT.
Many of the entities we have sponsored or managed are currently, or have been historically, recorded on our consolidated balance sheets for financial reporting purposes based upon applicable accounting guidance set forth by Generally Accepted Accounting Principles in the United States (“GAAP”). However, each of these entities is independent of Redwood and of each other and the assets and liabilities of these entities are not, respectively, owned by us or legal obligations of ours, although we are exposed to certain financial risks associated with our role as the sponsor or manager of these entities and, to the extent we hold securities issued by, or other investments in, these entities, we are exposed to the performance of these entities and the assets they hold.
Information Available on Our Website
Our website can be found at www.redwoodtrust.com. We make available, free of charge through the investor information section of our website, access to our annual reports on Form 10-K, quarterly reports on Form 10-Q, current reports on Form 8-K, and amendments to those reports filed or furnished pursuant to Section 13(a) or 15(d) of the U.S. Securities Exchange Act of 1934, as well as proxy statements, as soon as reasonably practicable after we electronically file such material with, or furnish it to, the U.S. Securities and Exchange Commission (“SEC”). We also make available, free of charge, access to our charters for our Audit Committee, Compensation Committee, and Corporate Governance and Nominating Committee, our Corporate Governance Standards, and our Code of Ethics governing our directors, officers, and employees. Within the time period required by the SEC and the New York Stock Exchange, we will post on our website any amendment to the Code of Ethics and any waiver applicable to any executive officer, director, or senior officer (as defined in the Code). In addition, our website includes information concerning purchases and sales of our equity securities by our executive officers and directors, as well as disclosure relating to certain non-GAAP financial measures (as defined in the SEC’s Regulation G) that we may make public orally, telephonically, by webcast, by broadcast, or by similar means from time to time. Through the Commercial link on our website, we also disclose information about our recent originations and acquisitions of commercial loans and other commercial investments. We believe that this information may be of interest to investors in Redwood, although we may not always disclose on our website each new commercial loan or other new commercial investment we originate or acquire due to, among other reasons, confidentiality obligations to the borrowers of those loans or counterparties to those investments. The information on our website is not part of this Annual Report on Form 10-K.
2
Our Investor Relations Department can be contacted at One Belvedere Place, Suite 300, Mill Valley, CA 94941, Attn: Investor Relations, telephone (866) 269-4976.
Cautionary Statement
This Annual Report on Form 10-K and the documents incorporated by reference herein contain forward-looking statements within the meaning of the safe harbor provisions of the Private Securities Litigation Reform Act of 1995. Forward-looking statements involve numerous risks and uncertainties. Our actual results may differ from our beliefs, expectations, estimates, and projections and, consequently, you should not rely on these forward-looking statements as predictions of future events. Forward-looking statements are not historical in nature and can be identified by words such as “anticipate,” “estimate,” “will,” “should,” “expect,” “believe,” “intend,” “seek,” “plan” and similar expressions or their negative forms, or by references to strategy, plans, or intentions. These forward-looking statements are subject to risks and uncertainties, including, among other things, those described in this Annual Report on Form 10-K under the caption “Risk Factors.” Other risks, uncertainties, and factors that could cause actual results to differ materially from those projected are described below and may be described from time to time in reports we file with the SEC, including reports on Forms 10-Q and 8-K. We undertake no obligation to update or revise any forward-looking statements, whether as a result of new information, future events, or otherwise.
Statements regarding the following subjects, among others, are forward-looking by their nature: (i) statements we make regarding Redwood’s future business strategy and strategic focus, including statements relating to our confidence in our overall market position, strategy and long-term prospects, and our belief in the long-term efficiency of private label securitization as a form of mortgage financing; (ii) statements we make regarding the outlook for our residential business, investing in prime mortgage credit risk and our positioning to pursue investments in conforming credit through potential risk-sharing arrangements (recourse and other types) with the GSEs; (iii) our belief that triple-A investors will return to the private label securitization market for prime quality loans when improved securitization structures and issuer best practices become more widely adopted by participants, and our expectation that subordination levels will decline over time, reflecting the performance of the underlying collateral, and that this will improve the economics for issuers such as Redwood; (iv) statements we make regarding GSE reform legislation, including that the private sector will become the provider of first-loss credit risk, ahead of a government guarantee, and the opportunity this presents for private credit risk investors with loan acquisition platforms, such as Redwood; (v) our expectations regarding our loan sale distribution via whole loan sales and securitizations, our expectation to complete a securitization late in the first quarter or early in the second quarter of 2014 and our outlook for residential loan sale profit margins, including our statement that we believe we can generate attractive loan sale profit margins within our long-term target range of 25 to 50 basis points; (vi) statements relating to acquiring residential mortgage loans in the future that we have identified for purchase, including the amount of such loans that we identified for purchase at December 31, 2013; (vii) statements relating to our expectation to increase the number of sellers we acquire loans from; (viii) statements relating to the volume of jumbo and conforming residential mortgage loans expected to be available for purchase during 2014, including that we expect the decline in our jumbo loan acquisition volume from 2013 to be less than the decline projected for the industry as a whole, and our goal to ramp up to a run rate of $1 billion per month of conforming loan acquisitions by the end of 2014; (ix) our outlook and expectations relating to our commercial real estate platform, including statements regarding our expectations regarding improvement in underlying commercial real estate fundamentals and potential refinancing opportunities for lenders with established commercial loan origination platforms such as Redwood, and our plans to expand our commercial platform in 2014 by adding originators, (x) our expectations regarding the volume of senior and mezzanine commercial loans that we will originate in 2014, and our expectation that the amount of capital we had previously allocated to fund commercial mortgage banking and investment activities should remain adequate for us to continue growing this platform, and statements relating to the possibility of raising dedicated capital for our commercial platform; (xi) statements relating to our estimate of our investment capacity (including that we estimate our investment capacity at December 31, 2013 to be approximately $130 million) and our statement that we believe this level of investment capacity and liquidity should be sufficient to fund our business and investment objectives for most or all of 2014; and (xii) statements regarding our expectations and estimates relating to the characterization for income tax purposes of our dividend distributions, our expectations and estimates relating to tax accounting, tax liabilities and tax savings, and GAAP tax provisions, our estimates of REIT taxable income and TRS taxable income, and our anticipation of additional credit losses for tax purposes in future periods (and, in particular, our statement that, for tax purposes, we expect an additional $59 million of tax credit losses on residential securities we currently own to be realized over an estimated three- to five-year period).
Important factors, among others, that may affect our actual results include: general economic trends, Federal Reserve monetary policy, the performance of the housing, commercial real estate, mortgage, credit, and broader financial markets, and their effects on the prices of earning assets and the credit status of borrowers; federal and state legislative and regulatory developments, and the actions of governmental authorities, including those affecting the mortgage industry or our business; our exposure to credit risk and the timing of credit losses within our portfolio; the concentration of the credit risks we are exposed to, including due to the structure of assets we hold and the geographical concentration of real estate underlying assets we own; the efficacy and expense of our efforts to
3
manage or hedge credit risk, interest rate risk, and other financial and operational risks; changes in credit ratings on assets we own and changes in the rating agencies’ credit rating methodologies; changes in interest rates; changes in mortgage prepayment rates; the availability of assets for purchase at attractive prices and our ability to reinvest cash we hold; changes in the values of assets we own; changes in liquidity in the market for real estate securities and loans; our ability to finance the acquisition of real estate-related assets with short-term debt; the ability of counterparties to satisfy their obligations to us; our involvement in securitization transactions, the timing and profitability of those transactions, and the risks we are exposed to in engaging in securitization transactions; exposure to claims and litigation, including litigation arising from our involvement in securitization transactions; whether we have sufficient liquid assets to meet short-term needs; our ability to successfully compete and retain or attract key personnel; our ability to adapt our business model and strategies to changing circumstances; changes in our investment, financing, and hedging strategies and new risks we may be exposed to if we expand our business activities; exposure to environmental liabilities and the effects of global climate change; failure to comply with applicable laws and regulations; our failure to maintain appropriate internal controls over financial reporting and disclosure controls and procedures; the impact on our reputation that could result from our actions or omissions or from those of others; changes in accounting principles and tax rules; our ability to maintain our status as a REIT for tax purposes; limitations imposed on our business due to our REIT status and our status as exempt from registration under the Investment Company Act of 1940; decisions about raising, managing, and distributing capital; and other factors not presently identified.
This Annual Report on Form 10-K may contain statistics and other data that in some cases have been obtained from or compiled from information made available by servicers and other third-party service providers.
Certifications
Our Chief Executive Officer and Chief Financial Officer have executed certifications dated February 25, 2014, as required by Sections 302 and 906 of the Sarbanes-Oxley Act of 2002, and we have included those certifications as exhibits to this Annual Report on Form 10-K. In addition, our Chief Executive Officer certified to the New York Stock Exchange (NYSE) on May 28, 2013 that he was unaware of any violations by Redwood Trust, Inc. of the NYSE’s corporate governance listing standards in effect as of that date.
Employees
As of December 31, 2013, Redwood employed 141 people.
General economic developments and trends and the performance of the housing, commercial real estate, mortgage finance, and broader financial markets may adversely affect our business and the value of, and returns on, real estate-related and other assets we own or may acquire and could also negatively impact our business and financial results.
Our level of business activity and the profitability of our business, as well as the values of, and the cash flows from, the assets we own, are affected by developments in the U.S. economy. As a result, negative economic developments are likely to negatively impact our business and financial results. There are a number of factors that could contribute to negative economic developments, including, but not limited to, high unemployment, rising government debt levels, U.S. fiscal and monetary policy changes, including Federal Reserve policy shifts, changing U.S. consumer spending patterns, negative developments in the housing and commercial real estate markets, and changing expectations for inflation and deflation. Personal income and unemployment levels affect borrowers’ ability to repay residential mortgage loans underlying residential real estate-related assets we own, and there is risk that economic growth and activity could be weaker than anticipated or negative.
The economic downturn that began in 2007 and the significant government interventions into the financial markets and fiscal stimulus spending that occurred in subsequent years have contributed to significantly increased U.S. budget deficits and overall debt levels. These increases have put upward pressure on interest rates and could be among the factors that could lead to higher interest rates over the long-term future. Higher long-term interest rates could adversely affect our overall business, income, and our ability to pay dividends, as discussed further below under “Interest rate fluctuations can have various negative effects on us and could lead to reduced earnings and increased volatility in our earnings.” Furthermore, our business and financial results may be harmed by our inability to accurately anticipate developments associated with changes in, or the outlook for, interest rates. In addition, near-term and long-term U.S. economic conditions are likely to be impacted by the ability of Congress and the President to effectively address policy differences regarding the U.S. federal budget, budget deficit, and debt level.
Real estate values, and the ability to generate returns by owning or taking credit risk on loans secured by real estate, are important to our business. Over the last several years, government intervention has been important to support real estate markets, the overall U.S. economy, capital markets, and mortgage markets. We expect the government will continue to gradually withdraw this support, although we remain uncertain about the extent, timing, process, and implications of any withdrawal. Mortgage markets have also received substantial U.S. government support. In particular, the government’s support of mortgage markets through its support of
4
Fannie Mae and Freddie Mac expanded in late 2008, as the U.S. Treasury Department chose to backstop these government-sponsored enterprises. The governmental support for these entities has contributed to Fannie Mae’s and Freddie Mac’s continued dominance of residential mortgage finance and securitization activity, inhibiting the return of private mortgage securitization. This support may continue for some time and could have potentially negative consequences to us, since we have traditionally taken an active role in assuming credit risk in the private sector mortgage market, including through investments in Sequoia securitizations we sponsor.
Developments relating to the fixed income and mortgage finance markets and the Federal Reserve’s statements regarding its future open market activity and monetary policy could adversely affect our future business and financial results and the value of, and returns on, real estate-related investments and other assets we own or may acquire.
During 2013 and to date in 2014, statements made by the Chair and other members of the Board of Governors of the Federal Reserve System and by other Federal Reserve Bank officials regarding the U.S. economy, future economic growth, and the Federal Reserve’s future open market activity (and the so-called “tapering” of certain of that activity relating to the acquisition of Treasury securities and mortgage-backed securities (MBS)) and monetary policy have had a significant impact on, among other things, benchmark interest rates, the value of residential mortgage loans, and, more generally, the fixed income markets. These statements, the actions of the Federal Reserve, and other factors also significantly impacted many market participants’ expectations and outlooks regarding future levels of benchmark interest rates and the expected yields these market participants would require to invest in fixed income instruments, including most residential mortgages and residential mortgage-backed securities (RMBS).
One of the immediate potential impacts of rising benchmark interest rates on our business would be a reduction in the overall value of the pool of residential mortgage loans that we own and the overall value of the pipeline of residential mortgage loans that we have identified for purchase. Rising benchmark interest rates also generally have a negative impact on the overall cost of short-term borrowings we use to finance our acquisitions and holdings of residential mortgage loans, including as a result of the requirement to post additional margin (or collateral) to lenders to offset any associated decline in value of the mortgage loans we finance with short-term borrowings. The short-term borrowings we use to finance our acquisitions and holdings of residential mortgage loans are uncommitted and have a limited term, which could result in these types of borrowings not being available in the future to fund our acquisitions and holdings and could result in our being required to sell holdings of residential mortgage loans and incur losses. Similar impacts would also be expected with respect to the short-term borrowings we use to finance our acquisitions and holdings of RMBS. In addition, any inability to fund acquisitions of mortgage loans could damage our reputation as a reliable counterparty in the mortgage finance markets.
Rising benchmark interest rates have also impacted, and are likely to continue to impact, the volume of residential mortgage loans available for purchase in the marketplace and our ability to compete to acquire residential mortgage loans as part of our residential mortgage banking activities. These impacts could result from, among other things, a lower overall volume of mortgage refinance activity by mortgage borrowers and an increased level of competition from large commercial banks that may operate with a lower cost of capital than we do, including as a result of Federal Reserve monetary policies that impact banks more favorably than us and other non-bank institutions. These and other impacts of developments of the type described above have had, and may continue to have, a negative impact on our business and results of operations and we cannot accurately predict the full extent of these impacts or for how long they may persist.
Federal and state legislative and regulatory developments and the actions of governmental authorities and entities may adversely affect our business and the value of, and the returns on, mortgages, mortgage-related securities, and other assets we own or may acquire in the future.
As noted above, our business is affected by conditions in the residential and commercial real estate markets and the broader financial markets, as well as by the financial condition and resources of other participants in these markets. These markets and many of the participants in these markets are subject to, or regulated under, various federal and state laws and regulations. In some cases, the government or government-sponsored entities, such as Fannie Mae and Freddie Mac, directly participate in these markets. In particular, because issues relating to residential real estate and housing finance can be areas of political focus, federal, state and local governments may be more likely to take actions that affect residential real estate, the markets for financing residential real estate, and the participants in residential real estate-related industries than they would with respect to other industries. As a result of the government’s statutory and regulatory oversight of the markets we participate in and the government’s direct and indirect participation in these markets, federal and state governmental actions, policies, and directives can have an adverse effect on these markets and on our business and the value of, and the returns on, mortgages, mortgage-related securities, and other assets we own or may acquire in the future, which effects may be material.
As an example, based on published data, we believe that through financing or guarantees Fannie Mae, Freddie Mac, the Federal Housing Administration, and other governmental agencies accounted for more than 85% of the financing for new residential mortgage loans in 2009, 2010, 2011, 2012 and the first nine months of 2013. As a result, most of the market for housing finance in the U.S. is effectively controlled by the federal government and can be materially affected by decisions of federal policy makers, the President,
5
and Congress. In addition, the Federal Reserve has taken certain actions (e.g., implementing a program to acquire, and now “tapering” the pace of acquiring, Treasury securities and MBS) and may take other actions that could have significant implications for mortgage-related securities pricing and the returns we expect on our mortgage-related assets. Financial regulators globally are coordinating the implementation of capital regulations under the Basel III accord in an attempt to better coordinate and set capital standards for certain types of regulated financial institutions and appropriately account for risk, which may also have indirect impacts on our business and financial results.
If the federal government determines to maintain or expand its current role in the markets for financing residential mortgage loans, it may adversely affect our business or our ability to effectively compete. Even if the federal government determines to decrease its role in the markets for financing residential mortgage loans, it may establish regulations for other market participants that have an adverse effect on our ability to effectively participate or compete or which may diminish or eliminate the returns on mortgages, mortgage-related securities, and other assets we own or may acquire in the future.
Changes to income tax laws and regulations, or other tax laws or regulations, which may be enacted at the federal or state level, could also negatively impact residential and commercial real estate markets, mortgage finance markets, and our business and financial results. For example, an elimination or reduction in the current personal income tax deduction for interest payments on residential mortgage debt, which is one of the mechanisms that lawmakers have discussed in connection with resolving the U.S. federal budget deficit, could negatively impact real estate values, our business, and our financial results.
Furthermore, the credit crisis and subsequent financial turmoil prompted the federal government to put into place new statutory and regulatory frameworks and policies for reforming the U.S. financial system. These financial reforms are aimed at, among other things, promoting robust supervision and regulation of financial firms, establishing comprehensive supervision of financial markets, protecting consumers and investors from financial abuse, providing the U.S. government with additional tools to manage financial crises, and raising international regulatory standards and improving international cooperation, but their scope could be expanded beyond what has been currently enacted, implemented, and proposed. Certain financial reforms focused specifically on the issuance of asset-backed securities through securitization transactions have not been fully implemented, but are expected to include significantly enhanced disclosure requirements, risk retention requirements, and rules restricting a broad range of conflicts of interests in regard to these transactions. Implementation of financial reforms, whether through law, regulations, or policy, including changes to the manner in which financial institutions, financial products, and financial markets operate and are regulated and any related changes in the accounting standards that govern them, could adversely affect our business and financial results by subjecting us to regulatory oversight, making it more expensive to conduct our business, reducing or eliminating any competitive advantage we may have, or limiting our ability to expand, or could have other adverse effects on us.
During and since 2008, the federal government has also made available programs designed to provide homeowners with assistance in avoiding residential mortgage loan foreclosures, including through loan modification and refinancing programs. In addition, certain mortgage lenders and servicers have voluntarily, or as part of settlements with law enforcement authorities, established loan modification programs relating to the mortgages they hold or service and adopted new servicing standards intended to protect homeowners. Changes to servicing standards, whether resulting from a settlement or a change in regulation, are likely to have the effect of lengthening the time it takes for a servicer to foreclose on the property underlying a delinquent mortgage loan. Loan modification programs and changes to servicing standards and regulations, as well as future law enforcement and legislative or regulatory actions, may adversely affect the value of, and the returns on, the mortgage loans and mortgage securities we currently own or may acquire in the future.
In January 2014, new regulations promulgated by the Consumer Financial Protection Bureau (“CFPB”) under the Dodd-Frank Act became effective that require mortgage lenders, prior to originating most residential mortgage loans, to make a determination of a borrower’s ability to repay the loan and establish protections from liability under this requirement for mortgages that meet certain criteria, so-called “qualified mortgages.” Under these regulations, if a mortgage lender does not appropriately establish a borrower’s ability to repay the loan, the borrower may be able to assert against the originator of the loan or any subsequent transferee, as a defense to foreclosure by way of recoupment or setoff, a violation of the ability-to-repay regulations. The impact of these ability-to-repay regulations on the availability of mortgage credit, the mortgage finance market, and our ability to securitize residential mortgage loans is unclear. The actual short- and long-term impact of these ability-to-repay regulations on us will depend, in large part, on how the credit rating agencies, triple-A securitization investors, warehouse lenders we borrow from, and other mortgage market investors assess the investment risks that result from the new regulations, including, for example, how they assess investment risks associated with residential mortgage loans that have an interest-only payment feature or loans under which the borrower has a debt-to-income ratio of more than 43% (as these types of loans have historically accounted for a portion of the loans we have securitized, but they are not considered “qualified mortgages” under the ability-to-repay regulations). If these and other regulations have a negative impact on the volume of mortgage loan originations or on our ability to finance, sell, or securitize residential mortgage loans, it could adversely affect our business and financial results.
Over the course of 2012 and 2013, certain counties, cities and other municipalities took steps to begin to consider how the power of eminent domain could be used to acquire residential mortgage loans from private-label securitization trusts and additional
6
municipalities may be similarly considering this matter or may do so in the future. To the extent municipalities or other governmental authorities proceed to implement and carry out these or similar proposals and acquire residential mortgage loans from securitization trusts in which we hold an economic interest, there would likely be a negative impact on the value of our interests in those securitization trusts and a negative impact on our ability to engage in future securitizations (or on the returns we would otherwise expect to earn from executing future securitizations), which impacts could be material.
Ultimately, we cannot assure you of the impact that governmental actions may have on our business or the financial markets and, in fact, they may adversely affect us, possibly materially. We cannot predict whether or when such actions may occur or what unintended or unanticipated impacts, if any, such actions could have on our business and financial results. Even after governmental actions have been taken and we believe we understand the impacts of those actions, we may not be able to effectively respond to them so as to avoid a negative impact on our business or financial results.
The nature of the assets we hold and the investments we make expose us to credit risk that could negatively impact the value of those assets and investments, our earnings, dividends, cash flows, and access to liquidity, and otherwise negatively affect our business.
Overview of credit risk
We assume credit risk primarily through the ownership of securities backed by residential and commercial real estate loans and through direct investments in residential and commercial real estate loans. We may also assume similar credit risks through other types of transactions with counterparties who are seeking to reduce their exposure to credit risk. Credit losses on residential real estate loans can occur for many reasons, including: fraud; poor underwriting; poor servicing practices; weak economic conditions; increases in payments required to be made by borrowers; declines in the value of homes; earthquakes, the effects of climate change (including flooding, drought, and severe weather) and other natural events; uninsured property loss; over-leveraging of the borrower; costs of remediation of environmental conditions, such as indoor mold; changes in zoning or building codes and the related costs of compliance; acts of war or terrorism; changes in legal protections for lenders and other changes in law or regulation; and personal events affecting borrowers, such as reduction in income, job loss, divorce, or health problems. In addition, the amount and timing of credit losses could be affected by loan modifications, delays in the liquidation process, documentation errors, and other action by servicers. Weakness in the U.S. economy or the housing market could cause our credit losses to increase beyond levels that we currently anticipate.
In addition, rising interest rates may increase the credit risks associated with certain residential real estate loans. For example, the interest rate is adjustable for many of the loans held at securitization entities we have sponsored and for a portion of the loans underlying residential securities we have acquired from securitizations sponsored by others. Accordingly, when short-term interest rates rise, required monthly payments from homeowners will rise under the terms of these adjustable-rate mortgages, and this may increase borrowers’ delinquencies and defaults.
Credit losses on commercial real estate loans can occur for many of the reasons noted above for residential real estate loans. Losses on commercial real estate loans can also occur for other reasons including decreases in the net operating income from the underlying property, which could be adversely affected by a weak U.S. or international economy. Moreover, at any given time, most or all of our commercial real estate loans are not fully amortizing and, therefore, the borrower’s ability to repay the principal when due may depend upon the ability of the borrower to refinance or sell the property at maturity.
Commercial real estate loans are particularly sensitive to changes in the local economy, so even minor local adverse economic events may adversely affect the performance of commercial real estate assets. We are typically exposed to credit risk associated with both senior and subordinated commercial loans, and much of our exposure to credit risk associated with commercial loans is in the form of subordinate financing (e.g., mezzanine loans, b-notes, preferred equity, and subordinated interests in securitized pools). We directly originate commercial loans and may participate in loans originated by others (including through ownership of commercial mortgage-backed securities). Directly originating commercial loans exposes us to credit, legal, and other risks that may be greater than risks associated with loans we acquire or participate in that are originated by others. We may incur losses on commercial real estate loans and securities for reasons not necessarily related to an adverse change in the performance of the property (or properties) associated with any such loan or the loan (or loans) underlying any such security. This includes bankruptcy by the owner of the property, issues regarding the form of ownership of the property, poor property management, origination errors, inaccurate appraisals, fraud, and non-timely actions by servicers. If and when these problems become apparent, we may have little or no recourse to the borrower, issuer of the securities, or seller of the loan and we may incur credit losses as a result.
We may have heightened credit losses associated with certain securities and investments we own.
Within a securitization of residential or commercial real estate loans, various securities are created, each of which has varying degrees of credit risk. We may own the securities in which there is more (or the most) concentrated credit risk associated with the underlying real estate loans.
7
In general, losses on an asset securing a residential or commercial real estate loan included in a securitization will be borne first by the owner of the property (i.e., the owner will first lose any equity invested in the property) and, thereafter, by mezzanine or preferred equity investors, if any, then by a cash reserve fund or letter of credit, if any, then by the first-loss security holder, and then by holders of more senior securities. In the event the losses incurred upon default on the loan exceed any equity support, reserve fund, letter of credit, and classes of securities junior to those in which we invest (if any), we may not be able to recover all of our investment in the securities we hold. In addition, if the underlying properties have been overvalued by the originating appraiser or if the values subsequently decline and, as a result, less collateral is available to satisfy interest and principal payments due on the related security, then the first-loss securities may suffer a total loss of principal, followed by losses on the second-loss and then third-loss securities (or other residential and commercial securities that we own). In addition, with respect to residential securities we own, we may be subject to risks associated with the determination by a loan servicer to discontinue servicing advances (advances of mortgage interest payments not made by a delinquent borrower) if they deem continued advances to be unrecoverable, which could reduce the value of these securities or impair our ability to project and realize future cash flows from these securities.
For loans or other investments we own directly (not through a securitization structure), we will most likely be in a position to incur credit losses – should they occur – only after losses are borne by the owner of the property (e.g., by a reduction in the owner’s equity stake in the property). We may take actions available to us in an attempt to protect our position and mitigate the amount of credit losses, but these actions may not prove to be successful and could result in our increasing the amount of credit losses we ultimately incur on a loan.
The nature of the assets underlying some of the securities and investments we hold could increase the credit risk of those securities.
For certain types of loans underlying securities we may own or acquire, the loan rate or borrower payment rate may increase over time, increasing the potential for default. For example, securities may be backed by residential real estate loans that have negative amortization features. The rate at which interest accrues on these loans may change more frequently or to a greater extent than payment adjustments on an adjustable-rate loan, and adjustments of monthly payments may be subject to limitations or may be limited by the borrower’s option to pay less than the full accrual rate. As a result, the amount of interest accruing on the remaining principal balance of the loans at the applicable adjustable mortgage loan rate may exceed the amount of the monthly payment. To the extent we are exposed to it, this is particularly a risk in a rising interest rate environment. Negative amortization occurs when the resulting excess (of interest owed over interest paid) is added to the unpaid principal balance of the related adjustable mortgage loan. For certain loans that have a negative amortization feature, the required monthly payment is increased after a specified number of months or after a maximum amount of negative amortization has occurred in order to amortize fully the loan by the end of its original term. Other negative amortizing loans limit the amount by which the monthly payment can be increased, which results in a larger final payment at maturity. As a result, negatively amortizing loans have performance characteristics similar to those of balloon loans. Negative amortization may result in increases in delinquencies, loan loss severity, and loan defaults, which may, in turn, result in payment delays and credit losses on our investments. Other types of loans and investments to which we are exposed, such as hybrid loans and adjustable-rate loans, may also have greater credit risk than more traditional amortizing fixed-rate mortgage loans.
Most or all of the commercial real estate loan assets we own are only partially amortizing or do not provide for any principal amortization prior to a balloon principal payment at maturity. Commercial loans that only partially amortize or that have a balloon principal payment at maturity may have a higher risk of default at maturity than fully amortizing loans. In addition, since most of the principal of these loans is repaid at maturity, the amount of loss upon default is generally greater than on other loans that provide for more principal amortization.
We have concentrated credit risk in certain geographical regions and may be disproportionately affected by an economic or housing downturn, natural disaster, terrorist event, climate change, or any other adverse event specific to those regions.
A decline in the economy or difficulties in certain real estate markets, such as a high level of foreclosures in a particular area, are likely to cause a decline in the value of residential and commercial properties. This, in turn, will increase the risk of delinquency, default, and foreclosure on real estate underlying securities and loans we hold with properties in those regions. This may then adversely affect our credit loss experience and other aspects of our business, including our ability to securitize (or otherwise sell) real estate loans and securities.
The occurrence of a natural disaster (such as an earthquake, tornado, hurricane, or flood), or the effects of climate change (including flooding, drought, and severe weather), may cause decreases in the value of real estate (including sudden or abrupt changes) and would likely reduce the value of the properties collateralizing commercial and residential real estate loans we own or those underlying the securities or other investments we own. Since certain natural disasters may not typically be covered by the standard hazard insurance policies maintained by borrowers, the borrowers may have to pay for repairs due to the disasters. Borrowers may not repair their property or may stop paying their mortgage loans under those circumstances, especially if the property is damaged. This would likely cause foreclosures to increase and lead to higher credit losses on our loans or investments or on the pool of mortgage loans underlying securities we own.
8
A significant number of residential real estate loans that underlie the securities we own are secured by properties in California and, thus, we have a higher concentration of credit risk within California than in other states. Additional states where we have concentrations of residential loan credit risk are set forth in Note 6 to the Financial Statements within this Annual Report on Form 10-K. Balances on commercial loans we originate or otherwise acquire are larger than residential loans and we may continue to have a geographically concentrated commercial loan portfolio until our portfolio increases in size. While we intend to originate commercial loans throughout the country, our commercial loans are generally concentrated in or near major metropolitan areas. Additional information on geographic distribution of our commercial loan portfolio is set forth in Note 7 to the Financial Statements within this Annual Report on Form 10-K.
The timing of credit losses can harm our economic returns.
The timing of credit losses can be a material factor in our economic returns from residential and commercial loans, investments, and securities. If unanticipated losses occur within the first few years after a loan is originated, an investment is made, or a securitization is completed, those losses could have a greater negative impact on our investment returns than unanticipated losses on more seasoned loans, investments, or securities. In addition, higher levels of delinquencies and cumulative credit losses within a securitized loan pool can delay our receipt of principal and interest that is due to us under the terms of the securities backed by that pool. This would also lower our economic returns. The timing of credit losses could be affected by the creditworthiness of the borrower, the borrower’s willingness and ability to continue to make payments, and new legislation, legal actions, or programs that allow for the modification of loans or ability for borrowers to get relief through bankruptcy or other avenues.
Our efforts to manage credit risks may fail.
We attempt to manage risks of credit losses by continually evaluating our investments for impairment indicators and establishing reserves under GAAP for credit and other risks based upon our assessment of these risks. We cannot establish credit reserves for tax accounting purposes. The amount of reserves that we establish may prove to be insufficient, which would negatively impact our financial results and would result in earnings volatility. In addition, cash and other capital we hold to help us manage credit and other risks and liquidity issues may prove to be insufficient. If these increased credit losses are greater than we anticipated and we need to increase our credit reserves, our GAAP earnings might be reduced. Increased credit losses may also adversely affect our cash flows, ability to invest, dividend distribution requirements and payments, asset fair values, access to short-term borrowings, and ability to securitize or finance assets.
Despite our efforts to manage credit risk, there are many aspects of credit risk that we cannot control. Our quality control and loss mitigation policies and procedures may not be successful in limiting future delinquencies, defaults, and losses, or they may not be cost effective. Our underwriting reviews may not be effective. The securitizations in which we have invested may not receive funds that we believe are due from mortgage insurance companies and other counterparties. Loan servicing companies may not cooperate with our loss mitigation efforts or those efforts may be ineffective. Service providers to securitizations, such as trustees, loans servicers, bond insurance providers, and custodians, may not perform in a manner that promotes our interests. Delay of foreclosures could delay resolution and increase ultimate loss severities, as a result.
The value of the homes collateralizing or underlying residential loans or investments may decline. The value of the commercial properties collateralizing or underlying commercial loans or investments may decline. The frequency of default and the loss severity on loans upon default may be greater than we anticipate. Interest-only loans, negative amortization loans, adjustable-rate loans, larger balance loans, reduced documentation loans, subprime loans, alt-a loans, second lien loans, loans in certain locations, residential mortgage loans that are not “qualified mortgages” under regulations promulgated by the CFPB, and loans or investments that are partially collateralized by non-real estate assets may have increased risks and severity of loss. If property securing or underlying loans become real estate owned as a result of foreclosure, we bear the risk of not being able to sell the property and recovering our investment and of being exposed to the risks attendant to the ownership of real property.
Changes in consumer behavior, bankruptcy laws, tax laws, regulation of the mortgage industry, and other laws may exacerbate loan or investment losses. Changes in rules that would cause loans owned by a securitization entity to be modified may not be beneficial to our interests if the modifications reduce the interest we earn and increase the eventual severity of a loss. In some states and circumstances, the securitizations in which we invest have recourse as owner of the loan against the borrower’s other assets and income in the event of loan default. However, in most cases, the value of the underlying property will be the sole effective source of funds for any recoveries. Other changes or actions by judges or legislators regarding mortgage loans and contracts, including the voiding of certain portions of these agreements, may reduce our earnings, impair our ability to mitigate losses, or increase the probability and severity of losses. Any expansion of our loss mitigation efforts as we grow our portfolio could increase our operating costs and the expanded loss mitigation efforts may not reduce our future credit losses.
9
Credit ratings assigned to debt securities by the credit rating agencies may not accurately reflect the risks associated with those securities. Furthermore, downgrades in the credit ratings of bond insurers or any downgrades in the credit ratings of mortgage insurers could increase our credit risk, reduce our cash flows, or otherwise adversely affect our business and operations.
We generally do not consider credit ratings in assessing our estimates of future cash flows and desirability of our investments (although our assessment of the quality of an investment may prove to be inaccurate and we may incur credit losses in excess of our initial expectations). The assignment of an “investment grade” rating to a security by a rating agency does not mean that there is not credit risk associated with the security or that the risk of a credit loss with respect to such security is necessarily remote. Many of the securities we own do have credit ratings and, to the extent we securitize loans and securities, we expect to retain credit rating agencies to provide ratings on the securities created by these securitization entities (as we have in the past).
Rating agencies rate debt securities based upon their assessment of the safety of the receipt of principal and interest payments. Rating agencies do not consider the risks of fluctuations in fair value or other factors that may influence the value of debt securities and, therefore, any assigned credit rating may not fully reflect the true risks of an investment in securities. Also, rating agencies may fail to make timely adjustments to credit ratings based on available data or changes in economic outlook or may otherwise fail to make changes in credit ratings in response to subsequent events, so that our investments may be better or worse than the ratings indicate. Credit rating agencies may change their methods of evaluating credit risk and determining ratings on securities backed by real estate loans and securities. These changes may occur quickly and often. The market’s ability to understand and absorb these changes and the impact to the securitization market in general are difficult to predict. Such changes may have an impact on the amount of investment-grade and non-investment-grade securities that are created or placed on the market in the future. Downgrades to the ratings of securities could have an adverse effect on the value of some of our investments and our cash flows from those investments.
Currently, and in the future, some of the loans we own or that underlie mortgage-backed securities we own may be insured in part by mortgage insurers or financial guarantors. Mortgage insurance protects the lender or other holder of a loan up to a specified amount, in the event the borrower defaults on the loan. Mortgage insurance is generally obtained only when the principal amount of the loan at the time of origination is greater than 80% of the value of the property (loan-to-value), although it may not always be obtained in these circumstances. Any inability of the mortgage insurers to pay in full the insured portion of the loans that we hold would adversely affect the value of the securities we own that are backed by these loans, which could increase our credit risk, reduce our cash flows, or otherwise adversely affect our business.
Changes in prepayment rates of residential mortgage loans could reduce our earnings, dividends, cash flows, and access to liquidity. Similarly, with respect to commercial real estate loans, borrowers’ decisions to prepay or extend loans could reduce our earnings, dividends, cash flows, and access to liquidity.
The economic returns we earn from most of the residential real estate securities and loans we own (directly or indirectly) are affected by the rate of prepayment of the underlying residential mortgage loans. Prepayments are difficult to accurately predict and adverse changes in the rate of prepayment could reduce our cash flows, earnings, and dividends. Adverse changes in cash flows would likely reduce the fair values of many of our assets, which could reduce our ability to borrow against our assets and may cause market valuation adjustments for GAAP purposes, which could reduce our reported earnings. While we estimate prepayment rates to determine the effective yield of our assets and valuations, these estimates are not precise and prepayment rates do not necessarily change in a predictable manner as a function of interest rate changes. Prepayment rates can change rapidly. As a result, changes can cause volatility in our financial results, affect our ability to securitize assets, affect our ability to fund acquisitions, and have other negative impacts on our ability to generate earnings.
We own a number of securities backed by residential loans that are particularly sensitive to changes in prepayments rates. These securities include interest-only securities (IOs) that we acquire from third parties and from our Sequoia entities. Faster prepayments than we anticipated on the underlying loans backing these IOs will have an adverse effect on our returns on these investments and may result in losses. Similarly, we own mortgage servicing rights, or MSRs, associated with residential mortgage loans that are particularly sensitive to changes in prepayments rates. As the owner of an MSR, we are entitled to a portion of the interest payments made by the borrower in respect of the associated loan and we are responsible for hiring and compensating a sub-servicer to directly service the associated loan. Faster prepayments than we anticipate on loans associated with MSRs we own will have an adverse effect on our returns from these MSRs and may result in losses.
Some of the commercial real estate loans we originate or hold may allow the borrower to make prepayments without incurring a prepayment penalty and some may include provisions allowing the borrower to extend the term of the loan beyond the originally scheduled maturity. Because the decision to prepay or extend a commercial loan is controlled by the borrower, we may not accurately anticipate the timing of these events, which could affect the earnings and cash flows we anticipate and could impact our ability to finance these assets.
10
Interest rate fluctuations can have various negative effects on us and could lead to reduced earnings and increased volatility in our earnings.
Changes in interest rates, the interrelationships between various interest rates, and interest rate volatility could have negative effects on our earnings, the fair value of our assets and liabilities, loan prepayment rates, and our access to liquidity. Changes in interest rates can also harm the credit performance of our assets. We generally seek to hedge some but not all interest rate risks. Our hedging may not work effectively and we may change our hedging strategies or the degree or type of interest rate risk we assume.
Some of the loans and securities we own or may acquire have adjustable-rate coupons (i.e., they may earn interest at a rate that adjusts periodically based on an interest rate index). The cash flows we receive from these assets may vary as a function of interest rates, as may the reported earnings generated by these assets. We also acquire loans and securities for future sale, as assets we are accumulating for securitization, or as a longer term investment. We expect to fund assets with a combination of equity, fixed rate debt and adjustable rate debt. To the extent we use adjustable rate debt to fund assets that have a fixed interest rate (or use fixed rate debt to fund assets that have an adjustable interest rate), an interest rate mismatch could exist and we could, for example, earn less (and fair values could decline) if interest rates rise, at least for a time. We may or may not seek to mitigate interest rate mismatches for these assets with hedges such as interest rate agreements and other derivatives and, to the extent we do use hedging techniques, they may not be successful.
Higher interest rates generally reduce the fair value of many of our assets, with the exception of our adjustable-rate assets. This may affect our earnings results, reduce our ability to securitize, re-securitize, or sell our assets, or reduce our liquidity. Higher interest rates could reduce the ability of borrowers to make interest payments or to refinance their loans. Higher interest rates could reduce property values and increased credit losses could result. Higher interest rates could reduce mortgage originations, thus reducing our opportunities to acquire new assets.
When short-term interest rates are high relative to long-term interest rates, an increase in adjustable-rate residential loan prepayments may occur, which would likely reduce our returns from owning interest-only securities backed by adjustable-rate residential loans.
We have significant investment and reinvestment risks.
New assets we originate or acquire may not generate yields as attractive as yields on our current assets, which could result in a decline in our earnings per share over time.
Assets we originate or acquire may not generate the economic returns and GAAP yields we expect. Realized cash flow could be significantly lower than expected and returns from new asset originations and acquisitions could be negative. In order to maintain our portfolio size and our earnings, we must reinvest in new assets a portion of the cash flows we receive from principal, interest, and sales. We receive monthly payments from many of our assets, consisting of principal and interest. In addition, occasionally some of our residential securities are called (effectively sold). We may also sell assets from time to time as part of our portfolio and capital management strategies. Principal payments, calls, and sales reduce the size of our current portfolio and generate cash for us.
If the assets we acquire in the future earn lower GAAP yields than do the assets we currently own, our reported earnings per share could decline over time as the older assets are paid down, are called, or are sold, assuming comparable expenses, credit costs, and market valuation adjustments. Under the effective yield method of accounting that we use for GAAP purposes for some of our assets, we recognize yields on assets based on our assumptions regarding future cash flows. A portion of the cash flows we receive may be used to reduce our basis in these assets. As a result of these various factors, our basis for GAAP amortization purposes may be lower than their current fair values. Assets with a lower GAAP basis than current fair values generate higher GAAP yields, yields that are not necessarily available on newly acquired assets. Future economic conditions, including credit results, prepayment patterns, and interest rate trends, are difficult to project with accuracy over the life of the assets we acquire, so there will be volatility in the reported returns over time.
Our growth may be limited if assets are not available or not available at attractive prices.
To reinvest proceeds from principal repayments and deploy capital we raise, we must originate or acquire new assets. If the availability of new assets is limited, we may not be able to originate or acquire assets that will generate attractive returns. Generally, asset supply can be reduced if originations of a particular product are reduced or if there are few sales in the secondary market of seasoned product from existing portfolios. In particular, assets we believe have a favorable risk/reward ratio may not be available for purchase.
We do not originate residential loans; rather, we rely on the origination market to supply the types of loans we seek to invest in. At times, due to increases in interest rates, heightened credit concerns, strengthened underwriting standards, increased regulation, and/or concerns about economic growth or housing values, the volume of originations may decrease significantly. For example, in recent
11
years residential mortgage interest rates were generally declining, with the result that a significant portion of industry-wide origination volumes have been related to residential borrowers refinancing existing mortgage loans. More recently, residential mortgage interest rates have been increasing or remaining steady. To the extent interest rates increase or remain steady, the volume of refinance loans is likely to decline significantly and this volume may not return to previous levels. A reduced volume of loan originations may make it difficult for us to acquire loans and securities.
We originate commercial loans, but we may not be willing to provide the level of loan proceeds to the borrower or interest rate that borrowers find acceptable or that matches our competitors. While the overall industry-wide volume of commercial real estate loan originations and financings is increasing from prior low levels, it is not at the volume the industry has experienced in the past. And, the high-quality commercial assets we seek to finance are highly sought after by numerous lenders.
The supply of new issue RMBS collateralized by jumbo mortgage loans available for purchase could be adversely affected if the economics of executing securitizations are not favorable or if the regulations governing the execution of securitizations discourage or preclude certain potential market participants from engaging in these transactions. In addition, if there is not a robust market for triple-A rated securities, the supply of real estate subordinate securities could be significantly diminished.
Investments in diverse types of assets and businesses could expose us to new, different, or increased risks.
We have invested in and may in the future invest in a variety of real estate and non-real estate related assets that may not be closely related to the types of investments we have traditionally made. Additionally, we may enter into or engage in various types of securitizations, transactions, services, and other operating businesses that are different than the types we have traditionally entered into or engaged in, including, for example, ownership of MSRs associated with residential mortgage loans, which we began to increase our holdings of during 2012 and 2013. Any of these actions may expose us to new, different, or increased investment, operational, financial, or management risks. We may invest in non-real estate asset-backed securities (ABS), corporate debt, or equity. We have invested in diverse types of IOs from residential and commercial securitizations sponsored by us or by others. The higher credit and prepayment risks associated with these types of investments may increase our exposure to losses. We may invest in non-U.S. assets that may expose us to currency risks (which we may choose not to hedge) and different types of credit, prepayment, hedging, interest rate, liquidity, legal, and other risks. We originate first mortgage commercial loans primarily for the sale to others (while, in some cases, retaining a subordinate interest in these loans or retaining subordinate financing for the same property) and this exposes us to certain representation and warranty, aggregation, market value, and other risks on loan balances in excess of our potential investments.
In addition, when investing in assets or businesses we are exposed to the risk that those assets, or interest income or revenue generated by those assets or businesses, result in our not meeting the requirements to maintain our REIT status or our status as exempt from registration under the Investment Company Act of 1940, as amended (Investment Company Act), as further described in the risk factors titled “Redwood has elected to be a REIT and, as such, is required to meet certain tests in order to maintain its REIT status. This adds complexity and costs to running our business and exposes us to additional risks” and “Conducting our business in a manner so that we are exempt from registration under, and in compliance with, the Investment Company Act may reduce our flexibility and could limit our ability to pursue certain opportunities. At the same time, failure to continue to qualify for exemption from the Investment Company Act could adversely affect us.”
We may change our investment strategy or financing plans, which may result in riskier investments and diminished returns.
We may change our investment strategy or financing plans at any time, which could result in our making investments that are different from, and possibly riskier than, the investments we have previously made or described. A change in our investment strategy or financing plans may increase our exposure to interest rate and default risk and real estate market fluctuations. Decisions to employ additional leverage could increase the risk inherent in our investment strategy. Furthermore, a change in our investment strategy could result in our making investments in new asset categories or in different proportions among asset categories than we previously have. For example, we could in the future determine to invest a greater proportion of our assets in securities backed by subprime residential mortgage loans. These changes could result in our making riskier investments, which could ultimately have an adverse effect on our financial returns. Alternatively, we could determine to change our investment strategy or financing plans to be more risk averse, resulting in potentially lower returns, which could also have an adverse effect on our financial returns.
The performance of the assets we own and the investments we make will vary and may not meet our earnings or cash flow expectations. In addition, the cash flows and earnings from, and market values of, securities, loans, and other assets we own may be volatile.
We seek to manage certain of the risks associated with acquiring, originating, holding, selling, and managing real estate loans and securities and other real estate-related investments. No amount of risk management or mitigation, however, can change the variable nature of the cash flows of, fair values of, and financial results generated by these loans, securities, and other assets. Changes in the
12
credit performance of, or the prepayments on, these investments, including real estate loans and the loans underlying these securities, and changes in interest rates impact the cash flows on these securities and investments, and the impact could be significant for our loans, securities, and other assets with concentrated risks. Changes in cash flows lead to changes in our return on investment and also to potential variability in and level of reported income. The revenue recognized on some of our assets is based on an estimate of the yield over the remaining life of the asset. Thus, changes in our estimates of expected cash flow from an asset will result in changes in our reported earnings on that asset in the current reporting period. We may be forced to recognize adverse changes in expected future cash flows as a current expense, further adding to earnings volatility.
Changes in the fair values of our assets, liabilities, and derivatives can have various negative effects on us, including reduced earnings, increased earnings volatility, and volatility in our book value.
Fair values for our assets and liabilities, including derivatives, can be volatile and our revenue and income can be impacted by changes in fair values. The fair values can change rapidly and significantly and changes can result from changes in interest rates, perceived risk, supply, demand, and actual and projected cash flows, prepayments, and credit performance. A decrease in fair value may not necessarily be the result of deterioration in future cash flows. Fair values for illiquid assets can be difficult to estimate, which may lead to volatility and uncertainty of earnings and book value.
For GAAP purposes, we may mark to market some, but not all, of the assets and liabilities on our consolidated balance sheet. In addition, valuation adjustments on certain consolidated assets and many of our derivatives are reflected in our consolidated statement of income. Assets that are funded with certain liabilities and hedges may have differing mark-to-market treatment than the liability or hedge. If we sell an asset that has not been marked to market through our consolidated statement of income at a reduced market price relative to its cost basis, our reported earnings will be reduced.
Our loan sale profit margins are generally reflective of gains (or losses) over the period from when we identify a loan for purchase until we subsequently sell or securitize the loan. These profit margins may encompass elements of positive or negative market valuation adjustments on loans, hedging gains or losses associated with related risk management activities, and any other related transaction expenses; however, under GAAP, the differing elements may be realized unevenly over the course of one or more quarters for financial reporting purposes, with the result that our financial results may be more volatile and less reflective of the underlying economics of our business activity. For example, at the end of a quarterly or annual financial reporting period, estimated market valuation adjustments on our pipeline of jumbo residential loans identified for purchase, but not yet purchased, may be a negative amount that, in accordance with GAAP, is not reflected in our financial results for that period (but would generally be reflected in a subsequent period when the associated loans are acquired). At the same time, certain offsetting hedging gains may, in accordance with GAAP, have been recorded during that period – with the result that hedging gains and offsetting negative market valuation adjustments may impact our reported financial results in different reporting periods.
Our calculations of the fair value of the securities, loans, MSRs, derivatives, and certain other assets we own or consolidate are based upon assumptions that are inherently subjective and involve a high degree of management judgment.
We report the fair values of securities, loans, MSRs, derivatives, and certain other assets at fair value on our consolidated balance sheets. In computing the fair values for these assets we may make a number of market-based assumptions, including assumptions regarding future interest rates, prepayment rates, discount rates, credit loss rates, and the timing of credit losses. These assumptions are inherently subjective and involve a high degree of management judgment, particularly for illiquid securities and other assets for which market prices are not readily determinable. For further information regarding our assets recorded at fair value see Note 5 to the Financial Statements within this Annual Report on Form 10-K. Use of different assumptions could materially affect our fair value calculations and our financial results. Further discussion of the risk of our ownership and valuation of illiquid securities is set forth in the immediately following risk factor.
Investments we make, hedging transactions that we enter into, and the manner in which we finance our investments and operations expose us to various risks, including liquidity risk, risks associated with the use of leverage, market risks, and counterparty risk.
Many of our investments have limited liquidity.
Many of the residential and commercial securities we own are generally illiquid — that is, there is not a significant pool of potential investors that are likely to invest in these, or similar, securities. This illiquidity can also exist for the residential loans we hold and commercial loans we originate. In fact, at times, the vast majority of the assets we own are illiquid. In turbulent markets, it is likely that the securities, loans, and other assets we own may become even less liquid. As a result, we may not be able to sell certain
13
assets at opportune times or at attractive prices or we may incur significant losses upon sale of these assets, should we want or need to sell them.
Our level of indebtedness and liabilities could limit cash flow available for our operations, expose us to risks that could adversely affect our business, financial condition and results of operations and impair our ability to satisfy our obligations under our convertible notes and other debt instruments.
At December 31, 2013, our total consolidated liabilities (excluding indebtedness associated with asset-backed securities issued by consolidated Sequoia entities, a residential resecuritization entity, and a commercial securitization entity, for which we are not liable) was $1.4 billion, including $287.5 million of outstanding convertible notes. We may also incur additional indebtedness to meet future financing needs. Our indebtedness could have significant negative consequences for our business, results of operations and financial condition, including:
| — | increasing our vulnerability to adverse economic and industry conditions; |
| — | limiting our ability to obtain additional financing; |
| — | requiring the dedication of a substantial portion of our cash flow from operations to service our indebtedness, thereby reducing the amount of our cash flow available for other purposes; |
| — | limiting our flexibility in planning for, or reacting to, changes in our business; |
| — | dilution experienced by our existing stockholders as a result of the conversion of the convertible notes into shares of common stock; and |
| — | placing us at a possible competitive disadvantage with less leveraged competitors and competitors that may have better access to capital resources. |
We cannot assure you that we will be able to continue to maintain sufficient cash reserves or continue to generate cash flow from operations at levels sufficient to permit us to pay principal, premium, if any, and interest on our indebtedness, or that our cash needs will not increase. If we are unable to generate sufficient cash flow or otherwise obtain funds necessary to make required payments, or if we fail to comply with the various requirements of our indebtedness then outstanding, we would be in default, which would permit the holders of the affected indebtedness to accelerate the maturity of such indebtedness and could cause defaults under our other indebtedness. Any default under any indebtedness could have a material adverse effect on our business, results of operations and financial condition. For an additional discussion of our outstanding indebtedness, see Part II, Item 7 of this Annual Report on Form 10-K under the heading “Risks Relating to Short-Term Debt Incurred Under Residential Mortgage Loan Warehouse Facilities, Securities Repurchase Facilities, and Other Short-Term Debt Facilities; and Risks Relating to Debt Incurred Under Commercial Debt Investment Repurchase Facilities”.
Our use of short-term financial leverage could expose us to increased risks.
We fund the residential and commercial loans we acquire in anticipation of a future sale or securitization with a combination of equity and short-term debt. In addition, we also make investments in securities and loans financed with short-term debt. By incurring this debt (i.e., by applying financial leverage), we expect to generate more attractive returns on our invested equity capital. However, as a result of using financial leverage (whether for the accumulation of loans or related to longer-term investments), we could also incur significant losses if our borrowing costs increase relative to the earnings on our assets and costs of any related hedges. Financing facility creditors may also force us to sell assets pledged as collateral under adverse market conditions to meet margin calls, for example, in the event of a decrease in the fair values of the assets pledged as collateral. Liquidation of the collateral could create negative tax consequences and raise REIT qualification issues. Further discussion of the risk associated with maintaining our REIT status is set forth in the risk factor titled “Redwood has elected to be a REIT and, as such, is required to meet certain tests in order to maintain its REIT status. This adds complexity and costs to running our business and exposes us to additional risks.” In addition, we make financial covenants to creditors in connection with incurring short-term debt, such as covenants relating to our maintaining a minimum amount of tangible net worth or stockholders’ equity and/or a minimum amount of liquid assets. If we fail to comply with these financial covenants we would be in default under our financing facilities, which could result in, among other things, the liquidation of collateral we have pledged pursuant to these facilities under adverse market conditions and the inability to incur additional borrowings to finance our business activities. A further discussion of financial covenants we are subject to and related risks associated with our use of short-term debt is set forth in Part II, Item 7 of this Annual Report on Form 10-K under the heading, “Risks
14
Relating to Short-Term Debt Incurred Under Residential Mortgage Loan Warehouse Facilities, Securities Repurchase Facilities, and Other Short-Term Debt Facilities; and Risks Relating to Debt Incurred Under Commercial Debt Investment Repurchase Facilities.”
The inability to access financial leverage through warehouse and repurchase facilities, credit facilities, or other forms of debt financing may inhibit our ability to execute our business plan, which could have a material adverse effect on our financial results, financial condition, and business.
Our ability to fund our business and our investment strategy depends on our securing warehouse, repurchase, or other forms of debt financing (or leverage) on acceptable terms. For example, pending the sale or securitization of a pool of mortgage loans or other assets we generally fund the acquisition of those mortgage loans or other assets through borrowings from warehouse, repurchase, and credit facilities, and other forms of short-term financing.
We cannot assure you that we will be successful in establishing sufficient sources of short-term debt when needed. In addition, because of its short-term nature, lenders may decline to renew our short-term debt upon maturity or expiration, and it may be difficult for us to obtain continued short-term financing. During certain periods, lenders may curtail their willingness to provide financing, as liquidity in short-term debt markets, including repurchase facilities and commercial paper markets, can be withdrawn suddenly, making it difficult or expensive to renew short-term borrowings as they mature. To the extent our business or investment strategy calls for us to access financing and counterparties are unable or unwilling to lend to us, then our business and financial results will be adversely affected. In addition, it is possible that lenders who provide us with financing could experience changes in their ability to advance funds to us, independent of our performance or the performance of our investments, in which case funds we had planned to be able to access may not be available to us.
Hedging activities may reduce earnings, may fail to reduce earnings volatility, and may fail to protect our capital in difficult economic environments.
We attempt to hedge certain interest rate risks (and, at times, prepayment risks and fair values) by balancing the characteristics of our assets and associated (existing and anticipated) liabilities with respect to those risks and entering into various interest rate agreements. The number and scope of the interest rate agreements we utilize may vary significantly over time. We generally seek to enter into interest rate agreements that provide an appropriate and efficient method for hedging certain risks related to changes in interest rates.
The use of interest rate agreements and other instruments to hedge certain of our risks may well have the effect over time of lowering long-term earnings to the extent these risks do not materialize. To the extent that we hedge, it is usually to seek to protect us from some of the effects of short-term interest rate volatility, to lower short-term earnings volatility, to stabilize liability costs or fair values, to stabilize our economic returns from or meet rating agency requirements with respect to a securitization transaction, or to stabilize the future cost of anticipated issuance of securities by a securitization entity. Hedging may not achieve our desired goals. Hedging with respect to the pipeline of loans we plan to purchase may not be effective due to loan fallout or other reasons. Using interest rate agreements as a hedge may increase short-term earnings volatility, especially if we do not elect certain accounting treatments for our hedges. Reductions in fair values of interest rate agreements may not be offset by increases in fair values of the assets or liabilities being hedged. Conversely, increases in fair values of interest rate agreements may not fully offset declines in fair values of assets or liabilities being hedged. Changes in fair values of interest rate agreements may require us to pledge significant amounts of cash or other acceptable forms of collateral.
We also may hedge by taking short, forward, or long positions in U.S. Treasuries, mortgage securities, or other cash instruments. We may take both long and short positions in credit derivative transactions linked to real estate assets. These derivatives may have additional risks to us, such as: liquidity risk, due to fact that there may not be a ready market into which we could sell these derivatives if needed; basis risk, which could result in a decline in value or a requirement to make a cash payment as a result of changes in interest rates; and the risk that a counterparty to a derivative is not willing or able to perform its obligations to us due to its financial condition or otherwise.
Our earnings may be subject to fluctuations from quarter to quarter as a result of the accounting treatment for certain derivatives or for assets or liabilities whose terms do not necessarily match those used for derivatives, or as a result of our inability to meet the requirements necessary to obtain specific hedge accounting treatment for certain derivatives.
15
We enter into derivative contracts that may expose us to contingent liabilities and those contingent liabilities may not appear on our balance sheet. We may invest in synthetic securities, credit default swaps, and other credit derivatives, which expose us to additional risks.
We enter into derivative contracts, including interest rate swaps, options and futures, that could require us to make cash payments in certain circumstances. Potential payment obligations would be contingent liabilities and may not appear on our balance sheet. Our ability to satisfy these contingent liabilities depends on the liquidity of our assets and our access to capital and cash. The need to fund these contingent liabilities could adversely impact our financial condition.
We may in the future invest in synthetic securities, credit default swaps, and other credit derivatives that reference other real estate securities or indices. These investments may present risks in excess of those resulting from the referenced security or index. These investments are typically contractual relationships with counterparties and not acquisitions of referenced securities or other assets. In these types of investments, we have no right directly to enforce compliance with the terms of the referenced security or other assets and we have no voting or other consensual rights of ownership with respect to the referenced security or other assets. In the event of insolvency of a counterparty, we will be treated as a general creditor of the counterparty and will have no claim of title with respect to the referenced security.
Hedging activities may subject us to increased regulation.
Under the Dodd-Frank Act, there is increased regulation of companies, such as Redwood and certain of its subsidiaries, that enter into interest rate hedging agreements and other hedging instruments and derivatives. This increased regulation could result in Redwood or certain of its subsidiaries being required to register and be regulated as a commodity pool operator or a commodity trading advisor. If we are not able to maintain an exemption from these regulations, it could have a negative impact on our business or financial results. Moreover, rules requiring central clearing of certain interest rate swap and other transactions, as well as rules relating to margin and capital requirements for swap transactions and regulated participants in the swap markets, as well as other swap market regulatory reforms, may increase the cost or decrease the availability to us of hedging transactions, and may also limit our ability to include swaps in our securitization transactions.
Our results could be adversely affected by counterparty credit risk.
We have credit risks that are generally related to the counterparties with which we do business. There is a risk that counterparties will fail to perform under their contractual arrangements with us and this risk is usually more pronounced during an economic downturn. Counterparties may seek to eliminate credit exposure by entering into offsetting, or “back-to-back,” hedging transactions, and the ability of a counterparty to settle a synthetic transaction may be dependent on whether the counterparties to the back-to-back transactions perform their delivery obligations. Those risks of non-performance may differ materially from the risks entailed in exchange-traded transactions, which generally are backed by clearing organization guarantees, daily mark-to-market and settlement of positions, and segregation and minimum capital requirements applicable to intermediaries. Transactions entered into directly between parties generally do not benefit from those protections, and expose the parties to the risk of counterparty default. Furthermore, there may be practical and timing problems associated with enforcing our rights to assets in the case of an insolvency of a counterparty.
In the event a counterparty to our short-term borrowings becomes insolvent, we may fail to recover the full value of our pledged collateral, thus reducing our earnings and liquidity. In the event a counterparty to our interest rate agreements, credit default swaps, or other derivatives becomes insolvent or interprets our agreements with it in a manner unfavorable to us, our ability to realize benefits from the hedge transaction may be diminished, any cash or collateral we pledged to the counterparty may be unrecoverable, and we may be forced to unwind these agreements at a loss. In the event that one of our servicers becomes insolvent or fails to perform, loan delinquencies and credit losses may increase and we may not receive the funds to which we are entitled. We attempt to diversify our counterparty exposure and (except with respect to loan representations and warranties) attempt to limit our counterparty exposure to counterparties with investment-grade credit ratings, although we may not always be able to do so. Our counterparty risk management strategy may prove ineffective and, accordingly, our earnings and cash flows could be adversely affected.
Adverse changes to the credit rating of the U.S. government or to the credit rating of the United Kingdom or one or more of the Eurozone nations by one or more of the major credit rating agencies could negatively impact the availability and cost to us of short-term debt financing and could adversely affect our business and financial results.
It is difficult to predict the impact of any change in the credit rating of the U.S. government or the United Kingdom, or of any change in the credit rating of one or more Eurozone nations; however, any change in the outlook for, or rating of, the U.S. government’s creditworthiness or the creditworthiness of the United Kingdom or any Eurozone nations would likely have adverse
16
impacts on, among other things, the economy in the U.S., the United Kingdom, and the Eurozone, financial markets, the cost of borrowing, the financial strength of counterparties we transact business with, and the value of assets we hold. Any such adverse impacts could negatively impact the availability to us of short-term debt financing, our cost of short-term debt financing, our business, and our financial results.
Through certain of our wholly-owned subsidiaries we have engaged in the past, and plan to continue to engage, in acquiring residential mortgage loans and originating commercial mortgage loans with the intent to sell these loans to third parties or hold them as investments. Similarly, we have engaged in the past, and plan to continue to engage, in acquiring residential MSRs. These types of transactions and investments expose us to potentially material risks.
Acquiring and originating mortgage loans with intent to sell these loans to third parties generally requires us to incur short-term debt, either on a recourse or non-recourse basis, to finance the accumulation of loans or other assets prior to sale. This type of debt may not be available to us, or may only be available to us on an uncommitted basis, including in circumstances where a line of credit had previously been made available or committed to us. In addition, the terms of any available debt may be unfavorable to us or impose restrictive covenants that could limit our business and operations or the violation of which could lead to losses and inhibit our ability to borrow in the future. We expect to pledge assets we acquire to secure the short-term debt we incur. To the extent this debt is recourse to us, if the fair value of the assets pledged as collateral declines, we would be required to increase the amount of collateral pledged to secure the debt or to repay all or a portion of the debt. Furthermore, if we are unable to complete the sale of these types of assets, it could have a negative impact on our financial results. In addition, when we originate or acquire assets for a sale, we make assumptions about the cash flows that will be generated from those assets and the market value of those assets. If these assumptions are wrong, or if market values change or other conditions change, it could result in a sale that is less favorable to us than initially assumed, which would typically have a negative impact on our financial results.
Prior to originating or acquiring loans or other assets for sale, we may undertake underwriting and due diligence efforts with respect to various aspects of the loan or asset. When underwriting or conducting due diligence, we rely on resources and data available to us, which may be limited, and we rely on investigations by third parties. We may also only conduct due diligence on a sample of a pool of loans or assets we are acquiring and assume that the sample is representative of the entire pool. Our underwriting and due diligence efforts may not reveal matters which could lead to losses. If our underwriting process is not robust enough or if we do not conduct adequate due diligence, or the scope of our underwriting or due diligence is limited, we may incur losses. Losses could occur due to the fact that a counterparty that sold us a loan or other asset (or that is the obligor or a party related to an obligor of a commercial loan we originate) refuses or is unable (e.g., due to its financial condition) to repurchase that loan or asset or pay damages to us if we determine subsequent to purchase that one or more of the representations or warranties made to us in connection with the sale or origination was inaccurate.
In addition, when selling commercial or residential mortgage loans or acquiring servicing rights associated with residential mortgage loans, we typically make representations and warranties to the purchaser or to other third parties regarding, among other things, certain characteristics of those assets, including characteristics we seek to verify through our underwriting and due diligence efforts. If our representations and warranties are inaccurate with respect to any asset, we may be obligated to repurchase that asset or pay damages, which may result in a loss. We generally only establish reserves for potential liabilities relating to representations and warranties we make if we believe that those liabilities are both probable and estimable, as determined in accordance with GAAP. As a result, we may not have reserves relating to these potential liabilities or any reserves we may establish could be inadequate. Even if we obtain representations and warranties from the counterparties from whom we acquired the loans or other assets, they may not parallel the representations and warranties we make or may otherwise not protect us from losses, including, for example, due to the fact that the counterparty may be insolvent or otherwise unable to make a payment to us at the time we claim damages for a breach of representation or warranty. Furthermore, to the extent we claim that counterparties we have acquired loans from have breached their representations and warranties to us, it may adversely impact our business relationship with those counterparties, including by reducing the volume of business we conduct with those counterparties, which could negatively impact our ability to acquire loans and our business. To the extent we have significant exposure to representations and warranties made to us by one or more counterparties we acquire loans from, we may determine, as a matter of risk management, to reduce or discontinue loan acquisitions from those counterparties, which could reduce the volume of residential loans we acquire and negatively impact our business and financial results.
17
Through certain of our wholly-owned subsidiaries we have engaged in the past, and continue to engage in, securitization transactions relating to residential mortgage loans. We have in the past also engaged in, and may in the future engage in, other types of securitization transactions or similar transactions, including securitization transactions relating to commercial real estate loans and other types of commercial real estate investments. In addition, we have invested in and continue to invest in mortgage-backed securities and other ABS issued in securitization transactions sponsored by other companies. These types of transactions and investments expose us to potentially material risks.
Engaging in securitization transactions and other similar transactions generally requires us to incur short-term debt, either on a recourse or non-recourse basis, to finance the accumulation of loans or other assets prior to securitization. In addition, in connection with engaging in securitization transactions, we engage in due diligence with respect to the loans or other assets we are securitizing and make representations and warranties relating to those loans and assets. The risks associated with incurring this type of debt in connection with securitization activity and the risks associated with the due diligence we conduct, and the representations and warranties we make, in connection with securitization activity are similar to the risks associated with acquiring and originating loans with the intent to sell them to third parties, as described in the immediately preceding risk factor titled “Through certain of our wholly-owned subsidiaries we have engaged in the past, and plan to continue to engage, in acquiring residential mortgage loans and originating commercial mortgage loans with the intent to sell these loans to third parties or hold them as investments. Similarly, we have engaged in the past, and plan to continue to engage, in acquiring servicing rights associated with residential mortgage loans. These types of transactions and investments expose us to potentially material risks.”
When engaging in securitization transactions, we also prepare marketing and disclosure documentation, including term sheets and prospectuses, that include disclosures regarding the securitization transactions and the assets being securitized. If our marketing and disclosure documentation are alleged or found to contain inaccuracies or omissions, we may be liable under federal and state securities laws (or under other laws) for damages to third parties that invest in these securitization transactions, including in circumstances where we relied on a third party in preparing accurate disclosures, or we may incur other expenses and costs in connection with disputing these allegations or settling claims. We may also sell or contribute commercial real estate loans to third parties who, in turn, securitize those loans. In these circumstances, we may also prepare marketing and disclosure documentation, including documentation that is included in term sheets and prospectuses relating to those securitization transactions. We could be liable under federal and state securities laws (or under other laws) for damages to third parties that invest in these securitization transactions, including liability for disclosures prepared by third parties or with respect to loans that we did not sell or contribute to the securitization.
In recent years there has also been debate as to whether there are defects in the legal process and legal documents governing transactions in which securitization trusts and other secondary purchasers take legal ownership of residential mortgage loans and establish their rights as first priority lien holders on underlying mortgaged property. To the extent there are problems with the manner in which title and lien priority rights were established or transferred, securitization transactions that we sponsored and third-party sponsored securitizations that we hold investments in may experience losses, which could expose us to losses and could damage our ability to engage in future securitization transactions.
In connection with our operating and investment activity, we rely on third parties to perform certain services, comply with applicable laws and regulations, and carry out contractual covenants and terms, the failure of which by any of these third parties may adversely impact our business and financial results.
In connection with our business of acquiring and originating loans, engaging in securitization transactions, and investing in third-party issued securities and other assets, we rely on third party service providers to perform certain services, comply with applicable laws and regulations, and carry out contractual covenants and terms. As a result, we are subject to the risks associated with a third party’s failure to perform, including failure to perform due to reasons such as fraud, negligence, errors, miscalculations, or insolvency. For example, many loan servicers are experiencing higher volumes of delinquent loans than they have in the past and, as a result, there is a risk that their operational infrastructures cannot properly process this increased volume. Many loan servicers have been accused of improprieties in the handling of the foreclosure process with respect to residential mortgage loans that have gone into default. To the extent a third party loan servicer fails to fully and properly perform its obligations, loans and securities that we hold as investments may experience losses and securitizations that we have sponsored may experience poor performance, and our ability to engage in future securitization transactions could be harmed.
For some of the loans that we hold and for some of the loans we sell or securitize, we hold the right to service those loans and we retain a sub-servicer to service those loans. In these circumstances we are exposed to certain risks, including, without limitation, that we may not be able to enter into subservicing agreements on favorable terms to us or at all, or that the sub-servicer may not properly service the loan in compliance with applicable laws and regulations or the contractual provisions governing their sub-servicing role, and that we would be held liable for the sub-servicer’s improper acts or omissions. In addition, in these circumstances we are
18
obligated to fund any obligation of the sub-servicer to make advances on behalf of a delinquent loan obligor. We have generally used only one sub-servicer counterparty and, as a result, the risks associated with our use of a sub-servicer have been concentrated around this single sub-servicer counterparty. To the extent that there are significant amounts of advances that need to be funded in respect of loans where we own the servicing right, it could have a material adverse effect on our business and financial results.
We also rely on corporate trustees to act on behalf of us and other holders of ABS in enforcing our rights as security holders. Under the terms of most ABS we hold, we do not have the right to directly enforce remedies against the issuer of the security, but instead must rely on a trustee to act on behalf of us and other security holders. Should a trustee not be required to take action under the terms of the securities, or fail to take action, we could experience losses. In the context of our commercial mortgage banking and investment activities, we rely on third parties to manage and operate the properties that directly or indirectly collateralize our commercial loans, to generate operating results and cash flow sufficient to service our loans and support the repayment or refinancing of our loans at maturity, and to mitigate the risk of losses.
Our ability to execute or participate in future securitization transactions, including, in particular, securitizations of residential mortgage loans, could be delayed, limited, or precluded by legislative and regulatory reforms applicable to asset-backed securities and the institutions that sponsor, service, rate, or otherwise participate in or contribute to the successful execution of a securitization transaction. Other factors could also limit, delay, or preclude our ability to execute securitization transactions. These legislative, regulatory, and other factors could also reduce the returns we would otherwise expect to earn in connection with executing securitization transactions.
In July 2010, the Dodd-Frank Act was enacted. Provisions of the Dodd-Frank Act require, among other things, significant revisions to the legal and regulatory framework under which ABS, including residential mortgage-backed securities (RMBS), are issued through the execution of securitization transactions. Some of the provisions of the Dodd-Frank Act have become effective or been implemented, while others are in the process of being implemented or will become effective soon. In addition, prior to the passage of the Dodd-Frank Act, the Securities and Exchange Commission (SEC) and the Federal Deposit Insurance Corporation had already published proposed and final regulations under already existing legislative authority relating to the issuance of ABS, including RMBS. Additional federal or state laws and regulations that could affect our ability to execute future securitization transactions could be proposed, enacted, or implemented. In addition, various federal and state agencies and law enforcement authorities, as well as private litigants, have initiated and may, in the future, initiate additional broad-based enforcement actions or claims, the resolution of which may include industry-wide changes to the way residential mortgage loans are originated, transferred, serviced, and securitized, and any of these changes could also affect our ability to execute future securitization transactions. For an example, please refer to the risk factor titled “Federal and state legislative and regulatory developments and the actions of governmental authorities and entities may adversely affect our business and the value of, and the returns on, mortgages, mortgage-related securities, and other assets we own or may acquire in the future.” for a description of the settlement of a recent enforcement action that resulted in changes to mortgage loan servicing standards and a description of regulations relating to residential mortgage origination recently promulgated by the CFPB.
It is difficult to predict with certainty how the Dodd-Frank Act and the other regulations that have been proposed, finalized, or recently implemented will affect our future ability to successfully execute or participate in securitization transactions, due to, among other things, the fact that federal agencies have not yet finalized or fully implemented all of the regulations implementing the Dodd-Frank Act. In addition, recently finalized truth-in-lending regulations include provisions under which the purchaser (and assignee) of a residential mortgage loan is liable for regulatory violations by the originator of the loan. These laws, regulations, and enforcement actions and private litigation settlements could effectively preclude us from executing securitization transactions, delay our execution of these types of transactions, or reduce the returns we would otherwise expect to earn from executing securitization transactions.
Rating agencies can affect our ability to execute or participate in a securitization transaction, or reduce the returns we would otherwise expect to earn from executing securitization transactions, not only by deciding not to publish ratings for our securitization transactions (or deciding not to consent to the inclusion of those ratings in the prospectuses or other documents we file with the SEC relating to securitization transactions), but also by altering the criteria and process they follow in publishing ratings. Rating agencies could alter their ratings processes or criteria after we have accumulated loans or other assets for securitization in a manner that effectively reduces the value of those previously acquired loans or requires that we incur additional costs to comply with those processes and criteria. For example, to the extent investors in a securitization transaction would have significant exposure to representations and warranties made by us or by one or more counterparties we acquire loans from, rating agencies may determine that this exposure increases investment risks relating to the securitization transaction. Rating agencies could reach this conclusion either because of our financial condition or the financial condition of one or more counterparties we acquire loans from, or because of the aggregate amount of residential loan-related representations and warranties (or other contingent liabilities) we, or one or more
19
counterparties we acquire loans from, have made or have exposure to. If, as a result, rating agencies place limitations on our ability to execute future securitization transactions or impose unfavorable ratings levels or conditions on our securitization transactions, it could reduce the returns we would otherwise expect to earn from executing these transactions and negatively impact our business and financial results. In addition, the actual short- and long-term impact on our ability to securitize residential mortgage loans in the future will depend, in large part, on how the rating agencies assess the investment risks that result from the ability-to-repay regulations recently promulgated by the CFPB, including, for example, how they assess investment risks associated with residential mortgage loans that have an interest-only payment feature or loans under which the borrower has a debt-to-income ratio of more than 43% (as these types of loans have historically accounted for a significant amount of the loans we have securitized, but they will not be considered “qualified mortgages” under the ability-to-repay regulations).
Furthermore, other matters, such as (i) accounting standards applicable to securitization transactions and (ii) capital and leverage requirements applicable to banks’ and other regulated financial institutions’ holdings of ABS, could result in less investor demand for securities issued through securitization transactions we execute or increased competition from other institutions that originate, acquire, and hold commercial real estate loans, residential mortgage loans, and other types of assets and execute securitization transactions.
Our ability to profitably execute or participate in future securitizations transactions, including, in particular, securitizations of residential mortgage loans, is dependent on numerous factors and if we are not able to achieve our desired level of profitability or if we incur losses in connection with executing or participating in future securitizations it could have a material adverse impact on our business and financial results.
There are a number of factors that can have a significant impact on whether a securitization transaction that we execute or participate in is profitable to us or results in a loss. One of these factors is the price we pay for (or cost of originating) the mortgage loans that we securitize, which, in the case of residential mortgage loans, is impacted by the level of competition in the marketplace for acquiring residential mortgage loans and the relative desirability to originators of retaining residential mortgage loans as investments or selling them to third parties such as us. Another factor that impacts the profitability of a securitization transaction is the cost to us of the short-term debt that we use to finance our holdings of mortgage loans prior to securitization, which cost is affected by a number of factors including the availability of this type of financing to us, the interest rate on this type of financing, the duration of the financing we incur, and the percentage of our mortgage loans for which third parties are willing to provide short-term financing.
After we acquire or originate mortgage loans that we intend to securitize, we can also suffer losses if the value of those loans declines prior to securitization. Declines in the value of a residential mortgage loan, for example, can be due to, among other things, changes in interest rates, changes in the credit quality of the loan, and changes in the projected yields required by investors to invest in securitization transactions. To the extent we seek to hedge against a decline in loan value due to changes in interest rates, there is a cost of hedging that also affects whether a securitization is profitable. Other factors that can significantly affect whether a securitization transaction is profitable to us include the criteria and conditions that rating agencies apply and require when they assign ratings to the mortgage-backed securities issued in our securitization transactions, including the percentage of mortgage-backed securities issued in a securitization transaction that the rating agencies will assign a triple-A rating to, which, in the case of residential mortgage loans is also referred to as a rating agency subordination level. Rating agency subordination levels can be impacted by numerous factors, including, without limitation, the credit quality of the loans securitized, the geographic distribution of the loans to be securitized, and the structure of the securitization transaction and other applicable rating agency criteria. All other factors being equal, the greater the percentage of the mortgage-backed securities issued in a securitization transaction that the rating agencies will assign a triple-A rating to, the more profitable the transaction will be to us.
The price that investors in mortgage-backed securities will pay for securities issued in our securitization transactions also has a significant impact on the profitability of the transactions to us, and these prices are impacted by numerous market forces and factors. In addition, the underwriter(s) or placement agent(s) we select for securitization transactions, and the terms of their engagement, can also impact the profitability of our securitization transactions. Also, transaction costs incurred in executing transactions impact the profitability of our securitization transactions and any liability that we may incur, or may be required to reserve for, in connection with executing a transaction can cause a loss to us. To the extent that were are not able to profitably execute future securitizations of residential mortgage loans or other assets, including for the reasons described above or for other reasons, it could have a material adverse impact on our business and financial results.
Our past and future securitization activities or other past and future business or operating activities or practices could expose us to litigation, which may adversely affect our business and financial results.
Through certain of our wholly-owned subsidiaries we have in the past engaged in or participated in securitization transactions relating to residential mortgage loans, commercial mortgage loans, commercial real estate loans, and other types of assets. In the
20
future we expect to continue to engage in or participate in securitization transactions, including, in particular, securitization transactions relating to residential mortgage loans and commercial mortgage loans, and may also engage in other types of securitization transactions or similar transactions. Sequoia securitization entities we sponsored issued ABS backed by residential mortgage loans held by these Sequoia entities. In Acacia securitization transactions we participated in, Acacia securitization entities issued ABS backed by securities and other assets held by these Acacia entities. As a result of declining property values, increasing defaults, changes in interest rates, and other factors, the aggregate cash flows from the loans held by the Sequoia entities and the securities and other assets held by the Acacia entities may be insufficient to repay in full the principal amount of ABS issued by these securitization entities. We are not directly liable for any of the ABS issued by these entities. Nonetheless, third parties who hold the ABS issued by these entities may try to hold us liable for any losses they experience, including through claims under federal and state securities laws or claims for breaches of representations and warranties we made in connection with engaging in these securitization transactions.
For example, as discussed below in Part I, Item 3 of this Annual Report on Form 10-K, on October 15, 2010, the Federal Home Loan Bank of Chicago filed a claim in the Circuit Court of Cook County, Illinois against us and our subsidiary, Sequoia Residential Funding, Inc. The complaint relates in part to residential mortgage-backed securities that were issued by a Sequoia securitization entity and alleges that, at the time of issuance, we, Sequoia Residential Funding, Inc. and the underwriters made various misstatements and omissions about these securities in violation of Illinois state law. We have also been named in other similar lawsuits. A further discussion of these lawsuits is set forth in Note 15 to the Financial Statements within this Annual Report on Form 10-K.
Other aspects of our business operations or practices could also expose us to litigation. In the ordinary course of our business we enter into agreements relating to, among other things, loans we acquire and investments we make, assets and loans we sell, financing transactions, third parties we retain to provide us with goods and services, and our leased office space. We also regularly enter into confidentiality agreements with third parties under which we receive confidential information. If we breach any of these agreements, we could be subject to claims for damages and related litigation. We are also subject to various laws and regulations relating to our business and operations, including, without limitation, privacy laws and regulations and labor and employment laws and regulations, and if we fail to comply with these laws and regulations we could also be subjected to claims for damages and litigation. In particular, if we fail to maintain the confidentiality of consumers’ personal or financial information we obtain in the course of our business (such as social security numbers), we could be exposed to losses.
Defending a lawsuit can consume significant resources and may divert management’s attention from our operations. We may be required to establish or increase reserves for potential losses from litigation, which could be material. To the extent we are unsuccessful in our defense of any lawsuit, we could suffer losses which could be in excess of any reserves established relating to that lawsuit) and these losses could be material.
Our cash balances and cash flows may be insufficient relative to our cash needs.
We need cash to make interest payments, to post as collateral to counterparties and lenders who provide us with short-term debt financing and who engage in other transactions with us, for working capital, to fund REIT dividend distribution requirements, to comply with financial covenants and regulatory requirements, and for other needs and purposes. We may also need cash to repay short-term borrowings when due or in the event the fair values of assets that serve as collateral for that debt decline, the terms of short-term debt become less attractive, or for other reasons. In addition, we may need to use cash to post in response to margin calls relating to various derivative instruments we hold as the values of these derivatives change.
Our sources of cash flow include the principal and interest payments on the loans and securities we own, asset sales, securitizations, short-term borrowing, issuing long-term debt, and issuing stock. Our sources of cash may not be sufficient to satisfy our cash needs. Cash flows from principal repayments could be reduced if prepayments slow or if credit quality deteriorates. For example, for some of our assets, cash flows are “locked-out” and we receive less than our pro-rata share of principal payment cash flows in the early years of the investment.
Our minimum dividend distribution requirements could exceed our cash flows if our income as calculated for tax purposes significantly exceeds our net cash flows. This could occur when taxable income (including non-cash income such as discount amortization and interest accrued on negative amortizing loans) exceeds cash flows received. The Internal Revenue Code provides a limited relief provision concerning certain items of non-cash income; however, this provision may not sufficiently reduce our cash dividend distribution requirement. In the event that our liquidity needs exceed our access to liquidity, we may need to sell assets at an inopportune time, thus reducing our earnings. In an adverse cash flow situation, we may not be able to sell assets effectively and our REIT status or our solvency could be threatened. Further discussion of the risk associated with maintaining our REIT status is set forth
21
in the risk factor titled “Redwood has elected to be a REIT and, as such, is required to meet certain tests in order to maintain its REIT status. This adds complexity and costs to running our business and exposes us to additional risks.”
We are subject to competition and we may not compete successfully.
We are subject to competition in seeking investments, originating commercial loans, acquiring and selling residential loans, engaging in securitization transactions, and in other aspects of our business. Our competitors include commercial banks, other mortgage REITs, Fannie Mae, Freddie Mac, regional and community banks, broker-dealers, insurance companies, and other financial institutions, as well as investment funds and other investors in real estate-related assets. In addition, other companies may be formed that will compete with us. Some of our competitors have greater resources than us and we may not be able to compete successfully with them. Furthermore, competition for investments, making loans, acquiring and selling loans, and engaging in securitization transactions may lead to a decrease in the opportunities and returns available to us.
In addition, there are significant competitive threats to our business from governmental actions and initiatives that have already been undertaken or which may be undertaken in the future. Sustained competition from governmental actions and initiatives could have a material adverse effect on us. For example, Fannie Mae and Freddie Mac are, among other things, engaged in the business of acquiring loans and engaging in securitization transactions. Until 2008, competition from Fannie Mae and Freddie Mac was limited to some extent due to the fact that they were statutorily prohibited from purchasing loans for single unit residences in the continental United States with a principal amount in excess of $417,000, while much of our business had historically focused on acquiring residential loans with a principal amount in excess of $417,000. In February 2008, Congress passed an economic stimulus package that temporarily increased the size of certain loans these entities could purchase to up to $729,750, if the loans were made to secure real estate purchases in certain high-cost areas of the U.S. As of December 31, 2013, this $729,750 loan size limit had been reduced to $625,500, which is an amount that continues to be above the historical $417,000 loan size limit. In addition, in September 2008, Fannie Mae and Freddie Mac were placed into conservatorship and have become, in effect, instruments of the U.S. federal government. As long as there is governmental support for these entities to continue to operate and provide financing to a significant portion of the mortgage finance market, they will represent significant business competition due to, among other things, their large size and low cost of funding.
To the extent that laws, regulations, or policies governing the business activities of Fannie Mae and Freddie Mac are not further changed to limit their role in housing finance (such as a change in these loan size limits or in the guarantee fees they charge), the competition from these two governmental entities will remain significant. In addition, to the extent that property values decline while these loan size limits remain the same, it may have the same effect as an increase in this limit, as a greater percentage of loans would likely be within the size limit. Any increase in the loan size limit, or in the overall percentage of loans that are within the limit, allows Fannie Mae and Freddie Mac to compete against us to a greater extent than they had been able to compete previously and our business could be adversely affected.
Our business model and business strategies, and the actions we take (or fail to take) to implement them and adapt them to changing circumstances involve risk and may not be successful.
Due to the recent financial crisis and downturn in the U.S. real estate markets and the economy, the mortgage industry and the related capital markets are still undergoing significant changes, including due to the significant governmental interventions in these areas and changes to the laws and regulations that govern the banking and mortgage finance industry. Our methods of, and model for, doing business and financing our investments are changing and if we fail to develop, enhance, and implement strategies to adapt to changing conditions in the mortgage industry and capital markets, our business and financial results may be adversely affected. Furthermore, changes we make to our business to respond to changing circumstances may expose us to new or different risks than we were previously exposed to and we may not effectively identify or manage those risks.
Similarly, the competitive landscape in which we operate and the products and investments for which we compete are also affected by changing conditions. There may be trends or sudden changes in our industry or regulatory environment, changes in the role of government-sponsored entities, such as Fannie Mae and Freddie Mac, changes in the role of credit rating agencies or their rating criteria or processes, or changes in the U.S. economy more generally. If we do not effectively respond to these changes or if our strategies to respond to these changes are not successful, our ability to effectively compete in the marketplace may be negatively impacted, which would likely result in our business and financial results being adversely affected.
We have historically depended upon the issuance of mortgage-backed securities by the securitization entities we sponsor as a funding source for our residential real estate-related business. However, due to market conditions, we did not engage in residential mortgage securitization transactions in 2008 or 2009 and we only engaged in one residential mortgage securitization transaction in
22
2010 and two residential mortgage securitization transactions in 2011. While we engaged in numerous residential mortgage securitization transactions over the course of 2012 and 2013, we do not know if market conditions will allow us to continue to regularly engage in these types of securitization transactions and any disruption of this market may adversely affect our earnings and growth. For example, in the second half of 2013, we completed four securitization transactions, as compared to eight securitizations in the first half of 2013, representing a trend that has continued into the first quarter of 2014. Even if regular residential mortgage securitization activity continues among market participants other than government-sponsored entities, we do not know if it will continue to be on terms and conditions that will permit us to participate or be favorable to us. Even if conditions are favorable to us, we may not be able to return to or sustain the volume of securitization activity we previously conducted.
Similarly, our commercial lending platform relies on a healthy and active commercial mortgage securitization market in order to provide a source of financing for commercial mortgage loans we originate. We do not know if market conditions in commercial mortgage securitization markets will allow us to continue to regularly participate in these types of securitization transactions and any disruption of this market may also adversely affect our earnings and growth. Even if regular commercial mortgage securitization activity continues among market participants, we do not know if it will continue to be on terms and conditions that will permit us to participate or be favorable to us.
Initiating new business activities or significantly expanding existing business activities may expose us to new risks and will increase our cost of doing business.
Initiating new business activities or significantly expanding existing business activities are two ways to grow our business and respond to changing circumstances in our industry; however, they may expose us to new risks and regulatory compliance requirements. We cannot be certain that we will be able to manage these risks and compliance requirements effectively. Furthermore, our efforts may not succeed and any revenues we earn from any new or expanded business initiative may not be sufficient to offset the initial and ongoing costs of that initiative, which would result in a loss with respect to that initiative. For example, efforts we have made and continue to make to significantly expand our investing activity in commercial real-estate related assets and to develop new methods and channels for acquiring, securitizing, and selling residential and commercial real estate-related investment assets may expose us to new risks, may not succeed, and may not generate sufficient revenue to offset our related costs. We have also engaged in increasing our holdings of residential MSRs, and we recently began acquiring residential mortgage loans for sale to Fannie Mae and Freddie Mac, which enables us to create our own investments in MSRs and positions us to be involved in risk-sharing opportunities at the originator level to the extent those opportunities arise in the future, but these efforts could expose us to new risks or not succeed, and may not generate sufficient revenue to offset our related costs.
In connection with initiating new business activities or expanding existing business activities, or for other business reasons, we may create new subsidiaries. Generally, these subsidiaries would be wholly-owned, directly or indirectly, by Redwood. The creation of those subsidiaries may increase our administrative costs and expose us to other legal and reporting obligations, including, for example, because they may be incorporated in states other than Maryland or may be established in a foreign jurisdiction. Any new subsidiary we create may be designated as a taxable subsidiary. Taxable subsidiaries are wholly-owned subsidiaries of a REIT that pay corporate income tax on the income they generate. That is, a taxable subsidiary is not able to deduct its dividends paid to its parent in determining its taxable income and any dividends paid to the parent are generally recognized as income at the parent level.
Our future success depends on our ability to attract and retain key personnel.
Our future success depends on the continued service and availability of skilled personnel, including members of our executive management team such as our Chief Executive Officer, our President, our Chief Investment Officer, our Chief Financial Officer, and our General Counsel. To the extent personnel we attempt to hire are concerned that economic, regulatory, or other factors could impact our ability to maintain or expand our current level of business, it could negatively impact our ability to hire the personnel we need to operate our business. We cannot assure you that we will be able to attract and retain key personnel.
We may not be able to obtain or maintain the governmental licenses required to operate our business and we may fail to comply with various state and federal laws and regulations applicable to our business of acquiring residential mortgage loans and servicing rights and originating commercial real estate loans. We are a seller/servicer approved to sell residential mortgage loans to Freddie Mac and Fannie Mae and failure to maintain our status as an approved seller/servicer could harm our business.
While we are not required to obtain licenses to purchase mortgage-backed securities, the purchase of residential mortgage loans in the secondary market may, in some circumstances, require us to maintain various state licenses. Acquiring the right to service residential mortgage loans may also, in some circumstances, require us to maintain various state licenses even though we currently do not expect to directly engage in loan servicing ourselves. Similarly, certain commercial real estate lending activities that we engage in
23
also require us to obtain and maintain various state licenses. As a result, we could be delayed in conducting certain business if we were first required to obtain a state license. We cannot assure you that we will be able to obtain all of the licenses we need or that we would not experience significant delays in obtaining these licenses. Furthermore, once licenses are issued we are required to comply with various information reporting and other regulatory requirements to maintain those licenses, and there is no assurance that we will be able to satisfy those requirements or other regulatory requirements applicable to our business of acquiring residential mortgage loans on an ongoing basis. Our failure to obtain or maintain required licenses or our failure to comply with regulatory requirements that are applicable to our business of acquiring residential mortgage loans or originating commercial loans may restrict our business and investment options and could harm our business and expose us to penalties or other claims.
For example, under the Dodd-Frank Act, the CFPB also has regulatory authority over certain aspects of our business as a result of our residential mortgage banking activities, including, without limitation, authority to bring an enforcement action against us for failure to comply with regulations promulgated by the Bureau that are applicable to our business. One of the Bureau’s areas of focus has been on whether companies like us take appropriate steps to ensure that business arrangements with service providers do not present risks to consumers. The sub-servicer we retain to directly service residential mortgage loans (when we own the associated MSRs) is one of our most significant service providers with respect to our residential mortgage banking activities and our failure to take steps to ensure that this sub-servicer is servicing these residential mortgage loans in accordance with applicable law and regulation could result in enforcement action by the Bureau against us that could restrict our business, expose us to penalties or other claims, negatively impact our financial results, and damage our reputation.
In addition, we are a seller/servicer approved to sell residential mortgage loans to Freddie Mac and Fannie Mae. As an approved seller/servicer, we are required to conduct certain aspects of our operations in accordance with applicable policies and guidelines published by Freddie Mac and Fannie Mae and we are required to pledge a certain amount of cash to Freddie Mac and Fannie Mae to collateralize potential obligations to Freddie Mac and Fannie Mae. Failure to maintain our status as an approved seller/servicer would mean we would not be able to sell mortgage loans to these entities, could result in our being required to repurchase loans previously sold to these entities, or could otherwise restrict our business and investment options and could harm our business and expose us to losses or other claims. Fannie Mae or Freddie Mac may, in the future, require us to hold additional capital or pledge additional cash or assets in order to obtain or maintain approved seller/servicer status, which, if required, could adversely impact our financial results.
With respect to mortgage loans we own, or which we have purchased and subsequently sold, we may be subject to liability for potential violations of truth-in-lending or other similar consumer protection laws and regulations, which could adversely impact our business and financial results.
Federal consumer protection laws and regulations have been enacted and promulgated that are designed to regulate residential mortgage loan underwriting and originators’ lending processes, standards, and disclosures to borrowers. These laws and regulations include the CFPB’s “ability-to-repay” and “qualified mortgage” regulations. In addition, there are various other federal, state, and local laws and regulations that are intended to discourage predatory lending practices by residential mortgage loan originators. For example, the federal Home Ownership and Equity Protection Act of 1994 (HOEPA) prohibits inclusion of certain provisions in residential mortgage loans that have mortgage rates or origination costs in excess of prescribed levels and requires that borrowers be given certain disclosures prior to origination. Some states have enacted, or may enact, similar laws or regulations, which in some cases may impose restrictions and requirements greater than those in place under federal laws and regulations. In addition, under the anti-predatory lending laws of some states, the origination of certain residential mortgage loans, including loans that are classified as “high cost” loans under applicable law, must satisfy a net tangible benefits test with respect to the borrower. This test, as well as certain standards set forth in the “ability-to-repay” and “qualified mortgage” regulations, may be highly subjective and open to interpretation. As a result, a court may determine that a residential mortgage loan did not meet the standard or test even if the originator reasonably believed such standard or test had been satisfied. Failure of residential mortgage loan originators or servicers to comply with these laws and regulations could subject us, as an assignee or purchaser of these loans (or as an investor in securities backed by these loans), to monetary penalties and defenses to foreclosure, including by recoupment or setoff of finance charges and fees collected, and could result in rescission of the affected residential mortgage loans, which could adversely impact our business and financial results.
Environmental protection laws that apply to properties that secure or underlie our loan and investment portfolio could result in losses to us. We may also be exposed to environmental liabilities with respect to properties we become direct or indirect owners of or to which we take title, which could adversely affect our business and financial results.
Under the laws of several states, contamination of a property may give rise to a lien on the property to secure recovery of the cleanup costs. In certain of these states, such a lien has priority over the lien of an existing mortgage against the property, which could
24
impair the value of an investment in a security we own backed by such a property or could reduce the value of such a property that underlies loans we have made or own. In addition, under the laws of some states and under the federal Comprehensive Environmental Response, Compensation and Liability Act of 1980, we may be liable for costs of addressing releases or threatened releases of hazardous substances that require remedy at a property securing or underlying a loan we hold if our agents or employees have become sufficiently involved in the hazardous waste aspects of the operations of the borrower of that loan, regardless of whether or not the environmental damage or threat was caused by us or the borrower.
In the course of our business, we may take title to residential or commercial real estate or may otherwise become direct or indirect owners of real estate. If we do take title or become a direct or indirect owner, we could be subject to environmental liabilities with respect to the property, including liability to a governmental entity or third parties for property damage, personal injury, investigation, and clean-up costs. In addition, we may be required to investigate or clean up hazardous or toxic substances or chemical releases at a property. The costs associated with investigation or remediation activities could be substantial. If we ever become subject to significant environmental liabilities, our business and financial results could be materially and adversely affected.
Our technology infrastructure and systems are important and any significant disruption or breach of the security of this infrastructure or these systems could have an adverse effect on our business. We also rely on technology infrastructure and systems of third parties who provide services to us and with whom we transact business.
In order to analyze, acquire, and manage our investments, manage the operations and risks associated with our business, assets, and liabilities, and prepare our financial statements we rely upon computer hardware and software systems. Some of these systems are located at our offices and some are maintained by third party vendors or located at facilities maintained by third parties. We also rely on technology infrastructure and systems of third parties who provide services to us and with whom we transact business. Any significant interruption in the availability or functionality of these systems could impair our access to liquidity, damage our reputation, and have an adverse effect on our operations and on our ability to timely and accurately report our financial results.
In addition, any breach of the security of these systems could have an adverse effect on our operations and the preparation of our financial statements. Steps we have taken to provide for the security of our systems and data may not effectively prevent others from obtaining improper access to our systems data. Improper access could expose us to risks of data loss, reputational damage, increased regulatory scrutiny, litigation, and liabilities to third parties, and otherwise disrupt our operations. For example, our systems and the systems of third parties who provide services to us and with whom we transact business may contain non-public personal information that an identity thief could utilize in engaging in fraudulent activity or theft. We may be liable for losses suffered by individuals whose identities are stolen as a result of a breach of the security of these systems, and any such liability could be material.
Our business could be adversely affected by deficiencies in our disclosure controls and procedures or internal controls over financial reporting.
The design and effectiveness of our disclosure controls and procedures and internal controls over financial reporting may not prevent all errors, misstatements, or misrepresentations. While management continues to review the effectiveness of our disclosure controls and procedures and internal controls over financial reporting, there can be no assurance that our disclosure controls and procedures or internal controls over financial reporting will be effective in accomplishing all control objectives all of the time. Deficiencies, particularly material weaknesses or significant deficiencies, in internal controls over financial reporting which have occurred or which may occur in the future could result in misstatements of our financial results, restatements of our financial statements, a decline in our stock price, or an otherwise material and adverse effect on our business, reputation, financial results, or liquidity and could cause investors and creditors to lose confidence in our reported financial results.
Our risk management efforts may not be effective.
We could incur substantial losses and our business operations could be disrupted if we are unable to effectively identify, manage, monitor, and mitigate financial risks, such as credit risk, interest rate risk, prepayment risk, liquidity risk, and other market-related risks, as well as operational risks related to our business, assets, and liabilities. Our risk management policies, procedures, and techniques may not be sufficient to identify all of the risks we are exposed to, mitigate the risks we have identified, or to identify additional risks to which we may become subject in the future. Expansion of our business activities may also result in our being exposed to risks that we have not previously been exposed to or may increase our exposure to certain types of risks and we may not effectively identify, manage, monitor, and mitigate these risks as our business activity changes or increases.
Some of our risk management efforts are carried out by entering into interest rate agreements and other derivatives intended to hedge against certain interest rate and other financial risks. These derivatives are generally entered into under agreements in which we
25
make various representations and warranties and covenants and which contain various events of default or termination events. If we breach these agreements or if they otherwise terminate, we may suffer losses and we may, thereafter, not be hedged against certain financial risks that we had intended to hedge against. In addition, if we breach these agreements or they otherwise terminate, the circumstances that resulted in the breach or termination, or other circumstances, may prevent us from using other similar agreements that are already in place or from entering into replacement agreements to hedge against financial risk.
We could be harmed by misconduct or fraud that is difficult to detect.
We are exposed to risks relating to misconduct by our employees, contractors we use, or other third parties with whom we have relationships. For example, our employees could execute unauthorized transactions, use our assets improperly or without authorization, perform improper activities, use confidential information for improper purposes, or mis-record or otherwise try to hide improper activities from us. This type of misconduct could also relate to assets we manage for others through our investment advisory subsidiary. This type of misconduct can be difficult to detect and if not prevented or detected could result in claims or enforcement actions against us or losses. Accordingly, misconduct by employees, contractors, or others could subject us to losses or regulatory sanctions and seriously harm our reputation. Our controls may not be effective in detecting this type of activity.
Inadvertent errors, including, for example, errors in the implementation of information technology systems, could subject us to financial loss, litigation, or regulatory action.
Our employees, contractors we use, or other third parties with whom we have relationships may make inadvertent errors that could subject us to financial losses, claims, or enforcement actions. These types of errors could include, but are not limited to, mistakes in executing, recording, or reporting transactions we enter into for ourselves or with respect to assets we manage for others. Errors in the implementation of information technology systems or other operational systems and procedures could also interrupt our business or subject us to financial losses, claims, or enforcement actions. Inadvertent errors expose us to the risk of material losses until the errors are detected and remedied prior to the incurrence of any loss. The risk of errors may be greater for business activities that are new for us or have non-standardized terms, for areas of our business that we are expanding, or for areas of our business that rely on new employees or on third parties that we have only recently established relationships with.
Our business may be adversely affected if our reputation is harmed.
Our business is subject to significant reputational risks. If we fail, or appear to fail, to address various issues that may affect our reputation, our business could be harmed. Issues could include real or perceived legal or regulatory violations or be the result of a failure in governance, risk-management, technology, or operations. Similarly, market rumors and actual or perceived association with counterparties whose own reputation is under question could harm our business. Lawsuits brought against us (or the resolution of lawsuits brought against us), claims of employee misconduct, claims of wrongful termination, adverse publicity, conflicts of interest, ethical issues, or failure to maintain the security of our information technology systems or to protect private information could also cause significant reputational damages. Such reputational damage could result not only in an immediate financial loss, but could also result in a loss of business relationships, the ability to raise capital, and the ability to access liquidity through borrowing facilities.
Our financial results are determined and reported in accordance with generally accepted accounting principles (and related conventions and interpretations), or GAAP, and are based on estimates and assumptions made in accordance with those principles, conventions, and interpretations. Furthermore, the amount of dividends we are required to distribute as a REIT is driven by the determination of our income in accordance with the Internal Revenue Code rather than generally accepted accounting principles.
Our reported GAAP financial results differ from the taxable income results that drive our dividend distribution requirements and, therefore, our GAAP results may not be an accurate indicator of taxable income and dividend distributions.
Generally, the cumulative income we report relating to an investment asset will be the same for GAAP and tax purposes, although the timing of this recognition over the life of the asset could be materially different. There are, however, certain permanent differences in the recognition of certain expenses under the respective accounting principles applied for GAAP and tax purposes and these differences could be material. Thus, the amount of GAAP earnings reported in any given period may not be indicative of future dividend distributions. A further explanation of differences between our GAAP and taxable income is presented in “Management’s Discussion and Analysis of Financial Condition and Results of Operations,” which is set forth in Part II, Item 7 of this Annual Report on Form 10-K.
Our minimum dividend distribution requirements are determined under the REIT tax laws and are based on our taxable income as calculated for tax purposes pursuant to the Internal Revenue Code. Our Board of Directors may also decide to distribute more than is
26
required based on these determinations. One should not expect that our retained GAAP earnings will equal cumulative distributions, as the Board of Directors’ dividend distribution decisions, permanent differences in GAAP and tax accounting, and even temporary differences may result in material differences in these balances.
Over time, accounting principles, conventions, rules, and interpretations may change, which could affect our reported GAAP and taxable earnings and stockholders’ equity.
Accounting rules for the various aspects of our business change from time to time. Changes in GAAP, or the accepted interpretation of these accounting principles, can affect our reported income, earnings, and stockholders’ equity. In addition, changes in tax accounting rules or the interpretations thereof could affect our taxable income and our dividend distribution requirements. Predicting and planning for these changes can be difficult.
Redwood has elected to be a REIT and, as such, is required to meet certain tests in order to maintain its REIT status. This adds complexity and costs to running our business and exposes us to additional risks.
Failure to qualify as a REIT could adversely affect our net income and dividend distributions and could adversely affect the value of our common stock.
We have elected to qualify as a REIT for federal income tax purposes for all tax years since 1994. However, many of the requirements for qualification as a REIT are highly technical and complex and require an analysis of particular facts and an application of the legal requirements to those facts in situations where there is only limited judicial and administrative guidance. Thus, we cannot assure you that the Internal Revenue Service or a court would agree with our conclusion that we have qualified as a REIT historically, or that changes to our business or the law will not cause us to fail to qualify as a REIT in the future. Furthermore, in an environment where assets may quickly change in value, previous planning for compliance with REIT qualification rules may be disrupted. If we failed to qualify as a REIT for federal income tax purposes and did not meet the requirements for statutory relief, we would be subject to federal income tax at regular corporate rates on all of our income and we could possibly be disqualified as a REIT for four years thereafter. If we were to become subject to federal income tax, we might not have, at that time, the liquid assets to pay the taxes due, which could result in our liquidating assets at unattractive prices. Failure to qualify as a REIT could adversely affect our dividend distributions and could adversely affect the value of our common stock.
Maintaining REIT status and avoiding the generation of excess exclusion income at Redwood Trust, Inc. and certain of our subsidiaries may reduce our flexibility and could limit our ability to pursue certain opportunities. Failure to appropriately structure our business and transactions to comply with laws and regulations applicable to REITs could have adverse consequences.
To maintain REIT status, we must follow certain rules and meet certain tests. In doing so, our flexibility to manage our operations may be reduced. For instance:
| — | Compliance with the REIT income and asset rules may limit the type or extent of financing or hedging that we can undertake. |
| — | Our ability to own non-real estate related assets and earn non-real estate related income is limited and the rules for classifying assets and income are complicated. For instance, compensation for performing mortgage origination and servicing activities does not constitute real estate income but income from an investment in, or financing of, excess MSRs may constitute real estate income under the rules applicable to REITs. Our ability to own equity interests in other entities is also limited. If we fail to comply with these limits, we may be forced to liquidate attractive investments on short notice on unfavorable terms in order to maintain our REIT status. |
| — | We generally use taxable subsidiaries to own non-real estate related assets and engage in activities that may give rise to non-real estate related income under the REIT rules. However, our ability to invest in taxable subsidiaries is limited under the REIT rules. Maintaining compliance with this limit could require us to constrain the growth of our TRS in the future. |
| — | Meeting minimum REIT dividend distribution requirements could reduce our liquidity. We may earn non-cash REIT taxable income due to timing and/or character mismatches between the computation of our income for tax and our book purposes. Earning non-cash REIT taxable income could necessitate our selling assets, incurring debt, or raising new equity in order to fund dividend distributions. |
| — | We could be viewed as a “dealer” with respect to certain transactions and become subject to a 100% prohibited transaction tax or other entity-level taxes on income from such transactions. |
27
Furthermore, the rules we must follow and the tests we must satisfy to maintain our REIT status may change, or the interpretation of these rules and tests by the Internal Revenue Service may change.
In addition, our stated goal has been to not generate excess inclusion income at Redwood Trust, Inc. and certain of its subsidiaries that would be taxable as unrelated business taxable income (“UBTI”) to our tax-exempt shareholders. Achieving this goal has limited, and may continue to limit, our flexibility in pursuing certain transactions or has resulted in, and may continue to result in, our having to pursue certain transactions through a taxable subsidiary, which reduces the net returns on these transactions by the associated tax liabilities. Despite our efforts to do so, we may not be able to avoid creating or distributing UBTI to our shareholders.
Changes in tax rules could adversely affect REITs and could adversely affect the value of our common stock.
The requirements for maintaining REIT status, the taxation of REITs and the taxation of mortgage related financial products could change in the future based on regulatory changes or tax legislation. Over the last year, Congressional subcommittees have been considering comprehensive tax reform proposals that would, among other things, overhaul the tax rules applicable to pass-through entities and financial products in connection with reducing rates of corporate taxation. The likelihood that comprehensive tax reform or other changes to tax laws or regulations will occur cannot be predicted. Any such future changes in the regulations or tax laws applicable to REITs or to mortgage related financial products could negatively impact our operations or reduce any competitive advantages we may have relative to non-REIT entities, either of which could reduce the value of our common stock.
The application of the tax code to our business is complicated and we may not interpret and apply some of the rules and regulations correctly. In addition, we may not make all available elections, which could result in our not being able to fully benefit from available deductions or benefits. Furthermore, the elections, interpretations and applications we do make could be deemed by the Internal Revenue Service (“IRS”) to be incorrect, and such rulings could have adverse impacts on our GAAP earnings and potentially on our REIT status.
The U.S. tax code may change and/or the interpretation of the rules and regulations by the IRS may change. In circumstances where the application of these rules and regulations affecting our business is not clear, we may have to interpret them and their application to us. We seek the advice of outside tax advisors in arriving at these interpretations, but our interpretations may prove to be wrong, which could have adverse consequences.
Our tax payments and dividend distributions, when based on required dividend distributions, are based in large part on our estimate of taxable income which includes the application and interpretation of a variety of tax rules and regulations. While there are some relief provisions should we incorrectly interpret certain rules and regulations, we may not be able to fully take advantage of these provisions and this could have an adverse effect on our REIT status. In addition, our GAAP earnings include tax provisions and benefits based on our estimates of taxable income and should our estimates prove to be wrong, we would have to make an adjustment to our taxable provisions and this adjustment could be material.
Our decisions about raising, managing, and distributing our capital may adversely affect our business and financial results. Furthermore, our growth may be limited if we are not able to raise additional capital.
We are required to distribute at least 90% of our REIT taxable income as dividends to shareholders. Thus, we do not generally have the ability to retain all of the earnings generated by our REIT and, to a large extent, we rely on our ability to raise capital to grow. We may raise capital through the issuance of new shares of our common stock, either through our direct stock purchase and dividend reinvestment plan or through public or private offerings. We may also raise capital by issuing other types of securities, such as preferred stock, convertible debt, or other types of debt securities. As of January 1, 2014, we had approximately 97 million unissued shares of stock authorized for issuance under our charter (although approximately 21 million of these shares are reserved for issuance under our equity compensation plans, dividend reinvestment and stock purchase plan, and outstanding convertible notes). The number of our unissued shares of stock authorized for issuance establishes a limit on the amount of capital we can raise through issuances of shares of stock unless we seek and receive approval from our shareholders to increase the authorized number of our shares in our charter. Also, certain stock change of ownership tests may limit our ability to raise significant amounts of equity capital or could limit our future use of tax losses to offset income tax obligations if we raise significant amounts of equity capital.
In addition, we may not be able to raise capital at times when we need capital or see opportunities to invest capital. Many of the same factors that could make the pricing for investments in real estate loans and securities attractive, such as the availability of assets from distressed owners who need to liquidate them at reduced prices, and uncertainty about credit risk, housing, and the economy, may limit investors’ and lenders’ willingness to provide us with additional capital. There may be other reasons we are not able to raise capital and, as a result, may not be able to finance growth in our business and in our portfolio of assets. If we are unable to raise
28
capital and expand our business and our portfolio of investments, our growth may be limited, we may have to forgo attractive business and investment opportunities, and our operating expenses may increase significantly relative to our capital base.
To the extent we have capital that is available for investment, we have broad discretion over how to invest that capital and our shareholders and other investors will be relying on the judgment of our management regarding its use. To the extent we invest capital in our business or in portfolio assets, we may not be successful in achieving favorable returns.
Conducting our business in a manner so that we are exempt from registration under, and in compliance with, the Investment Company Act may reduce our flexibility and could limit our ability to pursue certain opportunities. At the same time, failure to continue to qualify for exemption from the Investment Company Act could adversely affect us.
Under the Investment Company Act, an investment company is required to register with the SEC and is subject to extensive restrictive and potentially adverse regulations relating to, among other things, operating methods, management, capital structure, dividends, and transactions with affiliates. However, for example, companies primarily engaged in the business of acquiring mortgages and other liens on and interests in real estate are generally exempt from the requirements of the Investment Company Act. We believe that we have conducted our business so that we are not subject to the registration requirements of the Investment Company Act. In order to continue to do so, however, Redwood and each of our subsidiaries must either operate so as to fall outside the definition of an investment company under the Investment Company Act or satisfy its own exclusion under the under the Investment Company Act. For example, certain of our entities limit their ownership or holdings of investment securities to less than 40% of their total assets. Other entities, among other things, must maintain at least 55% of their assets in certain qualifying real estate assets (the 55% Requirement) and are also required to maintain an additional 25% of their assets in such qualifying real estate assets or certain other types of real estate-related assets (the 25% Requirement). Rapid changes in the values of assets we own, however, can disrupt prior efforts to conduct our business to meet these requirements.
If Redwood or one of our subsidiaries fell within the definition of an investment company under the Investment Company Act and failed to qualify for an exclusion or exemption, including, for example, if it failed to meet the 55% Requirement or the 25% Requirement, we could, among other things, be required either (i) to change the manner in which we conduct our operations to avoid being required to register as an investment company or (ii) to register as an investment company, either of which could adversely affect us by, among other things, requiring us to dispose of certain assets or to change the structure of our business in ways that we may not believe to be in our best interests. Legislative or regulatory changes relating to the Investment Company Act or which affect our efforts to qualify for exclusions or exemptions, including our ability to comply with the 55% Requirement and the 25% Requirement, could also result in these adverse effects on us.
If we were deemed an unregistered investment company, we could be subject to monetary penalties and injunctive relief and we could be unable to enforce contracts with third parties and third parties could seek to obtain rescission of transactions undertaken during the period we were deemed an unregistered investment company, unless the court found that under the circumstances, enforcement (or denial of rescission) would produce a more equitable result than no enforcement (or grant of rescission) and would not be inconsistent with the Investment Company Act.
An SEC review, initiated in 2011, of one section of the Investment Company Act and the regulations and regulatory interpretations promulgated thereunder that we rely on to exempt us from registration and regulation as an investment company under the Investment Company Act could eventually result in legislative or regulatory changes, which could require us to change our business and operations in order for us to continue to rely on that exemption or operate without the benefit of that exemption.
In August 2011, the SEC published a Concept Release within which it reviewed interpretive issues under the Investment Company Act relating to the status under the Investment Company Act of companies that are engaged in the business of acquiring mortgages and mortgage-related instruments and that rely on the exemption set forth in Section 3(c)(5)(C) of the Investment Company Act from requirements under the Investment Company Act. Among other things, the SEC is “concerned that certain types of mortgage-related pools today appear to resemble in many respects investment companies such as closed-end funds and may not be the kinds of companies that were intended to be excluded from regulation under the Investment Company Act by Section 3(c)(5)(C).” To the extent we rely on Section 3(c)(5)(C) of the Investment Company Act to exempt us from regulation under the Investment Company Act, we believe that our reliance is proper. However, this SEC review could eventually lead to legislative or regulatory changes that could affect our ability to rely on that exemption or could eventually require us to change our business and operations in order for us to continue to rely on that exemption. Even if the SEC’s review of this exemption does not eventually have these effects on us, in the interim, while the SEC is carrying out its review, any uncertainty created by the SEC’s review process could negatively impact the ability of companies, such as us, that rely on this exemption to raise capital, borrow money, or engage in certain other types of business transactions, which could negatively impact our business and financial results.
29
Provisions in our charter and bylaws and provisions of Maryland law may limit a change in control or deter a takeover that might otherwise result in a premium price being paid to our shareholders for their shares in Redwood.
In order to maintain our status as a REIT, not more than 50% in value of our outstanding capital stock may be owned, actually or constructively, by five or fewer individuals (defined in the Internal Revenue Code to include certain entities). In order to protect us against the risk of losing our status as a REIT due to concentration of ownership among our shareholders and for other reasons, our charter generally prohibits any single shareholder, or any group of affiliated shareholders, from beneficially owning more than 9.8% of the outstanding shares of any class of our stock, unless our Board of Directors waives or modifies this ownership limit. This limitation may have the effect of precluding an acquisition of control of us by a third party without the consent of our Board of Directors. Our Board of Directors has granted a limited number of waivers to institutional investors to own shares in excess of this 9.8% limit, which waivers are subject to certain terms and conditions. Our Board of Directors may amend these existing waivers to permit additional share ownership or may grant waivers to additional shareholders at any time.
Certain other provisions contained in our charter and bylaws and in the Maryland General Corporation Law (“MGCL”) may have the effect of discouraging a third party from making an acquisition proposal for us and may therefore inhibit a change in control. For example, our charter includes provisions granting our Board of Directors the authority to issue preferred stock from time to time and to establish the terms, preferences, and rights of the preferred stock without the approval of our shareholders. Provisions in our charter and the MGCL also restrict our shareholders’ ability to remove directors and fill vacancies on our Board of Directors and restrict unsolicited share acquisitions. These provisions and others may deter offers to acquire our stock or large blocks of our stock upon terms attractive to our shareholders, thereby limiting the opportunity for shareholders to receive a premium for their shares over then-prevailing market prices.
The ability to take action against our directors and officers is limited by our charter and bylaws and provisions of Maryland law and we may (or, in some cases, are obligated to) indemnify our current and former directors and officers against certain losses relating to their service to us.
Our charter limits the liability of our directors and officers to us and to shareholders for pecuniary damages to the fullest extent permitted by Maryland law. In addition, our charter authorizes our Board of Directors to indemnify our officers and directors (and those of our subsidiaries or affiliates) for losses relating to their service to us to the full extent required or permitted by Maryland law. Our bylaws require us to indemnify our officers and directors (and those of our subsidiaries and affiliates) to the maximum extent permitted by Maryland law in the defense of any proceeding to which he or she is made, or threatened to be made, a party because of his or her service to us. In addition, we have entered into, and may in the future enter into, indemnification agreements with our directors and certain of our officers and the directors and certain of the officers of certain of our subsidiaries and affiliates which obligate us to indemnify them against certain losses relating to their service to us and the related costs of defense.
Investing in our common stock may involve a high degree of risk. Investors in our common stock may experience losses, volatility, and poor liquidity, and we may reduce our dividends in a variety of circumstances.
An investment in our common stock may involve a high degree of risk, particularly when compared to other types of investments. Risks related to the economy, the financial markets, our industry, our investing activity, our other business activities, our financial results, the amount of dividends we distribute, the manner in which we conduct our business, and the way we have structured and limited our operations could result in a reduction in, or the elimination of, the value of our common stock. The level of risk associated with an investment in our common stock may not be suitable for the risk tolerance of many investors. Investors may experience volatile returns and material losses. In addition, the trading volume of our common stock (i.e., its liquidity) may be insufficient to allow investors to sell their common stock when they want to or at a price they consider reasonable.
Our earnings, cash flows, book value, and dividends can be volatile and difficult to predict. Investors in our common stock should not rely on our estimates, projections, or predictions, or on management’s beliefs about future events. In particular, the sustainability of our earnings and our cash flows will depend on numerous factors, including our level of business and investment activity, our access to debt and equity financing, the returns we earn, the amount and timing of credit losses, prepayments, the expense of running our business, and other factors, including the risk factors described herein. As a consequence, although we seek to pay a regular common stock dividend that is sustainable, we may reduce our regular dividend rate, or stop paying dividends, in the future for a variety of reasons. We may not provide public warnings of dividend reductions prior to their occurrence. Although we have paid special dividends in the past, we have not paid a special dividend since 2007 and we may not do so in the future. Changes to the amount of dividends we distribute may result in a reduction in the value of our common stock.
30
A limited number of institutional shareholders own a significant percentage of our common stock, which could have adverse consequences to other holders of our common stock.
As of December 31, 2013, based on filings of Schedules 13D and 13G with the SEC, we believe that six institutional shareholders each owned approximately 5% or more of our outstanding common stock and we believe based on data obtained from other public sources that, overall, 225 institutional shareholders owned, in the aggregate, approximately 96% of our outstanding common stock. Furthermore, one or more of these investors or other investors could significantly increase their ownership of our common stock, including through the conversion of outstanding convertible notes into shares of common stock. Significant ownership stakes held by these individual institutions or other investors could have adverse consequences for other shareholders because each of these shareholders will have a significant influence over the outcome of matters submitted to a vote of our shareholders, including the election of our directors and transactions involving a change in control. In addition, should any of these significant shareholders determine to liquidate all or a significant portion of their holdings of our common stock, it could have an adverse effect on the market price of our common stock.
Although, under our charter, shareholders are generally precluded from beneficially owning more than 9.8% of our outstanding common stock, our Board of Directors may amend existing ownership-limitation waivers or grant waivers to other shareholders in the future, in each case in a manner which may allow for increases in the concentration of the ownership of our common stock held by one or more shareholders.
Future sales of our common stock by us or by our officers and directors may have adverse consequences for investors.
We may issue additional shares of common stock, or securities convertible into shares of common stock, in public offerings or private placements, and holders of our outstanding convertible notes may convert those securities into shares of common stock. In addition, we may issue additional shares of common stock to participants in our direct stock purchase and dividend reinvestment plan and to our directors, officers, and employees under our employee stock purchase plan, our incentive plan, or other similar plans, including upon the exercise of, or in respect of, distributions on equity awards previously granted thereunder. We are not required to offer any such shares to existing shareholders on a preemptive basis. Therefore, it may not be possible for existing shareholders to participate in future share issuances, which may dilute existing shareholders’ interests in us. In addition, if market participants buy shares of common stock, or securities convertible into shares of common stock, in issuances by us in the future, it may reduce or eliminate any purchases of our common stock they might otherwise make in the open market, which in turn could have the effect of reducing the volume of shares of our common stock traded in the marketplace, which could have the effect of reducing the market price and liquidity of our common stock.
At February 24, 2014, our directors and executive officers beneficially owned, in the aggregate, approximately 2.6% of our common stock. Sales of shares of our common stock by these individuals are generally required to be publicly reported and are tracked by many market participants as a factor in making their own investment decisions. As a result, future sales by these individuals could negatively affect the market price of our common stock.
There is a risk that you may not receive dividend distributions or that dividend distributions may decrease over time. Changes in the amount of dividend distributions we pay, in the tax characterization of dividend distributions we pay, or in the rate at which holders of our common stock are taxed on dividend distributions we pay, may adversely affect the market price of our common stock or may result in holders of our common stock being taxed on dividend distributions at a higher rate than initially expected.
Our dividend distributions are driven by a variety of factors, including our minimum dividend distribution requirements under the REIT tax laws and our REIT taxable income as calculated for tax purposes pursuant to the Internal Revenue Code. We generally intend to distribute to our shareholders at least 90% of our REIT taxable income, although our reported financial results for GAAP purposes may differ materially from our REIT taxable income.
For 2013, we maintained our regular dividend at a rate of $0.28 per share per quarter and in November 2013 our Board of Directors announced its intention to continue to pay regular dividends during 2014 at a rate of $0.28 per share per quarter. Our ability to pay a dividend of $0.28 per share per quarter in 2014 may be adversely affected by a number of factors, including the risk factors described herein. These same factors may affect our ability to pay other future dividends. In addition, to the extent we determine that future dividends would represent a return of capital to investors, rather than the distribution of income, we may determine to discontinue dividend payments until such time that dividends would again represent a distribution of income. Any reduction or elimination of our payment of dividend distributions would not only reduce the amount of dividends you would receive as a holder of our common stock, but could also have the effect of reducing the market price of our common stock.
31
The rate at which holders of our common stock are taxed on dividends we pay and the characterization of our dividends – as ordinary income, capital gains, or a return of capital – could have an impact on the market price of our common stock. In addition, after we announce the expected characterization of dividend distributions we have paid, the actual characterization (and, therefore, the rate at which holders of our common stock are taxed on the dividend distributions they have received) could vary from our expectation, including due to errors, changes made in the course of preparing our corporate tax returns, or changes made in response to an IRS audit), with the result that holders of our common stock could incur greater income tax liabilities than expected.
The market price of our common stock could be negatively affected by various factors, including broad market fluctuations.
The market price of our common stock may be negatively affected by various factors, which change from time to time. Some of these factors are:
| — | Our actual or anticipated financial condition, performance, and prospects and those of our competitors. |
| — | The market for similar securities issued by other REITs and other competitors of ours. |
| — | Changes in the manner that investors and securities analysts who provide research to the marketplace on us analyze the value of our common stock (for example, if, at a time when the market price of our common stock is significantly above book value per share, investors and analysts change their method of analyzing the value of our common stock and take the position that our common stock should not be valued at a significant premium to book value per share, which could occur if investors and analysts do not believe there is reason to have a positive outlook on the prospects for our business and financial results). |
| — | Changes in recommendations or in estimated financial results published by securities analysts who provide research to the marketplace on us, our competitors, or our industry. |
| — | General economic and financial market conditions, including, among other things, actual and projected interest rates, prepayments, and credit performance and the markets for the types of assets we hold or invest in. |
| — | Proposals to significantly change the manner in which financial markets, financial institutions, and related industries, or financial products are regulated under applicable law, or the enactment of such proposals into law or regulation. |
| — | Other events or circumstances which undermine confidence in the financial markets or otherwise have a broad impact on financial markets, such as the sudden instability or collapse of large financial institutions or other significant corporations (whether due to fraud or other factors), terrorist attacks, natural or man-made disasters, or threatened or actual armed conflicts. |
Furthermore, these fluctuations do not always relate directly to the financial performance of the companies whose stock prices may be affected. As a result of these and other factors, investors who own our common stock could experience a decrease in the value of their investment, including decreases unrelated to our financial results or prospects.
ITEM 1B. UNRESOLVED STAFF COMMENTS
None.
Redwood Trust has one lease for its principal executive and administrative offices located at One Belvedere Place, Mill Valley, California 94941, which expires in 2018. The 2014 rent obligation for this lease in Mill Valley is $1.5 million. Redwood has one lease for offices at 8310 South Valley Highway, Englewood, CO 80112, which expires in 2021. The 2014 rent obligation for this lease in Colorado is $0.4 million. Redwood has one lease for administrative offices at 1114 Avenue of the Americas – 34th Floor, New York, NY 10036, which expires in 2015. The 2014 rent obligation for this lease in New York is $0.3 million. Redwood has one lease for administrative offices at 4000 MacArthur Blvd, Suite 600, Newport Beach, California 92660. This is a six-month lease that automatically renews at the end of each period. The 2014 rent obligation for this lease in Newport Beach is $21 thousand.
On or about December 23, 2009, the Federal Home Loan Bank of Seattle (the “FHLB-Seattle”) filed a complaint in the Superior Court for the State of Washington (case number 09-2-46348-4 SEA) against Redwood Trust, Inc., our subsidiary, Sequoia Residential
32
Funding, Inc. (“SRF”), Morgan Stanley & Co., and Morgan Stanley Capital I, Inc. (collectively, the “FHLB-Seattle Defendants”) alleging that the FHLB-Seattle Defendants made false or misleading statements in offering materials for a mortgage pass-through certificate (the “Seattle Certificate”) issued in the Sequoia Mortgage Trust 2005-4 securitization transaction (the “2005-4 RMBS”) and purchased by the FHLB-Seattle. Specifically, the complaint alleges that the alleged misstatements concern the (1) loan-to-value ratio of mortgage loans and the appraisals of the properties that secured loans supporting the 2005-4 RMBS, (2) occupancy status of the properties, (3) standards used to underwrite the loans, and (4) ratings assigned to the Seattle Certificate. The FHLB-Seattle alleges claims under the Securities Act of Washington (Section 21.20.005, et seq.) and seeks to rescind the purchase of the Seattle Certificate and to collect interest on the original purchase price at the statutory interest rate of 8% per annum from the date of original purchase (net of interest received) as well as attorneys’ fees and costs. The Seattle Certificate was issued with an original principal amount of approximately $133 million, and, as of December 31, 2013, the FHLB-Seattle has received approximately $114.4 million of principal and $11.0 million of interest payments in respect of the Seattle Certificate. As of December 31, 2013, the Seattle Certificate had a remaining outstanding principal amount of approximately $19.0 million. The claims were subsequently dismissed for lack of personal jurisdiction as to Redwood Trust and SRF. Redwood agreed to indemnify the underwriters of the 2005-4 RMBS for certain losses and expenses they might incur as a result of claims made against them relating to this RMBS, including, without limitation, certain legal expenses. The FHLB-Seattle’s claims against the underwriters of this RMBS were not dismissed and remain pending. Regardless of the outcome of this litigation, Redwood could incur a loss as a result of these indemnities.
On or about July 15, 2010, The Charles Schwab Corporation (“Schwab”) filed a complaint in the Superior Court for the State of California in San Francisco (case number CGC-10-501610) against SRF and 26 other defendants (collectively, the “Schwab Defendants”) alleging that the Schwab Defendants made false or misleading statements in offering materials for various residential mortgage-backed securities sold or issued by the Schwab Defendants. With respect to SRF, Schwab alleges that SRF made false or misleading statements in offering materials for a mortgage pass-through certificate (the “Schwab Certificate”) issued in the 2005-4 RMBS and purchased by Schwab. Specifically, the complaint alleges that the misstatements for the 2005-4 RMBS concern the (1) loan-to-value ratio of mortgage loans and the appraisals of the properties that secured loans supporting the 2005-4 RMBS, (2) occupancy status of the properties, (3) standards used to underwrite the loans, and (4) ratings assigned to the Schwab Certificate. Schwab alleges a claim for negligent misrepresentation under California state law and seeks unspecified damages and attorneys’ fees and costs. The Schwab Certificate was issued with an original principal amount of approximately $14.8 million, and, as of December 31, 2013, Schwab has received approximately $12.7 million of principal and $1.3 million of interest payments in respect of the Schwab Certificate. As of December 31, 2013, the Schwab Certificate had a remaining outstanding principal amount of approximately $2.1 million. SRF has denied Schwab’s allegations. We intend to defend the action vigorously. Redwood agreed to indemnify the underwriters of the 2005-4 RMBS, which underwriters are also named defendants in this action, for certain losses and expenses they might incur as a result of claims made against them relating to this RMBS, including, without limitation, certain legal expenses. Regardless of the outcome of this litigation, Redwood could incur a loss as a result of these indemnities.
On or about October 15, 2010, the Federal Home Loan Bank of Chicago (“FHLB-Chicago”) filed a complaint in the Circuit Court of Cook County, Illinois (case number 10-CH-45033) against SRF and more than 45 other named defendants (collectively, the “FHLB-Chicago Defendants”) alleging that the FHLB-Chicago Defendants made false or misleading statements in offering materials for various RMBS sold or issued by the FHLB-Chicago Defendants or entities controlled by them. FHLB-Chicago subsequently amended the complaint to name Redwood Trust, Inc. and another one of our subsidiaries, RWT Holdings, Inc., as defendants. With respect to Redwood Trust, Inc., RWT Holdings, Inc., and SRF, the FHLB-Chicago alleges that SRF, Redwood Trust, Inc., and RWT Holdings, Inc. made false or misleading statements in the offering materials for two mortgage pass-through certificates (the “Chicago Certificates”) issued in the Sequoia Mortgage Trust 2006-1 securitization transaction (the “2006-1 RMBS”) and purchased by the FHLB-Chicago. The complaint alleges that the alleged misstatements concern, among other things, the (1) loan-to-value ratio of mortgage loans and the appraisals of the properties that secured loans supporting the 2006-1 RMBS, (2) occupancy status of the properties, (3) standards used to underwrite the loans, (4) ratings assigned to the Chicago Certificates, and (5) due diligence performed on these mortgage loans. The FHLB-Chicago alleges claims under Illinois Securities Law (815 ILCS Sections 5/12(F)-(H)) and North Carolina Securities Law (N.C.G.S.A. §78A-8(2) & §78A-56(a)) as well as a claim for negligent misrepresentation under Illinois common law. On some of the causes of action, the FHLB-Chicago seeks to rescind the purchase of the Chicago Certificates and to collect interest on the original purchase prices at the statutory interest rate of 10% per annum from the dates of original purchase (net of interest received). On one cause of action, the FHLB-Chicago seeks unspecified damages. The FHLB-Chicago also seeks attorneys’ fees and costs. The first of the Chicago Certificates was issued with an original principal amount of approximately $105 million and, as of December 31, 2013, the FHLB Chicago has received approximately $72.3 million of principal and $24.2 million of interest payments in respect of this Chicago Certificate. As of December 31, 2013, this Chicago Certificate had a remaining outstanding principal amount of approximately $32.0 million (after taking into account approximately $1.0 million of principal losses allocated to this Chicago Certificate). The second of the Chicago Certificates was issued with an original principal amount of approximately $379 million and, as of December 31, 2013, the FHLB Chicago has received approximately $258.6 million of principal and $81.5 million of
33
interest payments in respect of this Chicago Certificate. As of December 31, 2013, this Chicago Certificate had a remaining outstanding principal amount of approximately $113.7 million (after taking into account approximately $6.3 million of principal losses allocated to this Chicago Certificate). SRF, Redwood Trust, Inc., and RWT Holdings, Inc. have denied FHLB-Chicago’s allegations. This case is in early stages of discovery, and no trial date has been set. We intend to defend the action vigorously. Redwood agreed to indemnify the underwriters of the 2006-1 RMBS, which underwriters are also named defendants in this action, for certain losses and expenses they might incur as a result of claims made against them relating to this RMBS, including, without limitation, certain legal expenses. Regardless of the outcome of this litigation, Redwood could incur a loss as a result of these indemnities.
In May 2010, we received an Order from the SEC, pursuant to Section 21(a)(1) of the Securities Exchange Act of 1934. The SEC’s Order required us to provide information regarding, among other things, our trading practices and valuation policies relating to our business of sponsoring and managing collateralized debt obligation issuers. We have responded to the Order. The Order from the SEC indicates that it should not be construed as an indication by the SEC or its staff that any violations of law have occurred. The SEC could, however, as a result of our response to this Order or otherwise, allege that we violated applicable law or regulation in the conduct of our collateralized debt obligation business.
In November 2009, we received a subpoena from the National Credit Union Administration (“NCUA”), which is the federal agency that charters and supervises federal credit unions, as part of its investigation of the circumstances relating to the U.S. Central Federal Credit Union being placed into conservatorship in March 2009, including the U.S. Central Federal Credit Union’s investment in various RMBS. The NCUA requested information relating to, among other things, two RMBS (i) issued by a securitization trust with respect to which SRF was the depositor and (ii) purchased at the time of issuance by the U.S. Central Federal Credit Union. We have responded to the subpoena. The subpoena from the NCUA states that it should not be construed as an indication by the NCUA or its staff that any violation of law has occurred. The NCUA could, however, as a result of our response to this subpoena or otherwise, allege that we did violate applicable law or regulation in the conduct of our securitization business.
Other than as disclosed in the preceding paragraphs of this Item 3 there are no material pending legal proceedings, or material changes with respect to pending legal proceedings, in each case, to which we or any of our subsidiaries is a party or of which our property is the subject.
ITEM 4. Mine Safety Disclosures
Not applicable.
34
PART II
ITEM 5. MARKET FOR REGISTRANT’S COMMON EQUITY, RELATED STOCKHOLDER MATTERS, AND ISSUER PURCHASES OF EQUITY SECURITIES
Our common stock is listed and traded on the NYSE under the symbol RWT. At February 24, 2014, our common stock was held by approximately 950 holders of record and the total number of beneficial stockholders holding stock through depository companies was approximately 29,000 at February 25, 2014. At February 24, 2014, there were 82,534,625 shares of common stock outstanding.
The high and low sales prices of shares of our common stock, as reported by the Bloomberg Financial Markets service, and the cash dividends declared on our common stock for each full quarterly period during 2013 and 2012 were as follows:
| Stock Prices | Common Dividends Declared | |||||||||||||||||||||||
| High | Low | Record Date |
Payable Date |
Per Share |
Dividend Type |
|||||||||||||||||||
| Year Ended December 31, 2013 |
|
|||||||||||||||||||||||
| Fourth Quarter |
$ | 19.77 | $ | 17.10 | 12/13/2013 | 12/27/2013 | $ | 0.28 | Regular | |||||||||||||||
| Third Quarter |
$ | 20.07 | $ | 16.32 | 9/13/2013 | 9/30/2013 | $ | 0.28 | Regular | |||||||||||||||
| Second Quarter |
$ | 23.32 | $ | 16.44 | 6/14/2013 | 6/28/2013 | $ | 0.28 | Regular | |||||||||||||||
| First Quarter |
$ | 23.59 | $ | 17.51 | 3/15/2013 | 3/29/2013 | $ | 0.28 | Regular | |||||||||||||||
| Year Ended December 31, 2012 |
|
|||||||||||||||||||||||
| Fourth Quarter |
$ | 17.00 | $ | 13.95 | 12/14/2012 | 12/27/2012 | $ | 0.25 | Regular | |||||||||||||||
| Third Quarter |
$ | 15.04 | $ | 12.38 | 9/14/2012 | 9/28/2012 | $ | 0.25 | Regular | |||||||||||||||
| Second Quarter |
$ | 12.61 | $ | 11.08 | 6/15/2012 | 6/29/2012 | $ | 0.25 | Regular | |||||||||||||||
| First Quarter |
$ | 12.23 | $ | 10.15 | 3/15/2012 | 3/30/2012 | $ | 0.25 | Regular | |||||||||||||||
All dividend distributions are made with the authorization of the board of directors at its discretion and will depend on such items as our GAAP net income, REIT taxable earnings, financial condition, maintenance of REIT status, and other factors that the board of directors may deem relevant from time to time. The holders of our common stock share proportionally on a per share basis in all declared dividends on common stock. As reported on our Current Report on Form 8-K on January 28, 2014, for dividend distributions made in 2013, we expect 89% of our dividends paid in 2013 to be characterized as ordinary income and 11% to be characterized as a return of capital for income tax purposes. None of the dividend distributions made in 2013 is expected to be characterized for federal income tax purposes as long-term capital gain dividends.
We announced a stock repurchase plan on November 5, 2007, for the repurchase of up to a total of 5,000,000 shares. This plan replaced all previous share repurchase plans and has no expiration date. We did not repurchase any shares under this plan during the year ended December 31, 2013. At December 31, 2013, 4,005,985 shares remained available for repurchase under our stock repurchase plan.
Information with respect to compensation plans under which equity securities of the registrant are authorized for issuance is set forth in Part II, Item 12 of this Annual Report on Form 10-K.
35
Performance Graph
The following graph presents a cumulative total return comparison of our common stock, over the last five years, to the S&P Composite-500 Stock Index and the National Association of Real Estate Investment Trusts, Inc. (“NAREIT”) Mortgage REIT index. The total returns reflect stock price appreciation and the reinvestment of dividends for our common stock and for each of the comparative indices, assuming that $100 was invested in each on December 31, 2008. The information has been obtained from sources believed to be reliable; but neither its accuracy nor its completeness is guaranteed. The total return performance shown on the graph is not necessarily indicative of future performance of our common stock.
| 2008 | 2009 | 2010 | 2011 | 2012 | 2013 | |||||||||||||||||||
| Redwood Trust, Inc |
100.00 | 103.47 | 114.20 | 84.13 | 150.51 | 182.77 | ||||||||||||||||||
| NAREIT Mortgage REIT Index |
100.00 | 124.52 | 152.68 | 148.90 | 179.08 | 176.11 | ||||||||||||||||||
| S&P Composite-500 Index |
100.00 | 126.45 | 145.49 | 148.55 | 172.31 | 228.10 | ||||||||||||||||||
36
ITEM 6. SELECTED FINANCIAL DATA
The following selected financial data is qualified in its entirety by, and should be read in conjunction with, the more detailed information contained in the Consolidated Financial Statements and Notes thereto and Management’s Discussion and Analysis of Financial Condition and Results of Operations included elsewhere in this Annual Report on Form 10-K and in our Annual Reports on Form 10-K as of and for each of the years ended December 31, 2013, 2012, 2011, 2010, and 2009. Certain amounts for prior periods have been reclassified to conform to the 2013 presentation.
| (In Thousands, Except Per Share Data) |
2013 | 2012 | 2011 | 2010 | 2009 | |||||||||||||||
| Selected Statement of Operations Data: |
||||||||||||||||||||
| Interest income |
$ | 226,156 | $ | 231,384 | $ | 217,179 | $ | 230,054 | $ | 287,877 | ||||||||||
| Interest expense |
(80,971) | (120,705) | (98,978) | (84,664) | (132,003) | |||||||||||||||
|
|
|
|
|
|
|
|
|
|
|
|||||||||||
| Net interest income |
145,185 | 110,679 | 118,201 | 145,390 | 155,874 | |||||||||||||||
| Provision for loan losses |
(4,737) | (3,648) | (16,151) | (24,135) | (49,573) | |||||||||||||||
|
|
|
|
|
|
|
|
|
|
|
|||||||||||
| Net interest income after provision |
140,448 | 107,031 | 102,050 | 121,255 | 106,301 | |||||||||||||||
| Noninterest income |
||||||||||||||||||||
| Mortgage banking activities, net |
100,676 | 36,319 | - | - | - | |||||||||||||||
| Mortgage servicing rights income, net |
20,309 | (1,391) | - | - | - | |||||||||||||||
| Other market valuation adjustments, net |
(5,709) | 1,539 | (40,017) | (19,554) | (87,628) | |||||||||||||||
| Realized gains, net |
25,259 | 54,921 | 10,946 | 63,496 | 63,166 | |||||||||||||||
|
|
|
|
|
|
|
|
|
|
|
|||||||||||
| Total noninterest income |
140,535 | 91,388 | (29,071) | 43,942 | (24,462) | |||||||||||||||
| Operating expenses |
(84,789) | (65,359) | (47,741) | (53,715) | (46,995) | |||||||||||||||
| Other expense |
(12,000) | - | - | - | - | |||||||||||||||
| (Provision for) benefit from income taxes |
(10,948) | (1,291) | (42) | (280) | 4,268 | |||||||||||||||
|
|
|
|
|
|
|
|
|
|
|
|||||||||||
| Net income |
173,246 | 131,769 | 25,196 | 111,202 | 39,112 | |||||||||||||||
| Less: Net (loss) income attributable to noncontrolling interest |
- | - | (1,147) | 1,150 | (83) | |||||||||||||||
|
|
|
|
|
|
|
|
|
|
|
|||||||||||
| Net Income Attributable to Redwood Trust, Inc. |
$ | 173,246 | $ | 131,769 | $ | 26,343 | $ | 110,052 | $ | 39,195 | ||||||||||
|
|
|
|
|
|
|
|
|
|
|
|||||||||||
| Average common shares – basic |
81,985,897 | 79,529,950 | 78,299,510 | 77,841,634 | 68,458,009 | |||||||||||||||
| Earnings per share – basic |
$ | 2.05 | $ | 1.61 | $ | 0.31 | $ | 1.37 | $ | 0.56 | ||||||||||
| Average common shares – diluted |
93,694,924 | 80,673,682 | 78,299,510 | 78,810,949 | 68,990,891 | |||||||||||||||
| Earnings per share – diluted |
$ | 1.94 | $ | 1.59 | $ | 0.31 | $ | 1.36 | $ | 0.55 | ||||||||||
| Regular dividends declared per common share |
$ | 1.12 | $ | 1.00 | $ | 1.00 | $ | 1.00 | $ | 1.00 | ||||||||||
| Selected Balance Sheet Data: |
||||||||||||||||||||
| Earning assets |
$ | 4,519,775 | $ | 4,343,628 | $ | 5,613,753 | $ | 5,049,254 | $ | 5,090,188 | ||||||||||
| Total assets |
$ | 4,608,528 | $ | 4,444,098 | $ | 5,743,298 | $ | 5,143,688 | $ | 5,252,650 | ||||||||||
| Short-term debt |
$ | 862,763 | $ | 551,918 | $ | 428,056 | $ | 44,137 | $ | - | ||||||||||
| Asset-backed securities issued – Resecuritization |
$ | 94,934 | $ | 164,746 | $ | 219,551 | $ | - | $ | - | ||||||||||
| Asset-backed securities issued – Commercial |
$ | 153,693 | $ | 171,714 | $ | - | $ | - | $ | - | ||||||||||
| Asset-backed securities issued – Sequoia |
$ | 1,694,335 | $ | 2,193,481 | $ | 3,710,423 | $ | 3,458,501 | $ | 3,644,933 | ||||||||||
| Asset-backed securities issued – Acacia |
$ | - | $ | - | $ | 209,381 | $ | 303,077 | $ | 297,596 | ||||||||||
| Long-term debt |
$ | 476,467 | $ | 139,500 | $ | 139,500 | $ | 139,500 | $ | 140,000 | ||||||||||
| Total liabilities |
$ | 3,362,745 | $ | 3,303,934 | $ | 4,850,714 | $ | 4,068,096 | $ | 4,263,559 | ||||||||||
| Noncontrolling interest |
$ | - | $ | - | $ | - | $ | 10,839 | $ | 17,370 | ||||||||||
| Total stockholders’ equity |
$ | 1,245,783 | $ | 1,140,164 | $ | 892,584 | $ | 1,064,753 | $ | 971,721 | ||||||||||
| Number of common shares outstanding |
82,504,801 | 81,716,416 | 78,555,908 | 78,124,668 | 77,737,130 | |||||||||||||||
| Book value per common share |
$ | 15.10 | $ | 13.95 | $ | 11.36 | $ | 13.63 | $ | 12.50 | ||||||||||
| Other Selected Data: |
||||||||||||||||||||
| Average assets |
$ | 4,681,989 | $ | 5,318,442 | $ | 5,357,065 | $ | 5,196,293 | $ | 5,329,461 | ||||||||||
| Average debt and ABS issued outstanding |
$ | 3,333,439 | $ | 4,130,216 | $ | 4,148,421 | $ | 4,011,855 | $ | 4,461,745 | ||||||||||
| Average stockholders’ equity |
$ | 1,200,461 | $ | 987,330 | $ | 1,003,523 | $ | 1,008,126 | $ | 729,032 | ||||||||||
| Net income/average stockholders’ equity |
14.4 | % | 13.3 | % | 2.6 | % | 10.9 | % | 5.4 | % | ||||||||||
37
ITEM 7. MANAGEMENT’S DISCUSSION AND ANALYSIS OF FINANCIAL CONDITION AND RESULTS OF OPERATIONS
INTRODUCTION
Management’s Discussion and Analysis of Financial Condition and Results of Operations (“MD&A”) is intended to provide a reader of our financial statements with a narrative from the perspective of our management on our financial condition, results of operations, liquidity and certain other factors that may affect our future results. Our MD&A is presented in six main sections:
| • | Overview |
| • | Results of Operations |
| • | Liquidity and Capital Resources |
| • | Off Balance Sheet Arrangements and Contractual Obligations |
| • | Critical Accounting Policies and Estimates |
| • | New Accounting Standards |
Our MD&A should be read in conjunction with the Consolidated Financial Statements and related Notes included in Item 8, Financial Statements and Supplementary Data of this Annual Report on Form 10-K. The discussion in this financial review contains forward-looking statements that involve substantial risks and uncertainties. Our actual results could differ materially from those anticipated in these forward looking statements as a result of various factors, such as those discussed in the Cautionary Statement in Part 1, Item 1, Business and in Part 1, Item 1A, Risk Factors of this Annual Report on Form 10-K.
OVERVIEW
Our Business
Redwood Trust, Inc., together with its subsidiaries, is an internally-managed specialty finance company focused on engaging in residential and commercial mortgage banking activities and investing in mortgage- and other real estate-related assets. We seek to invest in real estate-related assets that have the potential to generate attractive cash flow returns over time and to generate income through our mortgage banking activities. We operate our business in three segments: residential mortgage banking, residential investments, and commercial mortgage banking and investments.
Our primary sources of income are net interest income from our investment portfolios and income from our mortgage banking activities. Net interest income consists of the interest income we earn less the interest expenses we incur on borrowed funds and other liabilities. Income from mortgage banking activities consists of the profit we seek to generate through the acquisition or origination of loans and their subsequent sale or securitization. For tax purposes, Redwood Trust, Inc. is structured as a real estate investment trust (“REIT”).
For additional detail on our business, refer to Part I, Item 1, Business of this Annual Report on Form 10-K.
Our Strategy
Following the financial crisis that began in 2007, we made a strategic decision to invest in and build out our residential and commercial loan platforms. We did this with the goal of creating our own steady sources of attractive investments and income-generating opportunities. Overall, there is commonality between our residential and commercial platforms. In both cases, we have established ourselves as an intermediary between borrowers and institutions that invest in residential mortgages and commercial real estate loans through the capital markets. We believe this strategy is well suited to the structure of our balance sheet and the talents and extensive relationships of the professionals who make up our residential and commercial teams.
Since mid-2010, our residential strategy has been focused on acquiring prime, jumbo mortgages for sale through private-label securitization or to institutions that acquire pools of whole loans. While the initial market opportunity appeared small, this strategy has been driven by three primary business assumptions: 1) the government would eventually reduce its outsized role in the mortgage market; 2) new bank regulation (including the implementation of the Basel III capital accord) and legacy portfolio issues at banks
38
would open up an opportunity for independent mortgage companies; and 3) institutional investors that have traditionally invested in triple-A rated mortgage-backed securities would, over time, return to the market to provide attractive financing for prime residential loans through their acquisitions of newly-issued securities. We believe these business assumptions are playing out, although Federal Reserve monetary policy, the pace and direction of mortgage industry legislative and regulatory reform, competitive factors, and market conditions will affect the extent to which they will positively impact our jumbo mortgage business over the near-term. To complement our jumbo mortgage business, beginning in late 2013 we expanded our residential loan platform to include acquiring conforming mortgage loans, which are loans eligible for sale to Fannie Mae and Freddie Mac.
Since 2010, our commercial strategy has been focused on responding to commercial loan refinancing demand brought about by the pre-crisis era of high-leverage lending. An immediate opportunity was identified for mezzanine lending that could bridge the gap between commercial borrowers’ funding needs and the level of financing traditional senior lenders would provide. Beginning in 2012, we also positioned our platform to originate senior commercial loans, with these senior loans being sold primarily to third parties for securitization.
Business Update
We had a productive year at Redwood in 2013 and finished in a strong position. Our book value per share, earnings per share, and dividends all increased on a year-over-year basis, contributing to a 21.4% total return for shareholders for 2013. The Financial and Operational Overview that follows this section provides a summary of our financial results in 2013. From an operational perspective, we continued to build our residential and commercial businesses throughout 2013. This included executing on our strategy to invest in mortgage servicing rights, established a new residential mortgage processing center in Denver, and entering the conforming mortgage sector in the fourth quarter of 2013. Our vision and business strategy for Redwood are driven by the market opportunities we see over the next several years, not over the next several quarters. That long-term perspective gives us confidence that both our residential and commercial businesses, while still in the early stages of expansion, are well positioned for opportunistic growth as these markets evolve.
Over the past four years, we have built residential and commercial loan acquisition platforms with the primary objective being to create a proprietary source of attractive investments and income-generating opportunities. Sourcing investments solely through a bid-in-competition process has become less productive for us in this liquidity-flooded world, as available risk-adjusted investment yields continue to move lower. Our loan acquisition platforms provide us with strong competitive advantages, including the ability to leverage our seller relationships, infrastructure, and distribution capabilities. The competitive barriers to building an effective platform for creating investments are high and there is no fast or easy way to replicate the platforms we have been building over the past four years. Our efforts have required significant effort, capital, and expense. Looking back on the progress we have made, we believe the investments have been well worth it.
We believe 2014 has the potential to be another good year for our commercial business, while the near-term outlook for our residential business is likely to be more challenging for us as well as all other residential market participants. These challenges have our full attention and we believe that our focus on the long-term direction of the residential and commercial mortgage markets, coupled with the strategic actions we are taking, positions Redwood to be a leading investor and provider of private risk capital to the mortgage market over the long term.
The following sections discuss our view of the longer-term direction of the residential and commercial mortgage markets, the market opportunity for Redwood, and how we believe we are positioned to grow and succeed.
Residential
In relation to residential investments and mortgage banking activities, our foremost objectives are to invest in well-underwritten, prime mortgage credit risk and associated servicing rights, and to generate income from loan sales. Until recently, we have been focused primarily on the jumbo segment of the market. Having recently obtained approval as a Fannie Mae and Freddie Mac seller/servicer, however, we now have the ability to acquire conforming loans for sale to these government-sponsored enterprises (“GSEs”), thus significantly expanding our market opportunities.
We believe that the outlook for investing in newly originated prime mortgage credit risk looks promising. While we continue to create and retain credit securities through our Sequoia securitization program, our entry into the much larger conforming market positions us to pursue credit investments in conforming loans through potential credit risk-sharing arrangements with the GSEs.
39
The private label market for residential securitization clearly experienced turmoil during 2013, as yields demanded by investors in triple-A rated RMBS increased from early in the second quarter through the end of the year. However, we believe that over the long term, private-label residential mortgage securitization will return to being an efficient form of mortgage financing and will play a substantial role in the mortgage market, alongside government-supported financing, and bank portfolio lending. We believe triple-A investors will return to the private label securitization market for prime quality loans when improved securitization structures and issuer best practices become widely adopted by participants, thus restoring confidence among investors. Ultimately, we believe that investing in securitized products is one of the most efficient ways for institutional investors to make residential mortgage investments. We also expect that the credit support levels required by rating agencies for RMBS transactions will decline over time, reflecting the performance of the underlying collateral, and this will improve the profitability of securitization transactions for issuers such as Redwood.
Currently, we have been seeing market fundamentals begin to stabilize, while the pricing for triple-A rated RMBS is beginning to show signs of improvement for issuers like us. However, based on the significant volatility in triple-A rated RMBS pricing over the past two years, it is difficult to project the near-term direction of the market with confidence. Redwood completed one private-label residential securitization during the fourth quarter of 2013, and we expect to complete another late in the first quarter or early in the second quarter of 2014. While we continue to prefer to securitize jumbo loans we acquire (because of our ability to create attractive investments for our portfolio), given the current state of the securitization market, we expect whole-loan sales to continue in the near term to account for the disposition of the majority of the jumbo loans we accumulate. Between these two primary distribution outlets (securitization and whole loan sales), we still believe that we can generate attractive loan sale profit margins within our long-term target range of 25 to 50 basis points. (Our loan sale margins exceeded this target range in 2013.)
In 2013, we acquired $6.9 billion of jumbo mortgage loans, a large increase from 2012 when we acquired $2.3 billion, but short of our upwardly revised goal of $8 billion we set for ourselves in mid-2013. In 2014, we expect to increase the number of sellers we acquire loans from. While we expect that our jumbo acquisition volume in 2014 will be lower than in 2013, we expect this decline to be less than the 32% decline projected for the industry as a whole. With respect to conforming residential loans, our goal is to ramp up to a run rate of acquiring $1 billion per month by the end of 2014. We do not expect that ramp up to occur smoothly over the course of 2014, however, given our internal processes for expanding product offerings to our sellers as well as the declining projections we have observed in industry-wide origination as a result of interest-rate volatility.
With respect to government policy issues, we believe the long process of GSE reform will eventually conclude with the creation of an entity or multiple entities that function much as the GSEs do today. We believe the new entities will continue to support some type of conforming mortgage financing to mainstream U.S. borrowers, with the private sector absorbing first-loss credit risk, ahead of a government guarantee. This would represent a very large potential market opportunity for private credit risk investors, especially those with loan acquisition platforms such as Redwood. The foundation for this new structure is already being laid while the GSEs are in conservatorship through structured and contractual credit risk-sharing arrangements with the GSEs.
Commercial
Our commercial team had a successful year in 2013, originating $805 million of senior commercial loans. Although we fell short of our goal of $1 billion of senior commercial originations, our loan sale profit margins exceeded our expectations, as did the overall profitability of this business.
In the near term, if the economy continues to move forward with low-to-moderate growth in 2014, underlying commercial real estate fundamentals should continue to moderately improve as well. Various industry forecasts call for CMBS issuance to increase in 2014 for the fifth consecutive year to a range of $90 to $100 billion, compared to approximately $85 billion in 2013. With close to $250 billion of commercial real estate loans set to mature annually over the next four years, we expect to see substantial refinancing opportunities for those with established commercial origination platforms such as Redwood.
We plan to expand our commercial platform in 2014 by adding experienced originators, positioning us to exceed the $1 billion annual commercial senior loan origination goal, while also boosting our mezzanine loan origination activity. We currently project that the capital we had previously allocated to our commercial mortgage banking and investment activities should remain adequate for us to continue growing this platform.
40
2013 Financial and Operational Overview
Redwood generated strong earnings growth in 2013. Net income increased 31% to $173 million, and earnings per share increased 22% to $1.94 per share in 2013, resulting in a 14.43% return on equity. The following table presents selected financial highlights from 2013 and 2012.
Table 1 – Selected Financial Highlights
| December 31, | ||||||||
|
|
|
|||||||
| (In Dollars, per share basis) | 2013 | 2012 | ||||||
|
|
|
|
|
|
||||
| Net Income per diluted share |
$ | 1.94 | $ | 1.59 | ||||
| REIT Taxable Income per share |
0.93 | 0.75 | ||||||
| Return on Equity |
14.43% | 13.35% | ||||||
| Book Value per share |
15.10 | 13.95 | ||||||
| Dividends per share |
1.12 | 1.00 | ||||||
The increase in net income in 2013 was primarily driven by significant growth in our residential and commercial mortgage banking operations along with continued positive performance from our residential investments portfolio. Higher net income also contributed to an increase in our book value to $15.10 per share and also supported increased dividends of $1.12 per share paid in 2013. The following table presents the changes in book value per share for the year ended December 31, 2013.
Table 2 – Changes in Book Value per Share
| Year Ended | ||||||
| (In Dollars, per share basis) |
December 31, 2013 | |||||
| Beginning book value per share |
$ | 13.95 | ||||
| Net income |
1.94 | |||||
| Changes in unrealized gains/losses, net |
(0.27) | |||||
| Unrealized gains on hedges, net |
0.39 | |||||
| Equity issuance |
0.11 | |||||
| Other, net |
0.10 | |||||
| Dividends |
(1.12) | |||||
|
|
|
|||||
| Ending Book Value per Share |
$ | 15.10 | ||||
|
|
|
|||||
We deployed $583 million of capital into new investments in 2013, as summarized in the following table.
Table 3 – Investment Activity
| Year Ended | ||||||
| (In Millions) (1) |
December 31, 2013 | |||||
| Residential investments |
||||||
| Sequoia RMBS |
$ | 392 | ||||
| Third-Party RMBS |
489 | |||||
| Less: Short-term debt |
(397) | |||||
| MSR Investments |
48 | |||||
|
|
|
|||||
| Net residential investments |
532 | |||||
| Commercial mezzanine investments |
66 | |||||
| Less: Borrowings |
(15) | |||||
|
|
|
|||||
| Net commercial investments |
50 | |||||
|
|
|
|||||
| Equity Capital Invested |
$ | 583 | ||||
|
|
|
|||||
| (1) | Certain totals may not foot, due to rounding. |
41
Residential Mortgage Banking
Our residential mortgage banking business was very active during 2013, with loan acquisitions rising to $7.1 billion from $2.3 billion in 2012, accompanied by the completion of 12 residential prime jumbo securitizations for a total of $5.58 billion during the year, as compared to six securitizations for $1.97 billion during 2012. Due to the Federal Reserve’s accommodative policy actions, interest rates were at historical lows during most of the first half of 2013, spurring significant refinancing volumes. During this time we continued to increase the number of sellers we purchase loans from and saw our acquisition volumes rise significantly.
Beginning late in the second quarter, long-term interest rates began to rise as the bond market began responding to the Federal Reserve’s long anticipated plan to begin “tapering” its purchases of Treasury and mortgage-backed securities (“MBS”). Benchmark interest rates were volatile during the following months, but overall increased through the end of the year, with the benchmark 10-Year Treasury yield rising 88 basis points to 3.04%, from 2.16% at the end of May. According to Freddie Mac’s Primary Mortgage Market Survey, over the same period the average weekly rate for a 30-year fixed-rate conforming mortgage increased 72 basis points to 4.53% by the end of the year, which was 119 basis points higher than a year ago. As a result of the increase in interest rates, the Mortgage Bankers Association reported in late December that its mortgage application index had declined to a 13-year low as refinance related application activity fell to its lowest level since November 2008.
Beginning in the third quarter of 2013, large banks began to offer rates for higher-quality 30-year jumbo loans through their retail loan channels below the rates they were offering for conforming loans. This highly competitive jumbo mortgage pricing is reflective of a combination of the increased guarantee fees that Fannie Mae and Freddie Mac required for conforming loans, and the desire of the larger banks with excess liquidity to invest in higher yielding and presumably safer jumbo mortgages. However, the larger banks have not been as aggressive in pricing jumbo loans through their correspondent lending channels and we are currently able to offer competitive rates and we continue to acquire loans.
As a result of these recent market conditions, including rising interest rates, declining refinance-related loan origination activity, and the aggressive pricing of jumbo mortgage loans by large banks, over the course of the third and fourth quarters of 2013, we saw the volume of loans we identified for purchase and our acquisitions decline. Despite the competitive environment, we have continued to acquire loans, at a slower pace, from a growing number of sellers. We continued to add loan sellers to our platform throughout the year, increasing the total number of active sellers to 118 at December 31, 2013, consisting of 55 regional banks (or their subsidiaries) and 63 mortgage companies, located throughout the U.S.
The following chart presents the amount of loans identified for purchase, loans purchased, and our active sellers over the last five quarters.
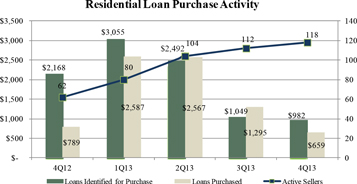
Rising mortgage rates and competition from large banks also had an impact on the private mortgage securitization market, resulting in reduced activity in the third and fourth quarters of 2013. There were three private-label non-conforming securitizations completed by market participants totaling $0.8 billion in the fourth quarter, down from nine securitizations totaling $3.9 billion in the third quarter of 2013, and 19 securitizations totaling $8.3 billion during the first half of 2013. In summary, the rising interest rate environment has caused triple-A investors to require yields in excess of what can be structured from the underlying mortgage loans. As a result, we currently expect to complete another Sequoia securitization late in the first quarter or early in the second quarter of 2014. We continue to value our leadership position in private securitization and remain committed to expanding this area of our business as market conditions improve.
42
While the private mortgage securitization market slowed in the second half of 2013, we began to see better execution in the whole loan market and sold $1.25 billion of whole loans through this channel in the second half of 2013 as compared to $311 million in the first half of 2013. Bank demand for whole jumbo mortgage loans is strong and reflects the excess liquidity in the banking system and, to a lesser extent, favorable accounting treatment of whole loans relative to securities. As such, we expect to remain active in the whole loan market in 2014.
During 2013, we also became an approved seller/servicer to both Fannie Mae and Freddie Mac. This allowed us to begin purchasing “conforming” loans that meet Fannie Mae’s and Freddie Mac’s eligibility criteria in the fourth quarter of 2013. This will also enable us to create our own investments in conforming mortgage servicing rights and positions us to be involved in risk-sharing opportunities relating to these types of loans to the extent those opportunities arise in the future, consistent with the concept envisioned by the Federal Housing Finance Agency.
In part to position ourselves to participate in the conforming loan market and also to accommodate increased jumbo loan production, we invested heavily in our infrastructure during 2013, opening our Denver office and adding scalability to our support operations and systems. As such, direct segment operating costs for residential mortgage banking increased, primarily related to increased headcount and systems upgrades.
Residential Investments
We continued to grow our residential investment portfolio in 2013, increasing the portfolio to $1.64 billion at the end of 2013 from $1.10 billion at the end of 2012. The increase in 2013 primarily resulted from the acquisition of senior and subordinate securities and to a lesser extent MSRs. During the first half of 2013, nearly all of the new securities we acquired in this portfolio were subordinate securities retained from our Sequoia securitizations. These additions were partially offset by continued paydowns as well as strategic sales of senior third-party securities as we looked to reallocate our capital invested in this portfolio.
As discussed in the Residential Mortgage Banking section above, our mortgage loan acquisition volumes decreased significantly in the second half of 2013. This, in combination with a shift toward greater sales through whole loan executions rather than through securitizations, limited the amount of new Sequoia securities and MSRs available to add to our portfolio. During the second half of 2013, we began allocating investment capital into select third-party seasoned senior securities and new-issue subordinate securities. In the near term, we expect industry-wide jumbo securitization volume to remain more limited, although market conditions can change quickly. We continue to expect growth in this business segment will likely come from new investments in MSRs retained from our residential mortgage banking business in addition to opportunistic investments in third-party securities. In the longer-term, we anticipate our portfolio will transition towards a mix of credit and MSR investments, with a smaller percentage of our capital invested in third-party senior securities.
At the end of 2013, our securities portfolio was comprised of 55% senior securities, 34% subordinate securities (30% new-issue subordinates and 4% legacy third-party subordinates) and 11% re-REMIC securities. This compares to 67% senior securities, 18% subordinate securities and 15% re-REMIC securities at the end of 2012. A portion of our senior securities have been resecuritized to provide long-term financing and the remainder are financed with a combination of capital and short-term debt.
Most of the senior securities we own are backed by adjustable-rate mortgages (“ARMs”), or hybrid interest-rate loans that have reset to traditional ARMs, making them less sensitive to changes in interest rates. The subordinate securities we retained from our Sequoia securitizations are predominately backed by fixed-rate collateral making them sensitive to changes in interest rates in addition to credit performance. During 2013, there were minimal overall net fair value changes in our securities portfolio as the impact from rising interest rates was mostly offset by tightening of credit spreads. Increasing interest rates did impact the value of our MSR portfolio, resulting in $12 million of positive market valuation adjustments, bringing the total estimated fair value of this portfolio to $65 million at the end of 2013.
Commercial Mortgage Banking and Investments
The commercial real estate market continued to improve in 2013 along with the overall economy. Strong demand for CMBS throughout the year facilitated the growth of our commercial operations in 2013, as we shifted our focus from the origination of mezzanine loans to be retained for our investment portfolio to senior loans that we sell through to the capital markets associated with our mortgage banking activities. As a result, we originated $805 million of senior loans in 2013 as compared to $60 million in 2012. These higher senior loan origination volumes resulted in higher income from commercial mortgage banking activities.
With our shift in focus away from the origination of mezzanine loan investments, our origination of loans for our investment portfolio decreased to $66 million in 2013 from $156 million in 2013. Our mezzanine loan originations in 2013 were partially offset by two loan
43
pay-offs, bringing the balance of this portfolio to $343 million at the end of 2013. Our returns from this portfolio remained relatively consistent in 2013 with unlevered yields in excess of 10% per annum before credit costs.
Cash, Debt, and Capital
At December 31, 2013, our cash amounted to $173 million and our current investment capacity (defined as the approximate amount of capital we have readily available for long-term investments) was estimated to be approximately $136 million. Our total capital of $1.67 billion at December 31, 2013 included $1.25 billion of equity capital and $427 million of long-term debt.
We ended 2013 with short-term warehouse debt of $185 million, which was used to finance residential loans, and had additional uncommitted borrowing capacity of $1.2 billion under existing warehouse lines of credit to finance additional residential and commercial loans. Our short-term debt used to finance securities at December 31, 2013 was $678 million.
We currently expect that our available capital and liquidity is sufficient to fund our business and investment objectives for most or all of 2014, in part because we believe we can source capital internally by selling or financing existing investments if needed to fund higher yielding investment opportunities. To the extent our expectation changes and we need external capital to fund our investment and business activities, we would consider the issuance of debt or equity securities under the shelf registration statement we currently have on file with the SEC, or the issuance of similar or other types of securities in public or private offerings, including, the possibility of raising dedicated capital for our commercial platform.
RESULTS OF OPERATIONS
The following table presents the components of our GAAP net income for the years ended December 31, 2013, 2012, and 2011.
Table 4 – Net Income
| Year Ended December 31, | ||||||||||||
|
|
|
|||||||||||
| (In Millions, Except per Share Data) (1) | 2013 | 2012 | 2011 | |||||||||
|
|
|
|
|
|
|
|
||||||
| Interest income |
$ | 226 | $ | 231 | $ | 217 | ||||||
| Interest expense |
(81) | (121) | (99) | |||||||||
|
|
|
|
|
|
|
|||||||
| Net Interest Income |
145 | 110 | 118 | |||||||||
| Provision for loan losses |
(5) | (4) | (16) | |||||||||
|
|
|
|
|
|
|
|||||||
| Net Interest Income After Provision |
140 | 106 | 102 | |||||||||
| Noninterest Income |
||||||||||||
| Mortgage banking activities, net |
101 | 36 | - | |||||||||
| MSR income (loss), net |
20 | (1) | - | |||||||||
| Other market valuation adjustments, net |
(6) | 2 | (40) | |||||||||
| Realized gains, net |
25 | 55 | 11 | |||||||||
|
|
|
|
|
|
|
|||||||
| Total noninterest income |
141 | 91 | (29) | |||||||||
| Operating expenses |
(85) | (65) | (48) | |||||||||
| Other expense |
(12) | - | - | |||||||||
|
|
|
|
|
|
|
|||||||
| Net income before provision for income taxes |
184 | 133 | 25 | |||||||||
| Provision for income taxes |
(11) | (1) | - | |||||||||
|
|
|
|
|
|
|
|||||||
| Net income |
173 | 132 | 25 | |||||||||
| Less: Net loss attributable to noncontrolling interest |
- | - | (1) | |||||||||
|
|
|
|
|
|
|
|||||||
| Net Income Attributable to Redwood Trust, Inc. |
$ | 173 | $ | 132 | $26 | |||||||
|
|
|
|
|
|
|
|||||||
| Diluted earnings per common share |
$ | 1.94 | $ | 1.59 | $ | 0.31 | ||||||
| (1) | Certain totals may not foot, due to rounding. |
We are required under GAAP to consolidate the assets and liabilities of certain securitization entities we have sponsored for financial reporting purposes. However, each of these entities is independent of Redwood and of each other and the securitized assets of these entities are not legally ours and we own only the securities and interests that we acquired from these securitization entities. Similarly, the liabilities of these entities are obligations payable only from the cash flows generated by their securitized assets and are not obligations of Redwood. We refer to certain of these securitization entities as “Legacy Consolidated Entities,” and where
44
applicable, in analyzing our results of operations we distinguish results from current operations “at Redwood” and from Legacy Consolidated Entities. For additional detail on results from Legacy Consolidated Entities, see the “Results From Legacy Consolidated Entities” section below. Results at Redwood include all activities from our three business segments.
Net Interest Income After Provision
In 2013, net interest income after provision increased $33 million to $140 million, including $23 million of increases at Redwood and $10 million of increases at Legacy Consolidated Entities. The increase at Redwood was primarily attributable to increased interest income resulting from higher average balances of loans held for sale or securitization during 2013 related to both our residential and commercial mortgage banking activities, in addition to higher average balances of Sequoia IO securities in our residential mortgage banking segment and Sequoia subordinate securities in our residential investment portfolio. Net interest income at Redwood in 2013 also reflects an increase in interest expense, with the majority of the increase resulting from our convertible debt issued in the first quarter of 2013 and from our Commercial Securitization that was completed in the fourth quarter of 2012. The increase attributable to Legacy Consolidated Entities was primarily related to interest expense of $11 million recorded in 2012 related to the deconsolidation of certain legacy entities during the fourth quarter of 2012.
In 2012, net interest income after provision increased $5 million to $107 million, including $14 million of increases at Redwood offset by a $9 million decrease at Legacy Consolidated Entities. The increase at Redwood was primarily attributable to increased interest income from our commercial investment portfolio, which grew substantially during 2012, as well as from higher average balances of residential securities and residential loans held for sale or securitization. The increase in interest income was partially offset by an increase in interest expense as we funded the addition of certain assets in part with debt. The decline in net interest income after provision at Legacy Consolidated Entities is primarily related to the deconsolidation of certain entities discussed above as well as a significant decline in delinquent loan balances at certain consolidated Sequoia entities during 2012.
Additional detail on changes in net interest income at Redwood is provided in the “Net Interest Income” section below.
Mortgage Banking Activities, Net
Mortgage banking activities, net, include valuation changes of residential and commercial loans, valuation changes related to derivatives and Sequoia IO securities used in part to offset risks associated with our mortgage banking activities, and gains from loan sales and securitizations. In 2013, income from mortgage banking activities increased $65 million to $101 million. The majority of this increase was attributable to our residential mortgage banking operations, which contributed $78 million during 2013, an increase of $42 million from 2012. Commercial mortgage banking operations contributed $23 million during 2013, an increase of $22 million from 2012. For both the residential and commercial mortgage banking operations, the increases were primarily driven by growth in transactional volumes. During 2013 we purchased $7.11 billion of residential loans and originated $659 million of commercial senior loans. During 2012 we purchased $1.31 billion of residential loans and originated $24 million of commercial senior loans. We did not recognize income or loss on mortgage banking activities in 2011.
Additional detail on mortgage banking activities is included in the Residential Mortgage Banking and Commercial Mortgage Banking and Investment portions of the “Segment Results” section below.
MSR Income, Net
MSR income is comprised of both the net cash received from the MSRs and their market value changes. MSR income, net increased to $20 million in 2013 from negative $1 million in 2012. In 2013, MSR income was comprised of $8 million of net cash income and $12 million of positive market valuation changes. The overall increase in MSR income was due to the acquisition of $48 million of MSR investments during the year as well as increases in their market value primarily driven by increased mortgage rates during 2013. In 2012, MSR loss was comprised of $1 million of net cash income, offset by $2 million of negative market valuation adjustments. We did not own any MSR investments in 2011.
Additional detail on MSR investments is included in the Residential Investments portion of the “Segment Results” section below.
Other Market Valuation Adjustments, Net
In 2013, the $6 million of negative other market valuation adjustments primarily resulted from $4 million of negative market value changes of trading securities and $2 million of other-than-temporary impairments of AFS securities, each in our Residential Investments segment at Redwood. In 2012, the $2 million of positive other market valuation adjustments primarily resulted from $6 million of net positive valuation adjustments from Legacy Consolidated assets, partially offset by $3 million of negative market valuation adjustments on securities at Redwood.
In 2011, the $40 million of negative other market valuation adjustments were comprised of $29 million of negative adjustments at Redwood and $11 million of negative adjustments at Legacy Consolidated Entities. The adjustments at Redwood primarily resulted from negative valuation changes on derivatives used to hedge loans accumulated for the two securitizations we completed in 2011 as well as other-than-temporary impairments of AFS securities.
45
Realized Gains, Net
In 2013, realized gains, net, of $25 million primarily resulted from the sale of $176 million of AFS securities during the year. Realized gains of $55 million during 2012 resulted primarily from the sale of $167 million of AFS securities for a net realized gain of $32 million and also included $22 million of gains from the deconsolidation of certain Legacy Consolidated Entities during 2012. Realized gains of $11 million during 2011 resulted primarily from the sale of AFS securities at Redwood for a net realized gain of $9 million.
For additional detail on realized gains at Redwood, see the Residential Investments portion of the “Segment Results” below.
Operating Expense
In 2013, operating expense increased $20 million to $85 million. The increase in operating expenses was primarily driven by the additional costs associated with the expansion of our residential and commercial mortgage banking operations. This expansion included the opening of our Denver office in 2013, as well as an increase in overall headcount to 141 at December 31, 2013, from 86 at December 31, 2012. In 2012, operating expense increased $17 million to $65 million primarily due to a $17 million increase in compensation expense compared to 2011. The majority of the compensation expense increase was from variable compensation, which increased year-over-year as the company’s financial performance improved.
Other Expense
Other expense represents a $12 million reserve we established in the fourth quarter of 2013 related to previously disclosed litigation regarding certain legacy Sequoia securitizations. For additional detail on pending litigation matters, refer to “Legal Proceedings” in Part II, Item 3 of this Annual Report on Form 10-K and Note 15 in Part II, Item 8 of this Annual Report on Form 10-K.
Provision for Income Taxes
In 2013, provision for income taxes increased $10 million to $11 million. The increase in income tax expense was primarily driven by higher income from both residential and commercial mortgage banking operations during 2013, which are performed in taxable REIT subsidiaries. Additional detail on provision for income taxes is included in the “Taxable Income” section below.
Net Interest Income
The following table presents the components of net interest income on a consolidated basis for the years ended December 31, 2013, 2012, and 2011.
Table 5 – Net Interest Income – Consolidated
| Year Ended December 31, | ||||||||||||||||||||||||||||||||||||||||||||||||||||||||
| 2013 | 2012 | 2011 | ||||||||||||||||||||||||||||||||||||||||||||||||||||||
| (Dollars in Millions) (1) | Interest Income/ (Expense) |
Average Balance (2) |
Yield (%) |
Interest Income/ (Expense) |
Average Balance (2) |
Yield (%) |
Interest Income/ (Expense) |
Average Balance (2) |
Yield (%) |
|||||||||||||||||||||||||||||||||||||||||||||||
| Interest Income |
||||||||||||||||||||||||||||||||||||||||||||||||||||||||
| Residential loans |
$ | 67 | $ | 2,803 | 2.4 | $ | 82 | $ | 3,575 | 2.3 | $ | 81 | $ | 3,913 | 2.1 | |||||||||||||||||||||||||||||||||||||||||
| Commercial loans |
43 | 382 | 11.4 | 27 | 246 | 10.9 | 9 | 89 | 9.9 | |||||||||||||||||||||||||||||||||||||||||||||||
| Trading securities |
25 | 118 | 20.9 | 37 | 262 | 14.0 | 42 | 301 | 14.1 | |||||||||||||||||||||||||||||||||||||||||||||||
| Available-for-sale securities |
91 | 1,036 | 8.8 | 86 | 860 | 10.0 | 85 | 650 | 13.0 | |||||||||||||||||||||||||||||||||||||||||||||||
| Cash and cash equivalents |
0 | 155 | 0.1 | 0 | 143 | 0.0 | 0 | 157 | 0.0 | |||||||||||||||||||||||||||||||||||||||||||||||
|
|
|
|
|
|
|
|
|
|
|
|
|
|||||||||||||||||||||||||||||||||||||||||||||
| Total interest income |
226 | 4,494 | 5.0 | 231 | 5,085 | 4.6 | 217 | 5,110 | 4.3 | |||||||||||||||||||||||||||||||||||||||||||||||
| Interest Expense |
||||||||||||||||||||||||||||||||||||||||||||||||||||||||
| Short-term debt |
(17) | 989 | (1.8) | (9) | 487 | (1.9) | (1) | 57 | (1.8) | |||||||||||||||||||||||||||||||||||||||||||||||
| ABS issued |
(40) | 2,188 | (1.8) | (102) | 3,504 | (2.9) | (88) | 3,954 | (2.2) | |||||||||||||||||||||||||||||||||||||||||||||||
| Long-term debt |
(24) | 395 | (6.0) | (10) | 139 | (6.9) | (10) | 138 | (6.9) | |||||||||||||||||||||||||||||||||||||||||||||||
|
|
|
|
|
|
|
|
|
|
|
|
|
|||||||||||||||||||||||||||||||||||||||||||||
| Total interest expense |
(81) | 3,571 | (2.3) | (121) | 4,130 | (2.9) | (99) | 4,148 | (2.4) | |||||||||||||||||||||||||||||||||||||||||||||||
|
|
|
|
|
|
|
|||||||||||||||||||||||||||||||||||||||||||||||||||
| Net Interest Income |
$ | 145 | $ | 111 | $ | 118 | ||||||||||||||||||||||||||||||||||||||||||||||||||
|
|
|
|
|
|
|
|||||||||||||||||||||||||||||||||||||||||||||||||||
| (1) | Certain totals may not foot, due to rounding. |
| (2) | Average balances for residential and commercial loans, trading securities, and debt are calculated based upon carrying values. Average balances for available-for-sale securities are calculated based upon amortized cost. |
46
Legacy Consolidated Entities contributed $8 million, negative $4 million, and $11 million to net interest income in 2013, 2012, and 2011, respectively. These amounts are discussed in more detail in the “Results from Legacy Consolidated Entities” section below. The following table presents net interest Income at Redwood and does not include activity from Legacy Consolidated Entities.
Table 6 – Net Interest Income – at Redwood
| Year Ended December 31, | ||||||||||||||||||||||||||||||||||||||||||||||||||||||||
| 2013 | 2012 | 2011 | ||||||||||||||||||||||||||||||||||||||||||||||||||||||
| (Dollars in Millions) (1) | Interest Income/ (Expense) |
Average Balance (2) |
Yield (%) |
Interest Income/ (Expense) |
Average Balance (2) |
Yield (%) |
Interest Income/ (Expense) |
Average Balance (2) |
Yield (%) |
|||||||||||||||||||||||||||||||||||||||||||||||
| Interest Income |
||||||||||||||||||||||||||||||||||||||||||||||||||||||||
| Residential loans |
$ | 33 | $ | 823 | 4.1 | $ | 15 | $ | 392 | 3.9 | $ | 11 | $ | 238 | 4.6 | |||||||||||||||||||||||||||||||||||||||||
| Commercial loans |
43 | 382 | 11.4 | 26 | 235 | 11.1 | 8 | 75 | 10.6 | |||||||||||||||||||||||||||||||||||||||||||||||
| Trading securities |
25 | 118 | 20.9 | 12 | 34 | 35.0 | 8 | 21 | 37.9 | |||||||||||||||||||||||||||||||||||||||||||||||
| Available-for-sale securities |
91 | 1,036 | 8.8 | 86 | 860 | 10.0 | 84 | 643 | 13.0 | |||||||||||||||||||||||||||||||||||||||||||||||
| Cash and cash equivalents |
0 | 155 | 0.1 | 0 | 125 | 0.0 | 0 | 132 | 0.0 | |||||||||||||||||||||||||||||||||||||||||||||||
|
|
|
|
|
|
|
|
|
|
|
|
|
|||||||||||||||||||||||||||||||||||||||||||||
| Total interest income |
192 | 2,513 | 7.7 | 139 | 1,646 | 8.4 | 111 | 1,109 | 10.0 | |||||||||||||||||||||||||||||||||||||||||||||||
| Interest Expense |
||||||||||||||||||||||||||||||||||||||||||||||||||||||||
| Short-term debt |
(17) | 989 | (1.8) | (9) | 487 | (1.9) | (1) | 57 | (1.8) | |||||||||||||||||||||||||||||||||||||||||||||||
| ABS issued |
(14) | 284 | (4.9) | (6) | 205 | (2.9) | (3) | 102 | (2.5) | |||||||||||||||||||||||||||||||||||||||||||||||
| Long-term debt |
(24) | 395 | (6.0) | (10) | 139 | (6.9) | (10) | 138 | (6.9) | |||||||||||||||||||||||||||||||||||||||||||||||
|
|
|
|
|
|
|
|
|
|
|
|
|
|||||||||||||||||||||||||||||||||||||||||||||
| Total interest expense |
(55) | 1,667 | (3.3) | (25) | 831 | (3.0) | (13) | 297 | (4.4) | |||||||||||||||||||||||||||||||||||||||||||||||
|
|
|
|
|
|
|
|||||||||||||||||||||||||||||||||||||||||||||||||||
| Net Interest Income at Redwood |
$ | 137 | $ | 114 | $ | 98 | ||||||||||||||||||||||||||||||||||||||||||||||||||
|
|
|
|
|
|
|
|||||||||||||||||||||||||||||||||||||||||||||||||||
| (1) | Certain totals may not foot, due to rounding. |
| (2) | Average balances for residential and commercial loans, trading securities, and debt are calculated based upon carrying values. Average balances for available-for-sale securities are calculated based upon amortized cost. |
47
The following table details how net interest income at Redwood changed as a result of changes in average investment balances (“volume”) and changes in interest yields (“rate”).
Table 7 – Net Interest Income at Redwood — Volume and Rate Changes
| Change in Net Interest
Income For the Years Ended December 31, 2013 and 2012 |
||||||||||||||||||||
| (In Millions) (1) | Volume | Rate | Total | |||||||||||||||||
| Net Interest Income for the Year Ended December 31, 2012 |
$ | 114 | ||||||||||||||||||
| Impact of Changes in Interest Income |
||||||||||||||||||||
| Residential loans |
$ | 17 | $ | 1 | 18 | |||||||||||||||
| Commercial loans |
16 | 1 | 17 | |||||||||||||||||
| Trading securities |
29 | (16) | 13 | |||||||||||||||||
| Available-for-sale securities |
18 | (12) | 5 | |||||||||||||||||
| Cash and cash equivalents |
- | - | - | |||||||||||||||||
|
|
|
|
|
|
|
|||||||||||||||
| Net changes in interest income |
80 | (27) | 53 | |||||||||||||||||
| Impact of Changes in Interest Expense |
||||||||||||||||||||
| Short-term debt |
(10) | 2 | (8) | |||||||||||||||||
| ABS issued |
(2) | (6) | (8) | |||||||||||||||||
| Long-term debt |
(18) | 3 | (14) | |||||||||||||||||
|
|
|
|
|
|
|
|||||||||||||||
| Net changes in interest expense |
(30) | (1) | (30) | |||||||||||||||||
| Net changes in interest income and expense |
51 | (27) | 23 | |||||||||||||||||
|
|
|
|||||||||||||||||||
| Net Interest Income for the Year Ended December 31, 2013 |
$ | 137 | ||||||||||||||||||
|
|
|
|||||||||||||||||||
| Change in Net Interest
Income For the Years Ended December 31, 2012 and 2011 |
||||||||||||||||||||
| (In Millions) (1) |
Volume | Rate | Total | |||||||||||||||||
| Net Interest Income for the Year Ended December 31, 2011 |
$ | 98 | ||||||||||||||||||
| Impact of Changes in Interest Income |
||||||||||||||||||||
| Residential loans |
$ | 7 | $ | (3) | 5 | |||||||||||||||
| Commercial loans |
17 | 1 | 18 | |||||||||||||||||
| Trading securities |
5 | (1) | 4 | |||||||||||||||||
| Available-for-sale securities |
28 | (26) | 2 | |||||||||||||||||
| Cash and cash equivalents |
- | - | - | |||||||||||||||||
|
|
|
|
|
|
|
|||||||||||||||
| Net changes in interest income |
57 | (29) | 28 | |||||||||||||||||
| Impact of Changes in Interest Expense |
||||||||||||||||||||
| Short-term debt |
(8) | (1) | (8) | |||||||||||||||||
| ABS issued |
(3) | (1) | (3) | |||||||||||||||||
| Long-term debt |
- | - | - | |||||||||||||||||
|
|
|
|
|
|
|
|||||||||||||||
| Net changes in interest expense |
(10) | (1) | (12) | |||||||||||||||||
| Net changes in interest income and expense |
46 | (30) | 17 | |||||||||||||||||
|
|
|
|||||||||||||||||||
| Net Interest Income for the Year Ended December 31, 2012 |
$ | 114 | ||||||||||||||||||
|
|
|
|||||||||||||||||||
| (1) | Certain totals may not foot, due to rounding. |
Analysis of Changes in Net Interest Income at Redwood — 2013 versus 2012
Net interest income at Redwood increased $23 million to $137 million in 2013. This increase was primarily driven by higher interest income, which increased $53 million to $192 million in 2013, resulting from increased average earning assets across each of our segments in 2013.
48
Our residential mortgage banking segment contributed $33 million of the increase in interest income, with $18 million of the increase resulting from higher balances of loans held for sale or securitization during 2013 as we increased our acquisition volumes, and $15 million of the increase resulting from higher balances of Sequoia IO securities retained and held by us during 2013.
Our commercial mortgage banking and investments segment contributed $17 million of the increase, with $14 million resulting from higher average balances of loans held-for-investment, as we added to our portfolio throughout 2012 and 2013, and $3 million from higher balances of senior loans held-for-sale during 2013 as we significantly increased our commercial mortgage banking activities.
Our residential investments segment contributed to $3 million of the increase, as the benefits of higher average balances throughout 2013 were offset by lower yields. The decrease in yields was primarily related to lower unlevered yields available, in general, for new investments made in 2013 relative to investments acquired in prior years. In particular, during 2013, we acquired $308 million of new residential investments that consist of AA, A, and BBB- rated RMBS securities with average unlevered yields of 4-6%. These securities were primarily acquired through Sequoia securitizations we sponsored as well as through third-party sponsored securitizations and represent more junior subordinate securities that we typically hold with equity and long-term debt capital.
IO securities that we retained from Sequoia securitizations issued during 2012 and 2013 are included in our Residential Mortgage Banking segment as they are used, in part, to mitigate certain risks associated with our residential mortgage banking activities. We have elected the fair value option for these securities and classify them as trading securities with changes in their estimated fair value recorded through our income statement in “Mortgage banking activities, net” and interest received on these securities reflected in “Interest income.” Rising interest rates during 2013 resulted in slower expected prepayment speeds for these securities, which increased their fair values, resulting in lower effective yields as presented in the tables above.
The increase from interest income was partially offset by higher interest expense at Redwood, which increased $30 million to $55 million in 2013. This increase in interest expense was generally attributable to our $278 million of convertible debt that was issued in the first quarter of 2013, which contributed to $13 million of the increase, and our Commercial Securitization that was completed in the fourth quarter of 2012, which contributed $9 million of the increase. The remaining $8 million of increases in interest expense were attributable to higher balances of short-term debt outstanding during 2013, primarily related to our residential mortgage banking activities. During 2013, the $995 million of new investments made across all of our segments were funded in part with $412 million of short-term debt.
Additional detail regarding the activities impacting net interest income at each of our business segments is included the “Segment Results” section below.
The following table presents the spread between the yield on unsecuritized loans and securities and their specific debt financing costs at December 31, 2013.
Table 8 – Interest Expense — Specific Borrowing Costs
| December 31, 2013 | Residential Loans |
Residential Securities |
||||||||||
| Asset yield |
4.09% | 5.96% | ||||||||||
| Short-term debt yield |
1.71% | 1.34% | ||||||||||
|
|
|
|
|
|||||||||
| Net spread |
2.38% | 4.62% | ||||||||||
|
|
|
|
|
|||||||||
For additional discussion on short-term debt including information regarding margin requirements and financial covenants see “Risks Relating to Short-Term Debt Incurred Under Residential Mortgage Loan Warehouse Facilities, Securities Repurchase Facilities, and Other Short-Term Debt Facilities; and Risks Relating to Debt Incurred Under Commercial Debt Investment Repurchase Facilities” in the “Liquidity and Capital Resources” section below.
Analysis of Changes in Net Interest Income at Redwood — 2012 versus 2011
Net interest income at Redwood increased $17 million to $114 million in 2012. This increase was primarily driven by higher interest income of $28 million, resulting from increased average earning assets across each of our segments in 2012. This increase was partially offset by a decline in average yields on our investment securities that was primarily due to the change in mix of our investments from more credit sensitive, higher yielding securities to less credit sensitive, lower yielding securities.
49
The increase from interest income was partially offset by higher interest expense, which increased $12 million to $25 million in 2012. This increase was primarily due to higher average short-term debt outstanding that was used to finance the higher balances of earning assets during 2012, as well as the securitization of $291 million of commercial mezzanine loans in November 2012, where we sold $172 million of senior debt. During 2012, the $509 million of investments we purchased or retained from securitizations were funded in part with $267 million of short-term debt.
50
Segment Results
The following is a discussion of the results of operations for our three business segments for the years ended December 31, 2013 and 2012. Our segments were determined as of December 31, 2013, and prior period results have been conformed to the current presentation. In 2011, our activities were almost exclusively within the residential investments segment. Accordingly, segment information is presented beginning with the 2012 fiscal year.
Residential Mortgage Banking
The following table presents the components of segment contribution for the residential mortgage banking segment for the years ended December 31, 2013 and 2012.
Table 9 – Residential Mortgage Banking Segment Contribution
| Year Ended December 31, | ||||||||
| (In Thousands) |
2013 | 2012 | ||||||
| Interest income |
$ | 52,517 | $ | 19,714 | ||||
| Interest expense |
(10,167) | (3,179) | ||||||
|
|
|
|
|
|||||
| Net interest income |
42,350 | 16,535 | ||||||
| Other market valuation adjustments, net |
38 | 623 | ||||||
| Mortgage banking activities, net |
77,575 | 35,170 | ||||||
| Direct operating expenses |
(21,062) | (12,940) | ||||||
| Provision for income taxes |
(5,947) | - | ||||||
|
|
|
|
|
|||||
| Segment Contribution |
$ | 92,954 | $ | 39,388 | ||||
|
|
|
|
|
|||||
The following table provides the activity of unsecuritized residential loans during the years ended December 31, 2013 and 2012.
Table 10 – Unsecuritized Residential Loans — Activity
| Year Ended December 31, 2013 | Year Ended December 31, 2012 | |||||||||||||||
| (In Thousands) |
Fair Value Option |
At Lower of Cost or Fair Value |
Fair Value Option |
At Lower of Cost or Fair Value |
||||||||||||
| Balance at beginning of period |
$ | 553,576 | $ | 9,082 | $ | - | $ | 395,237 | ||||||||
| Acquisitions |
7,107,530 | (27) | 1,313,420 | 998,940 | ||||||||||||
| Sales |
(7,229,896) | (5,747) | (794,456) | (1,370,048) | ||||||||||||
| Principal repayments |
(17,078) | (1,677) | (3,202) | (15,618) | ||||||||||||
| Changes in fair value, net |
(11,530) | 34 | 37,814 | 571 | ||||||||||||
|
|
|
|
|
|
|
|
|
|||||||||
| Balance at End of Period |
$ | 402,602 | $ | 1,665 | $ | 553,576 | $ | 9,082 | ||||||||
|
|
|
|
|
|
|
|
|
|||||||||
The following table provides the activity of our retained Sequoia IO securities for the years ended December 31, 2013 and 2012.
Table 11 – Sequoia IO Securities Activity
| Year Ended December 31, | ||||||||
| (In Thousands) |
2013 | 2012 | ||||||
| Beginning fair value |
$ | 10,409 | $ | - | ||||
| Acquisitions |
105,320 | 38,634 | ||||||
| Sales |
(48,633) | (16,523) | ||||||
| Change in fair value, net |
43,409 | (11,702) | ||||||
|
|
|
|
|
|||||
| Ending fair value |
$ | 110,505 | $ | 10,409 | ||||
|
|
|
|
|
|||||
51
Overview
During the year ended December 31, 2013, we acquired over $7 billion in prime jumbo mortgage loans, completed 12 securitizations for a total of $5.58 billion and sold $1.6 billion through whole loan sales to third parties. In conjunction with these securitizations, we retained $105 million of IOs in our Residential Mortgage Banking segment and $298 million of subordinate securities and $43 million of MSRs in our Residential Investment segment. At December 31, 2013, our pipeline of residential loans included $403 million of residential loans held on balance sheet and $589 million of loans identified for purchase.
Segment contribution from residential mortgage banking increased $54 million to $93 million in 2013, primarily resulting from increased loan acquisition volume, which totaled $7.1 billion in 2013 as compared to $2.3 billion in 2012. This increase in volume served to increase both net interest income as well as income from mortgage banking activities. These increases in income were partially offset by higher direct operating expenses and provision for income taxes.
Increased operating costs primarily resulted from expanding our infrastructure to facilitate the growth in mortgage banking operations, including the opening of our Denver office and increasing our headcount of employees now directly involved in this business. All residential mortgage banking activities are performed in taxable subsidiaries. Accordingly, increased income from this segment resulted in higher provision for income tax in 2013. The provision for income tax in 2013 was partially offset by a release of reserves on certain deferred tax assets during 2013. Going forward, we expect to incur a higher effective tax rate on our residential mortgage banking activities, closer to the 34% federal rate as we continue to benefit from state loss carryforwards.
Net Interest Income
Net interest income from residential mortgage banking is primarily comprised of interest income earned on residential loans from the time we purchase the loans to when we sell or securitize them, offset by interest expense incurred on short-term warehouse debt used in part to finance the loans while we hold them on balance sheet. Net interest income also includes interest income from Sequoia IOs that are used to mitigate certain risks related to interest rate movements on our residential loan pipeline.
In 2013, our net interest income from loans held on balance sheet prior to sale was $33 million and interest income from Sequoia IOs was $19 million. The amount of net interest income we earn on loans held on balance is dependent on many variables, including the amount of loans and the time they are outstanding on balance sheet and their interest rates, as well as the amount of leverage we employ through the use of short-term debt to finance the loans and the interest rates on that debt. These factors will impact interest income in future periods. During 2013, we sold $49 million of Sequoia IO securities, and we may sell additional Sequoia IOs in the future, which would reduce interest income in this segment.
Mortgage Banking Activities, Net
Mortgage banking activities, net, include the changes in market value associated with both the loans we hold on balance sheet prior to sale, as well as the derivative instruments and Sequoia IO securities we use to manage risks associated with our residential loan pipeline. Our loan sale profit margins are measured over the period from which we identify a loan for purchase and subsequently sell or securitize the loan and may be realized over the course of one or more quarters for financial reporting purposes.
52
The following table presents the components of mortgage banking activities, net from residential mortgage banking. Amounts presented below represent changes in market value for loans that were sold and associated derivative positions that were settled during the periods presented as well as changes in market values of loans, derivatives and Sequoia IOs outstanding as of the end of each year presented.
Table 12 – Components of Residential Mortgage Banking Activities, Net (1)
| Year Ended December 31, | ||||||||
| (In Thousands) |
2013 | 2012 | ||||||
| Changes in fair value of: |
||||||||
| Residential loans, at fair value |
$ | (12,263) | $ | 37,762 | ||||
| Sequoia IO securities |
42,451 | (11,702) | ||||||
| Risk management derivatives |
47,786 | (10,604) | ||||||
| Purchase and forward sale commitments |
(399) | - | ||||||
| Net gains on mortgage loan securitizations |
- | 17,931 | ||||||
| Net gains on residential loan sales to third parties |
- | 1,783 | ||||||
|
|
|
|
|
|||||
| Total Residential Mortgage Banking Activities, Net |
$ | 77,575 | $ | 35,170 | ||||
|
|
|
|
|
|||||
| (1) | We elected the fair value option for held-for-sale residential loans purchased subsequent to June 30, 2012. Amounts reported as net gains on loan securitizations and sales to third parties for 2012 relate to the sale of loans held at the lower of cost or fair value that were purchased or originated prior to the dates we began to elect the fair value option for these loans and represent the net benefit of the gross proceeds from the sale of the loans, less the carrying value of the loans and any related issuance costs. |
Higher loan acquisition volume in 2013 contributed to a $42 million increase in income from mortgage banking activities to $78 million in 2013. While volatility in interest rates contributed to a net decline in the fair value of residential loans held-for-sale, this decrease in value was more than offset by increases in the value of risk management derivatives and Sequoia IOs that were used in part to hedge exposure to interest rate risk on these loans. The increase in fair value of Sequoia IOs in 2013 resulted from increases in current benchmark interest rates as well as the market expectation for higher interest rates in the future, resulting in lower expected prepayment speeds for the loans underlying these securities and higher valuations. However, given the significant increase in rates during the year, further increases in rates could have a more limited impact to the fair value of these securities. Additionally, decreases in current or expected future interest rates could cause decreases in the fair value of these securities, which would negatively impact income from mortgage banking activities in the future and could disproportionately impact profitability of this segment depending on the amount of loans in our pipeline and their interest rates relative to market interest rates at any point in time.
At the end of 2013, we had repurchase reserves of $1.8 million outstanding, all of which were recorded in 2013 as a reduction to changes in the fair value of residential loans in “Mortgage banking activities, net.” As of December 31, 2013, there have been no loan-level repurchase claims made to Redwood where the entity that originated the loans in question was insolvent. We review our loan repurchase reserves each quarter and will adjust them as necessary based on current information available at each reporting date.
The following table details outstanding principal balances for these loans by product type at December 31, 2013.
Table 13 – Characteristics of Unsecuritized Residential Loans
| December 31, 2013 (Dollars In Thousands) |
Principal Value | Weighted Average Coupon |
||||||
| First Lien Prime |
||||||||
| Fixed - 30 year |
$ | 278,776 | 4.36% | |||||
| Fixed - 15 & 20 year |
28,632 | 3.66% | ||||||
| Hybrid |
91,974 | 3.42% | ||||||
| ARM |
1,490 | 1.68% | ||||||
|
|
|
|||||||
| Total Outstanding Principal |
$ | 400,872 | 4.08% | |||||
|
|
|
|||||||
During the second half of 2013, as mortgage rates were rising and overall mortgage loan volumes were falling, we began to see a greater amount of non 30-year fixed-rate loans originated, particularly hybrid loans. Whereas our acquisitions were almost entirely
53
comprised of 30-year fixed-rate loans during the first half of 2013, in the second half of the year an increasing portion were non 30-year fixed-rate loans, as represented in the table above. We expect this trend to continue into 2014. In addition, during the fourth quarter of 2013, we began to acquire and sell conforming mortgage loans, purchasing $17 million from our current active sellers and selling $5 million to Fannie Mae and Freddie Mac. At the end of 2013, our loans held-for-sale included $12 million of conforming loans and we had loan purchase commitment derivatives outstanding valued at $380 thousand that were associated with commitments to purchase an additional $43 million of conforming loans.
Residential Investments
Our residential investments segment is comprised of our residential securities portfolio and MSR portfolio. Sequoia IOs that are included as a component of senior prime trading securities in our consolidated financial statements are included in our Residential Mortgage Banking segment for reporting purposes. As such, they are excluded from any amounts and tables in this section and such amounts and tables will not agree to amounts presented in our consolidated financial statements for securities.
The following table presents the components of segment contribution for the residential investments segment for the years ended December 31, 2013 and 2012.
Table 14 – Residential Investments Segment Contribution
| Year Ended December 31, | ||||||||
| (In Thousands) |
2013 | 2012 | ||||||
| Interest income |
$ | 96,399 | $ | 93,266 | ||||
| Interest expense |
(10,067) | (11,065) | ||||||
|
|
|
|
|
|||||
| Net interest income |
86,332 | 82,201 | ||||||
| Other market valuation adjustments, net |
(5,134) | (5,228) | ||||||
| MSR income, net |
20,309 | (1,391) | ||||||
| Realized gains, net |
24,765 | 32,451 | ||||||
| Direct operating expenses |
(4,035) | (5,711) | ||||||
| Provision for income taxes |
(3,027) | - | ||||||
|
|
|
|
|
|||||
| Total Segment Contribution |
$ | 119,210 | $ | 102,322 | ||||
|
|
|
|
|
|||||
The following table provides real estate securities activity in our residential investments segment for the years ended December 31, 2013 and 2012.
Table 15 – Real Estate Securities Activity
| Year Ended December 31, | ||||||||
| (In Thousands) |
2013 | 2012 | ||||||
| Beginning fair value |
$ | 1,098,344 | $ | 750,736 | ||||
| Acquisitions |
||||||||
| Sequoia securities |
301,072 | 110,390 | ||||||
| Third-party securities |
488,599 | 358,720 | ||||||
| Sales |
||||||||
| Sequoia securities |
- | - | ||||||
| Third-party securities |
(185,299) | (167,903) | ||||||
| Gains on sales and calls, net |
24,765 | 32,451 | ||||||
| Effect of principal payments |
(147,602) | (119,245) | ||||||
| Change in fair value, net |
(7,523) | 133,195 | ||||||
|
|
|
|
|
|||||
| Ending Fair Value |
$ | 1,572,356 | $ | 1,098,344 | ||||
|
|
|
|
|
|||||
54
The following table provides MSR activity in our residential investments segment for the years ended December 31, 2013 and 2012.
Table 16 – MSR Activity
| Year Ended December 31, | ||||||||
| (In Thousands) |
2013 | 2012 | ||||||
| Balance at beginning of period |
$ | 5,315 | $ | - | ||||
| Additions |
47,514 | 7,329 | ||||||
| Change in fair value, net |
11,995 | (2,014) | ||||||
|
|
|
|
|
|||||
| Balance at End of Period |
$ | 64,824 | $ | 5,315 | ||||
|
|
|
|
|
|||||
Residential Securities Portfolio
During 2013, our residential securities portfolio increased $474 million to $1.57 billion, primarily driven by the acquisition of $298 million of subordinate securities from Sequoia securitizations we issued during 2013, as well as $131 million of net increases in senior securities and the acquisition of $69 million of new-issue third-party subordinate securities. In 2013 we sold the remainder of our commercial securities. At December 31, 2013, the residential securities held (as a percentage of current market value) consisted of fixed-rate assets (39%), adjustable-rate assets (19%), hybrid assets that reset within the next year (27%), and hybrid assets that reset between 12 and 36 months (15%). Table 17 below provides detail for the activity in our securities portfolio by collateral type.
Net interest income from our securities portfolio increased $4 million to $86 million in 2013, primarily due to an increase in interest income resulting from higher average earning assets, which increased to $1.05 billion in 2013 from $883 million in 2012. The increase in interest income from higher average balances was partially offset by a decline in interest income from lower asset yields, which in the aggregate declined to 9.15% in 2013 from 10.57% in 2012. This decrease in yield is primarily attributable to the changing composition of our portfolio as higher yielding legacy senior and subordinate securities purchased in past years at deeper discounts pay down and are replaced by new-issue Sequoia and third-party subordinate securities and seasoned third-party senior securities that have lower relative yields. Table 18 presents the composition of the portfolio by vintage and Table 19 provides additional detail on the yields by security type for our AFS securities portfolio.
Additionally, net interest income benefited from a $1 million decrease in interest expense to $10 million in 2013 that was primarily driven by a reduction in the average balance of the ABS debt outstanding on the Residential Resecuritization during 2013. The average balance of short-term debt used in part to fund our residential securities portfolio increased modestly in 2013, accompanying increases in average assets.
During 2013, we realized $25 million of net gains on sales and calls of securities, primarily comprised of $13 million of net gains from strategic sales of certain third-party senior and subordinate securities and $12 million from the sale of the remainder of our commercial securities. Although we generally intend to hold our investment securities as long-term investments, we may sell certain of these securities in order to manage our interest rate risk and liquidity needs, to meet other operating objectives and to adapt to market conditions. We cannot predict the timing and impact of future sales of investment securities, if any.
During 2013, we recognized $8 million of net changes in fair value related to our residential securities portfolio. Of this amount, $6 million was recognized through the income statement in other market valuation adjustments, including $4 million related to fair value changes for trading securities and $2 million related to other-than-temporary impairments on securities in an unrealized loss position. The remaining $2 million was recognized through accumulated comprehensive income on the balance sheet. Table 17 provides detail on the changes in fair value for securities by collateral type and Table 20 provides detail on cumulative gross gains and losses by collateral type.
55
The following table provides the activity of our real estate securities by collateral type in our residential investments segment for the years ended December 31, 2013 and 2012.
Table 17 – Real Estate Securities Activity by Collateral Type
| Year Ended December 31, 2013 | Residential | |||||||||||||||||||||||
| (In Thousands) |
Senior | Re-REMIC (1) | Subordinate | Commercial | CDO | Total | ||||||||||||||||||
| Beginning fair value |
$ | 733,923 | $ | 163,035 | $ | 187,317 | $ | 14,069 | $ | - | $ | 1,098,344 | ||||||||||||
| Acquisitions |
||||||||||||||||||||||||
| Sequoia securities |
3,403 | - | 297,669 | - | - | 301,072 | ||||||||||||||||||
| Third-party securities |
419,522 | - | 69,077 | - | - | 488,599 | ||||||||||||||||||
| Sales |
||||||||||||||||||||||||
| Sequoia securities |
- | - | - | - | - | - | ||||||||||||||||||
| Third-party securities |
(163,986) | - | (7,244) | (14,069) | - | (185,299) | ||||||||||||||||||
| Gains on sales and calls, net |
8,397 | - | 4,330 | 12,038 | - | 24,765 | ||||||||||||||||||
| Effect of principal payments (2) |
(128,694) | - | (18,908) | - | - | (147,602) | ||||||||||||||||||
| Change in fair value, net |
(7,803) | 13,341 | (1,023) | (12,038) | (3) | - | (7,523) | |||||||||||||||||
|
|
|
|
|
|
|
|
|
|
|
|
|
|||||||||||||
| Ending Fair Value |
$ | 864,762 | $ | 176,376 | $ | 531,218 | $ | - | $ | - | $ | 1,572,356 | ||||||||||||
|
|
|
|
|
|
|
|
|
|
|
|
|
|||||||||||||
| Year Ended December 31, 2012 | Residential | |||||||||||||||||||||||
| (In Thousands) |
Senior | Re-REMIC (1) | Subordinate | Commercial | CDO | Total | ||||||||||||||||||
| Beginning fair value |
$ | 554,572 | $ | 119,366 | $ | 70,343 | $ | 5,445 | $ | 1,010 | $ | 750,736 | ||||||||||||
| Acquisitions |
||||||||||||||||||||||||
| Sequoia securities |
- | - | 110,390 | - | - | 110,390 | ||||||||||||||||||
| Third-party securities |
327,492 | 26,135 | 5,093 | - | - | 358,720 | ||||||||||||||||||
| Sales |
- | |||||||||||||||||||||||
| Sequoia securities |
- | - | - | - | - | - | ||||||||||||||||||
| Third-party securities |
(131,612) | (19,528) | (10,602) | (4,756) | (1,405) | (167,903) | ||||||||||||||||||
| Gains on sales and calls, net |
16,917 | 10,636 | 1,339 | 3,272 | 287 | 32,451 | ||||||||||||||||||
| Effect of principal payments (2) |
(106,332) | - | (12,913) | - | - | (119,245) | ||||||||||||||||||
| Change in fair value, net |
72,886 | 26,426 | 23,667 | 10,108 | 108 | 133,195 | ||||||||||||||||||
|
|
|
|
|
|
|
|
|
|
|
|
|
|||||||||||||
| Ending Fair Value |
$ | 733,923 | $ | 163,035 | $ | 187,317 | $ | 14,069 | $ | - | $ | 1,098,344 | ||||||||||||
|
|
|
|
|
|
|
|
|
|
|
|
|
|||||||||||||
| (1) | Re-REMIC securities, as presented herein, were created by third parties through the resecuritization of certain senior interests to provide additional credit support to those interests. |
| (2) | The effect of principal payments reflects the change in fair value due to principal payments, which is calculated as the cash principal received on a given security during the period multiplied by the prior quarter ending price or acquisition price for that security. |
| (3) | The change in fair value, net reflects the liquidation of our remaining commercial securities, resulting in an ending fair value of zero for this portfolio. |
56
The following table presents real estate securities at December 31, 2013, categorized by portfolio vintage (the years the securities were issued), by priority of cash flows (senior, re-REMIC, and subordinate), and by quality of underlying loans (prime and non-prime).
Table 18 – Securities by Vintage and as a Percentage of Total Securities (1) (2)
| December 31, 2013 (In Millions) |
2004 & Earlier | 2005 | 2006 - 2008 |
2012 - 2013 |
Total | % of Total Securities |
||||||||||||||||||
| Senior |
||||||||||||||||||||||||
| Prime |
$ | 170 | $ | 277 | $ | 213 | $ | 3 | $ | 663 | 42 % | |||||||||||||
| Non-prime |
82 | 115 | 5 | - | 202 | 13 % | ||||||||||||||||||
|
|
|
|
|
|
|
|
|
|
|
|
|
|||||||||||||
| Total Senior |
252 | 392 | 218 | 3 | 865 | 55 % | ||||||||||||||||||
| Re-REMIC |
- | 74 | 103 | - | 177 | 11 % | ||||||||||||||||||
| Subordinate |
||||||||||||||||||||||||
| Prime |
42 | 18 | 2 | 469 | 531 | 34 % | ||||||||||||||||||
|
|
|
|
|
|
|
|
|
|
|
|
|
|||||||||||||
| Total Subordinate |
42 | 18 | 2 | 469 | 531 | 34 % | ||||||||||||||||||
|
|
|
|
|
|
|
|
|
|
|
|
|
|||||||||||||
| Total Securities |
$ | 294 | $ | 484 | $ | 323 | $ | 472 | $ | 1,573 | 100 % | |||||||||||||
|
|
|
|
|
|
|
|
|
|
|
|
|
|||||||||||||
| December 31, 2012 (In Millions) |
2004 & Earlier | 2005 | 2006 - 2008 |
2012 | Total | % of Total Securities |
||||||||||||||||||
| Senior |
||||||||||||||||||||||||
| Prime |
$ | 22 | $ | 190 | $ | 255 | $ | - | $ | 467 | 42 % | |||||||||||||
| Non-prime |
99 | 162 | 6 | - | 267 | 24 % | ||||||||||||||||||
|
|
|
|
|
|
|
|
|
|
|
|
|
|||||||||||||
| Total Senior |
121 | 352 | 261 | - | 734 | 67 % | ||||||||||||||||||
| Re-REMIC |
- | 67 | 96 | - | 163 | 15 % | ||||||||||||||||||
| Subordinate |
||||||||||||||||||||||||
| Prime |
56 | 13 | 2 | 114 | 185 | 17 % | ||||||||||||||||||
| Non-prime |
2 | 1 | - | - | 3 | - % | ||||||||||||||||||
|
|
|
|
|
|
|
|
|
|
|
|
|
|||||||||||||
| Total Subordinate |
58 | 14 | 2 | 114 | 188 | 17 % | ||||||||||||||||||
| Commercial subordinate |
14 | - | - | - | 14 | 1 % | ||||||||||||||||||
|
|
|
|
|
|
|
|
|
|
|
|
|
|||||||||||||
| Total Securities |
$ | 193 | $ | 433 | $ | 359 | $ | 114 | $ | 1,099 | 100 % | |||||||||||||
|
|
|
|
|
|
|
|
|
|
|
|
|
|||||||||||||
| (1) | Certain totals may not foot, due to rounding. |
| (2) | The securities and interests that we acquired from the Residential Resecuritization entity (which are eliminated for consolidation purposes) were $152 million at December 31, 2013. As a result, to adjust at December 31, 2013, for the legal and economic interests that resulted from the Residential Resecuritization, total residential senior securities would be decreased by $263 million to $602 million, total re-REMIC residential securities would be increased by $152 million to $329 million, and total residential securities would be reduced by $111 million to $1.46 billion. |
57
The following tables present the components of the interest income we earned on AFS securities for the years ended December 31, 2013 and 2012.
Table 19 – Interest Income — AFS Securities
| Year Ended December 31, 2013 | Yield as a Result of (1) | |||||||||||||||||||||||||||
| (Dollars in Thousands) |
Interest Income |
Discount (Premium) Amortization |
Total Interest Income |
Average Amortized Cost |
Interest Income |
Discount (Premium) Amortization |
Total Interest Income |
|||||||||||||||||||||
| Residential |
||||||||||||||||||||||||||||
| Senior |
$ | 23,892 | $ | 20,887 | $ | 44,779 | $ | 566,620 | 4.22 % | 3.69 % | 7.90 % | |||||||||||||||||
| Re-REMIC |
10,938 | 4,110 | 15,048 | 101,319 | 10.80 % | 4.06 % | 14.85 % | |||||||||||||||||||||
| Subordinate |
20,514 | 9,943 | 30,457 | 367,853 | 5.58 % | 2.70 % | 8.28 % | |||||||||||||||||||||
|
|
|
|
|
|
|
|
|
|||||||||||||||||||||
| Total Residential |
55,344 | 34,940 | 90,284 | 1,035,792 | 5.34 % | 3.37 % | 8.72 % | |||||||||||||||||||||
| Commercial |
647 | (22) | 625 | 189 | 342.49 % | (11.65) % | 330.84 % | |||||||||||||||||||||
|
|
|
|
|
|
|
|
|
|||||||||||||||||||||
| Total AFS Securities |
$ | 55,991 | $ | 34,918 | $ | 90,909 | $ | 1,035,981 | 5.40 % | 3.37 % | 8.78 % | |||||||||||||||||
|
|
|
|
|
|
|
|
|
|||||||||||||||||||||
| Year Ended December 31, 2012 | Yield as a Result of (1) | |||||||||||||||||||||||||||
| (Dollars in Thousands) |
Interest Income |
Discount (Premium) Amortization |
Total Interest Income |
Average Amortized Cost |
Interest Income |
Discount (Premium) Amortization |
Total Interest Income |
|||||||||||||||||||||
| Residential |
||||||||||||||||||||||||||||
| Senior |
$ | 29,837 | $ | 23,008 | $ | 52,845 | $ | 642,049 | 4.65 % | 3.58 % | 8.23 % | |||||||||||||||||
| Re-REMIC |
12,508 | 167 | 12,675 | 93,358 | 13.40 % | 0.18 % | 13.58 % | |||||||||||||||||||||
| Subordinate |
10,688 | 7,601 | 18,289 | 120,682 | 8.86 % | 6.30 % | 15.15 % | |||||||||||||||||||||
|
|
|
|
|
|
|
|
|
|||||||||||||||||||||
| Total Residential |
53,033 | 30,776 | 83,809 | 856,089 | 6.19 % | 3.59 % | 9.79 % | |||||||||||||||||||||
| Commercial |
1,622 | 336 | 1,958 | 3,529 | 45.96 % | 9.52 % | 55.48 % | |||||||||||||||||||||
| CDO |
117 | (117) | - | - | - | - | - | |||||||||||||||||||||
|
|
|
|
|
|
|
|
|
|||||||||||||||||||||
| Total AFS Securities |
$ | 54,772 | $ | 30,995 | $ | 85,767 | $ | 859,618 | 6.37 % | 3.61 % | 9.98 % | |||||||||||||||||
|
|
|
|
|
|
|
|
|
|||||||||||||||||||||
| (1) | Cash flow from many of our subordinate securities can be volatile and in certain cases (e.g., when the amortized cost of certain securities are close to zero) any interest income earned can result in unusually high reported yields that are not sustainable and not necessarily meaningful, such as those for commercial securities sold in 2013. |
The following tables present the components of carrying value at December 31, 2013 and 2012 for our AFS residential securities.
Table 20 – Carrying Value of AFS Residential Securities
| December 31, 2013 | Senior | |||||||||||||||||||
| (In Thousands) |
Prime | Non-prime | Re-REMIC | Subordinate | Total | |||||||||||||||
| Principal balance |
$ | 670,051 | $ | 218,603 | $ | 214,046 | $ | 706,292 | $ | 1,808,992 | ||||||||||
| Credit reserve |
(10,144) | (13,840) | (30,429) | (62,457) | (116,870) | |||||||||||||||
| Unamortized discount, net |
(44,133) | (36,882) | (80,188) | (137,266) | (298,469) | |||||||||||||||
|
|
|
|
|
|
|
|
|
|
|
|||||||||||
| Amortized cost |
615,774 | 167,881 | 103,429 | 506,569 | 1,393,653 | |||||||||||||||
| Gross unrealized gains |
47,980 | 25,654 | 72,947 | 41,205 | 187,786 | |||||||||||||||
| Gross unrealized losses |
(1,448) | (149) | - | (21,536) | (23,133) | |||||||||||||||
|
|
|
|
|
|
|
|
|
|
|
|||||||||||
| Carrying Value |
$ | 662,306 | $ | 193,386 | $ | 176,376 | $ | 526,238 | $ | 1,558,306 | ||||||||||
|
|
|
|
|
|
|
|
|
|
|
|||||||||||
58
| December 31, 2012 | Senior | |||||||||||||||||||
| (In Thousands) |
Prime | Non-prime | Re-REMIC | Subordinate | Total | |||||||||||||||
| Principal balance |
$ | 485,033 | $ | 278,229 | $ | 215,863 | $ | 298,276 | $ | 1,277,401 | ||||||||||
| Credit reserve |
(26,100) | (18,104) | (47,235) | (95,593) | (187,032) | |||||||||||||||
| Unamortized discount, net |
(53,601) | (42,842) | (69,310) | (37,668) | (203,421) | |||||||||||||||
|
|
|
|
|
|
|
|
|
|
|
|||||||||||
| Amortized cost |
405,332 | 217,283 | 99,318 | 165,015 | 886,948 | |||||||||||||||
| Gross unrealized gains |
61,265 | 28,669 | 63,717 | 23,278 | 176,929 | |||||||||||||||
| Gross unrealized losses |
(74) | (686) | - | (1,605) | (2,365) | |||||||||||||||
|
|
|
|
|
|
|
|
|
|
|
|||||||||||
| Carrying Value |
$ | 466,523 | $ | 245,266 | $ | 163,035 | $ | 186,688 | $ | 1,061,512 | ||||||||||
|
|
|
|
|
|
|
|
|
|
|
|||||||||||
At December 31, 2013, credit reserves for our securities portfolio totaled $117 million, or 6.5% of the principal balance of our residential securities, down from $187 million or 14.6% at December 31, 2012. The decrease in the balance of the credit reserve primarily resulted from a transfer of credit reserves to accretable unamortized discount in 2013, based on sustained improvements in the credit performance of loans underlying our securities that reduced our estimate of future losses on these loans. The decrease as a percentage was also impacted by the acquisition of $301 million of new issue Sequoia securities with minimal credit reserves. The increase in accretable unamortized discount will be recognized into income prospectively over the remaining life of the associated loans. During the year ended December 31, 2013, realized credit losses on our residential securities totaled $22 million. Volatility in income recognition for these securities is generally due to changes in prepayment rates and, to varying degrees, credit performance and interest rates.
Senior Securities
The fair value of our senior AFS securities was equal to 96% of their principal balance at December 31, 2013, while our amortized cost was equal to 88% of the principal balance. The fair value of our senior securities accounted for as trading securities was $120 million. We expect future losses will extinguish a portion of the outstanding principal of these securities, as reflected by the $24 million of credit reserves we have provided for on the $889 million principal balance of those securities.
Re-REMIC Securities
Our re-REMIC portfolio consists primarily of prime residential senior securities that were pooled and re-securitized in 2009 and 2010 by third parties to create two-tranche structures. We own support (or subordinate) securities within those structures. The fair value of our re-REMIC AFS securities was equal to 82% of the principal balance of the portfolio at December 31, 2013, while our amortized cost was equal to 48% of the principal balance. Credit losses totaled $2 million in our re-REMIC portfolio during 2013, as compared to $308 thousand of losses during 2012. We expect future losses will extinguish a portion of the outstanding principal of these securities, as reflected by the $30 million of credit reserves we have provided for on the $214 million principal balance of those securities.
Subordinate Securities
The fair value of our subordinate AFS securities was equal to 75% of the principal balance at December 31, 2013, while our amortized cost was equal to 72% of the principal balance. Credit losses totaled $19 million in our residential subordinate portfolio during 2013, as compared to $45 million of losses during 2012. We expect future losses will extinguish a portion of the outstanding principal of these securities, as reflected by the $62 million of credit reserves we have provided for on the $706 million principal balance of those securities.
MSR Portfolio
The residential investments segment includes the net income earned from, and valuation changes related to, MSRs we have recognized on our consolidated balance sheets. Our MSRs are held and managed at a taxable REIT subsidiary of ours and, typically, are directly acquired from loan originators and recognized through the transfer of loans to a third party or a Sequoia residential securitization sponsored by us that meets the GAAP criteria for sale. Although we retain the rights to service certain loans we securitize or sell, we employ a sub-servicer to perform these activities. Our receipt of MSR income is not subject to any covenants other than customary performance obligations associated with servicing residential loans. For loans that we have transferred into securitizations while maintaining the associated servicing rights, the sub-servicer we contract with to perform servicing activities may be terminated if it fails to perform under the applicable contractual terms. If the sub-servicer is terminated for a breach of contract, a
59
new sub-servicer would need to be approved by the securitization’s master servicer and assume the servicing responsibilities in accordance with the applicable pooling and servicing agreement. If a sub-servicer we contract with was to default, we would evaluate our MSR asset for impairment at that time.
The following table provides the activity for MSRs by portfolio for the year ended December 31, 2013.
Table 21 – MSR Activity by Portfolio
| Year Ended December 31, 2013 (In Thousands) |
Non-conforming | Conforming | Total MSRs | |||||||||
| Balance at beginning of period |
$ | 5,315 | $ | - | $ | 5,315 | ||||||
| MSRs retained from Sequoia securitizations |
42,921 | - | 42,921 | |||||||||
| MSRS retained from third-party loan sales |
1,090 | 52 | 1,142 | |||||||||
| Purchased MSRs |
- | 3,451 | 3,451 | |||||||||
| Market valuation adjustments due to: |
||||||||||||
| Changes in assumptions |
15,853 | (134) | 15,719 | |||||||||
| Other changes (1) |
(3,686) | (38) | (3,724) | |||||||||
|
|
|
|
|
|
|
|||||||
| Balance at End of Period |
$ | 61,493 | $ | 3,331 | $ | 64,824 | ||||||
|
|
|
|
|
|
|
|||||||
| Loans associated with MSRs (2) |
5,483,500 | 308,258 | 5,791,758 | |||||||||
| MSR values as percent of loans (3) |
1.12% | 1.08% | 1.12% | |||||||||
| (1) | Represents changes due to realization of expected cash flows. |
| (2) | Amounts represent the principal balance of loans associated with MSRs outstanding at December 31, 2013. |
| (3) | Amounts represent the carrying value of MSRs at December 31, 2013 divided by the outstanding balance of the loans associated with these MSRs. |
The following table presents the components of MSR income for the years ended December 31, 2013 and 2012.
Table 22 – MSR Income, Net
| Year Ended December 31, |
||||||||
| (In Thousands) |
2013 |
2012 |
||||||
| Servicing income, net: |
||||||||
| Income |
9,174 | 799 | ||||||
| Late charges |
65 | 8 | ||||||
| Cost of sub-servicer |
(925) | (184) | ||||||
|
|
|
|
|
|||||
| Net servicing income |
8,314 | 623 | ||||||
| Market valuation adjustments |
11,995 | (2,014) | ||||||
|
|
|
|
|
|||||
| Income from MSRs, Net |
$ | 20,309 | $ | (1,391) | ||||
|
|
|
|
|
|||||
In 2013, our income from MSR’s included $8 million of net cash income and $12 million from changes in market value. This compared to less than $1 million of net cash income and negative $2 million from changes in market value in 2012. The market value changes in 2013 were primarily due to an increase in mortgage interest rates during 2013, which resulted in a reduction of the expected prepayment speeds for our non-conforming MSRs and a resulting increase in fair value. Given the significant increase in mortgage rates during 2013, expected prepayment speeds on a significant portion of our MSR portfolio have reached a level, such that additional increases in mortgage rates would have a more limited impact on reducing prepayment speeds and potentially increasing fair value. In addition, decreases in mortgage rates could result in fair value decreases, which would negatively impact MSR income.
Provision for Income Taxes
In 2013, the provision for income taxes of $3 million in our residential investments segment primarily resulted from the addition of MSRs during 2013. As the amount of MSRs we retain or purchase in future periods increases, the corresponding provision for income taxes will increase accordingly.
60
Commercial Mortgage Banking and Investments
The following table presents the components of segment contribution for the commercial mortgage banking and investments segment for the years ended December 31, 2013 and 2012.
Table 23 – Commercial Mortgage Banking and Investments Segment Contribution
| Year Ended December 31, | ||||||||
| (In Thousands) |
2013 | 2012 | ||||||
| Interest income |
$ | 43,420 | $ | 26,048 | ||||
| Interest expense |
(12,677) | (1,123) | ||||||
|
|
|
|
|
|||||
| Net interest income |
30,743 | 24,925 | ||||||
| Provision for loan losses |
(3,288) | (3,477) | ||||||
| Mortgage banking activities, net |
23,101 | 1,149 | ||||||
| Realized gains, net |
210 | - | ||||||
| Direct operating expenses |
(9,579) | (11,085) | ||||||
| Provision for income taxes |
(3,827) | (13) | ||||||
|
|
|
|
|
|||||
| Total Segment Contribution |
$ | 37,360 | $ | 11,499 | ||||
|
|
|
|
|
|||||
The following table provides the activity of commercial loans during the years ended December 31, 2013 and 2012.
Table 24 – Commercial Loans — Activity
| Year Ended December 31, 2013 | Year Ended December 31, 2012 | |||||||||||||||
| (In Thousands) |
Held-for-Sale (1) | Held-for- Investment |
Held-for-Sale | Held-for- Investment |
||||||||||||
| Balance at beginning of period |
$ | 8,500 | $ | 304,510 | $ | - | $ | 157,726 | ||||||||
| Originations/acquisitions |
658,569 | 65,771 | 23,500 | 156,344 | ||||||||||||
| Sales |
(586,308) | (230) | (15,000) | - | ||||||||||||
| Principal repayments |
(336) | (24,083) | - | (6,765) | ||||||||||||
| Discount amortization |
- | 665 | - | 681 | ||||||||||||
| Provision for loan losses |
- | (3,289) | - | (3,476) | ||||||||||||
| Changes in fair value, net |
8,686 | - | - | - | ||||||||||||
|
|
|
|
|
|
|
|
|
|||||||||
| Balance at End of Period |
$ | 89,111 | $ | 343,344 | $ | 8,500 | $ | 304,510 | ||||||||
|
|
|
|
|
|
|
|
|
|||||||||
| (1) | We elected the fair value option for all of the senior commercial loans we originated during the second half of 2013 and anticipate electing the fair value option for all future senior commercial loans that we originate and intend to sell to third parties. All held-for-sale loans outstanding at December 31, 2013 are presented at fair value. |
At December 31, 2013, we held commercial loans with a total outstanding carrying value of $432 million, consisting primarily of our held-for-investment portfolio of mostly mezzanine loans as well as senior loans held-for-sale through our mortgage banking operations. Segment contribution from commercial mortgage banking and investments increased $26 million to $37 million in 2013, primarily due to higher income from mortgage banking activities, which resulted from significantly higher senior loan origination volumes in 2013. During 2013, we originated $805 million of senior commercial loans, including those that were table-funded by third parties, as compared to $61 million in 2012. We also originated $66 million of mezzanine loans in 2013, as compared to $156 million in 2012. Net interest income increased largely as a result of yield maintenance received upon prepayments of loans in our commercial investment portfolio as well as additional net interest earned from higher average balances of senior loans held-for-sale during 2013.
Our commercial mortgage banking activities are conducted in a taxable REIT subsidiary, and increased income from these activities resulted in higher provision for income tax in 2013. In 2013, we benefited from previously reserved deferred tax assets associated with loss carryforwards, which were utilized during the year and reduced our tax provision. Going forward, we expect to incur a higher effective tax rate on our commercial mortgage banking activities, closer to the 34% federal rate as we continue to benefit from state loss carryforwards.
61
Commercial Mortgage Banking
Our commercial mortgage banking activities increased substantially in 2013 with the origination of $805 million of senior commercial loans, including 56 loans directly funded for $659 million and four loans that were table-funded by third parties for $146 million. This compared to the origination of two senior loans for $24 million and one table funded loan for $37 million in 2012. At December 31, 2013, there were seven senior loans held-for-sale with a carrying value of $89 million.
The increased origination volume in 2013 caused our income from mortgage banking activities to increase to $23 million in 2013 from $1 million in the 2012. The following table presents the components of mortgage banking activities, net for the years ended December 31, 2013 and 2012.
Table 25 – Components of Commercial Mortgage Banking Activities, Net (1)
| Year Ended December 31, | ||||||||
| (In Thousands) |
2013 | 2012 | ||||||
| Changes in fair value of: |
||||||||
| Commercial loans, at fair value |
$ | 8,694 | $ | - | ||||
| Risk management derivatives |
3,376 | (6) | ||||||
| Net gains on commercial loan sales and originations |
11,031 | 1,155 | ||||||
|
|
|
|
|
|||||
| Total Mortgage Banking Activities, Net |
$ | 23,101 | $ | 1,149 | ||||
|
|
|
|
|
|||||
| (1) | We elected the fair value option for held-for-sale commercial senior loans originated subsequent to March 31, 2013. Amounts reported as net gains on loan sales for 2013 and 2012 relate to the sale of loans held at the lower of cost or fair value that were purchased or originated prior to the dates we began to elect the fair value option for these loans and represent the net benefit of the gross proceeds from the sale of the loans, less the carrying value of the loans and any related issuance costs. |
Income from mortgage banking activities includes $7 million of fair value changes on 38 loans sold during 2013 and $2 million from loans still held at the end of 2013, as well as $3 million of fair value changes from risk management derivatives that were paired-out during 2013 and $1 million from derivatives outstanding at the end of 2013. In 2013, we recognized $11 million of gains on the sale and originations of 16 loans. During the year ended December 31, 2012, we recognized $1 million of gains on the sale of two loans.
Commercial Investments
Our commercial investments portfolio is comprised almost entirely of mezzanine loans and at December 31, 2013, included 50 loans held-for-investment with an outstanding principal balance of $353 million, an allowance for loan losses of $7 million, and a carrying value of $343 million. During 2013, we originated 19 mezzanine loans for $66 million, as compared to 21 loans for $156 million in 2012. At December 31, 2013, this portfolio included 23 non-securitized loans with a carrying value of $86 million and 27 loans with a carrying value of $258 million that are included in our Commercial Securitization with $154 million of associated ABS long-term debt. Our securitized mezzanine portfolio decreased to $258 million at December 31, 2013, from $284 million at December 31, 2012, primarily resulting from the prepayment of three loans.
Net interest income related to our commercial investments portfolio increased to $31 million in 2013 from $25 million in 2012, primarily resulting from a higher average balance of loans outstanding in 2013, as well as $3 million in interest income related to prepayment penalties on the three loans that prepaid during the year. During 2013, we financed a portion of our unsecuritized mezzanine loans on a warehouse facility that had an average outstanding balance of $26 million during 2013 and had $49 million outstanding at the end of 2013.
During 2013, we recorded $3 million of provisions for loan losses related to the commercial investments portfolio, primarily resulting from increased balances and aging of the portfolio. Additionally, in the fourth quarter of 2013, we transferred two loans with a combined carrying value of $42 million (net of allowance for loan losses) from pass to watch list status. Both of these loans are current on all payments and we continue to believe we will receive all amounts due according to the contractual terms of the loans. However, in our judgment, certain conditions warrant specific attention going forward. Improvements in these conditions would result in the assets being upgraded back to pass status and deterioration could warrant further downgrades and potential evaluation for impairment. At December 31, 2013, we had no loans designated as impaired and did not have any charge-offs during 2013, which resulted in an allowance for loan losses of $7 million at the end of 2013.
62
On average, our commercial held-for-investment loans have a maturity of more than five years, an unlevered yield in excess of 10% per annum before credit costs, a loan-to-value ratio of 73% at origination, and a debt service coverage ratio at origination of 1.31x based on our underwritten cash flows. The following table details principal balances and other characteristics for these loans by product type at December 31, 2013.
Table 26 – Characteristics of Commercial Loans Held-for-Investment
| December 31, 2013 (Dollars In Thousands) |
Number of Loans |
Average Loan Size |
Principal Balance |
Percent of Total Principal |
Weighted Average DSCR |
Weighted Average LTV |
||||||||||||||||||
| Multi-family |
23 | $ | 5,307 | $ | 122,068 | 35% | 1.27 | 79% | ||||||||||||||||
| Hospitality |
9 | 9,243 | 83,189 | 23% | 1.38 | 62% | ||||||||||||||||||
| Office |
7 | 10,413 | 72,890 | 21% | 1.37 | 72% | ||||||||||||||||||
| Retail |
6 | 8,598 | 51,587 | 15% | 1.16 | 76% | ||||||||||||||||||
| Self-storage |
3 | 6,333 | 19,000 | 5% | 1.39 | 75% | ||||||||||||||||||
| Industrial |
2 | 2,298 | 4,597 | 1% | 1.37 | 70% | ||||||||||||||||||
|
|
|
|
|
|
|
|||||||||||||||||||
| Total |
50 | $ | 7,067 | $ | 353,331 | 100% | 1.31 | 73% | ||||||||||||||||
|
|
|
|
|
|
|
|||||||||||||||||||
The following table details principal balances for these loans by geographic concentration at December 31, 2013.
Table 27 – Geographic Concentration of Commercial Loans Held-for-Investment
| Geographic Concentration (by Principal) |
December 31, 2013 | |||
| California |
21% | |||
| New York |
19% | |||
| Florida |
10% | |||
| Michigan |
8% | |||
| Texas |
7% | |||
| Illinois |
6% | |||
| Other States (none greater than 5%) |
29% | |||
|
|
|
|||
| Total |
100% | |||
|
|
|
|||
Results of Legacy Consolidated Entities
Throughout our history we have sponsored or managed legacy investment entities, primarily Sequoia and Acacia securitization entities. Many of these entities are currently, or have been historically, recorded on our consolidated balance sheets for financial reporting purposes in accordance with GAAP. However, each of these entities is independent of Redwood and of each other and the assets and liabilities of these entities are not, respectively, owned by us or legal obligations of ours, although we are exposed to certain financial risks associated with our role as the sponsor or manager of these entities and, to the extent we hold securities issued by, or other investments in, these entities, we are exposed to the performance of these entities and the assets they hold. Collectively, we refer to these consolidated Sequoia and Acacia entities completed prior to 2012 as Legacy Consolidated Entities.
The estimated carrying value of our investments in the Legacy Consolidated Entities was $75 million, or 6% of our equity capital, at December 31, 2013. The carrying value reflects the estimated book value of our retained investments in these entities based on the difference between the consolidated assets and liabilities of the entities in the aggregate according to their GAAP carrying amounts. In 2013, cash flow generated by our investments in these entities totaled $21 million.
To show the impact of the Legacy Consolidated Entities to our consolidated financial results, we have included the following tables that present our consolidated GAAP income statements and balance sheets distributed between Legacy Consolidated Entities and the remainder of our operations, which we refer to as “at Redwood.” Results at Redwood includes all activities from our three business segments.
63
Table 28 – Consolidating Income Statement (1)
| At Redwood | Legacy Consolidated Entities | Redwood Consolidated | ||||||||||||||||||||||||||||||||||
| (In Millions) |
2013 | 2012 | 2011 | 2013 | 2012 | 2011 | 2013 | 2012 | 2011 | |||||||||||||||||||||||||||
| Interest income |
$ | 192 | $ | 139 | $ | 111 | $ | 34 | $ | 92 | $ | 106 | $ | 226 | $ | 231 | $ | 217 | ||||||||||||||||||
| Interest expense |
(55) | (25) | (13) | (26) | (96) | (86) | (81) | (121) | (99) | |||||||||||||||||||||||||||
|
|
|
|
|
|
|
|
|
|
|
|
|
|
|
|
|
|
|
|||||||||||||||||||
| Net interest income (loss) |
137 | 114 | 98 | 8 | (4) | 21 | 145 | 111 | 118 | |||||||||||||||||||||||||||
| Provision for loan losses |
(3) | (3) | (1) | (1) | (0) | (16) | (5) | (4) | (16) | |||||||||||||||||||||||||||
|
|
|
|
|
|
|
|
|
|
|
|
|
|
|
|
|
|
|
|||||||||||||||||||
| Net interest income (loss) after provision |
134 | 111 | 97 | 6 | (4) | 5 | 140 | 107 | 102 | |||||||||||||||||||||||||||
| Noninterest income (loss) |
||||||||||||||||||||||||||||||||||||
| Mortgage banking activities, net |
101 | 36 | - | - | - | - | 101 | 36 | - | |||||||||||||||||||||||||||
| MSR income (loss), net |
20 | (1) | - | - | - | - | 20 | (1) | - | |||||||||||||||||||||||||||
| Other market valuation adjustments, net |
(5) | (5) | (29) | (1) | 6 | (11) | (6) | 2 | (40) | |||||||||||||||||||||||||||
| Realized gains, net |
25 | 32 | 12 | 0 | 22 | (1) | 25 | 55 | 11 | |||||||||||||||||||||||||||
|
|
|
|
|
|
|
|
|
|
|
|
|
|
|
|
|
|
|
|||||||||||||||||||
| Total noninterest income (loss) |
141 | 63 | (18) | (0) | 29 | (11) | 141 | 91 | (29) | |||||||||||||||||||||||||||
| Operating expenses |
(85) | (65) | (47) | (0) | (0) | (0) | (85) | (65) | (48) | |||||||||||||||||||||||||||
| Other expense |
(12) | - | (12) | - | - | |||||||||||||||||||||||||||||||
| Noncontrolling interest |
- | - | - | - | - | 1 | - | - | 1 | |||||||||||||||||||||||||||
|
|
|
|
|
|
|
|
|
|
|
|
|
|
|
|
|
|
|
|||||||||||||||||||
| Net income (loss) before provision for taxes |
178 | 108 | 32 | 6 | 25 | (5) | 184 | 133 | 26 | |||||||||||||||||||||||||||
| Provision for income taxes |
(11) | (1) | (0) | - | - | - | (11) | (1) | (0) | |||||||||||||||||||||||||||
|
|
|
|
|
|
|
|
|
|
|
|
|
|
|
|
|
|
|
|||||||||||||||||||
| Net Income (Loss) |
$ | 167 | $ | 107 | $ | 32 | $ | 6 | $ | 25 | $ | (5) | $ | 173 | $ | 132 | $ | 26 | ||||||||||||||||||
|
|
|
|
|
|
|
|
|
|
|
|
|
|
|
|
|
|
|
|||||||||||||||||||
| (1) | Certain totals may not foot, due to rounding. |
Table 29 – Consolidating Balance Sheet (1)
| At Redwood | Legacy Consolidated Entities | Redwood Consolidated | ||||||||||||||||||||||
| (In Millions) |
2013 | 2012 | 2013 | 2012 | 2013 | 2012 | ||||||||||||||||||
| Residential loans |
$ | 404 | $ | 563 | $ | 1,762 | $ | 2,273 | $ | 2,166 | $ | 2,835 | ||||||||||||
| Commercial loans |
432 | 313 | - | - | 432 | 313 | ||||||||||||||||||
| Real estate securities, at fair value: |
||||||||||||||||||||||||
| Trading securities |
125 | 33 | - | - | 125 | 33 | ||||||||||||||||||
| Available-for-sale securities |
1,558 | 1,076 | - | - | 1,558 | 1,076 | ||||||||||||||||||
| Mortgage servicing rights, at fair value |
65 | 5 | - | - | 65 | 5 | ||||||||||||||||||
| Cash and cash equivalents |
173 | 81 | - | - | 173 | 81 | ||||||||||||||||||
|
|
|
|
|
|
|
|
|
|
|
|
|
|||||||||||||
| Total earning assets |
2,758 | 2,071 | 1,762 | 2,273 | 4,520 | 4,344 | ||||||||||||||||||
| Other assets |
81 | 89 | 8 | 12 | 89 | 100 | ||||||||||||||||||
|
|
|
|
|
|
|
|
|
|
|
|
|
|||||||||||||
| Total Assets |
$ | 2,838 | $ | 2,159 | $ | 1,770 | $ | 2,285 | $ | 4,609 | $ | 4,444 | ||||||||||||
|
|
|
|
|
|
|
|
|
|
|
|
|
|||||||||||||
| Short-term debt |
||||||||||||||||||||||||
| Mortgage loan warehouse debt |
$ | 185 | $ | 180 | $ | - | $ | - | $ | 185 | $ | 180 | ||||||||||||
| Security repurchase facilities |
678 | 372 | - | - | 678 | 372 | ||||||||||||||||||
| Other liabilities |
79 | 80 | 1 | 2 | 81 | 83 | ||||||||||||||||||
| Asset-backed securities issued |
249 | 336 | 1,694 | 2,193 | 1,943 | 2,530 | ||||||||||||||||||
| Long-term debt |
476 | 140 | - | - | 476 | 140 | ||||||||||||||||||
|
|
|
|
|
|
|
|
|
|
|
|
|
|||||||||||||
| Total liabilities |
1,667 | 1,108 | 1,696 | 2,196 | 3,363 | 3,304 | ||||||||||||||||||
| Stockholders’ equity
|
|
1,171
|
|
|
1,051
|
|
|
75
|
|
|
89
|
|
|
1,246
|
|
|
1,140
|
| ||||||
|
|
|
|
|
|
|
|
|
|
|
|
|
|||||||||||||
| Total Liabilities and Equity |
$ | 2,838 | $ | 2,159 | $ | 1,770 | $ | 2,285 | $ | 4,609 | $ | 4,444 | ||||||||||||
|
|
|
|
|
|
|
|
|
|
|
|
|
|||||||||||||
| (1) | Certain totals may not foot, due to rounding. |
64
Net Interest Income at Legacy Consolidated Entities
In 2013, net interest income at Legacy Consolidated Entities increased $11 million to $8 million, primarily resulting from activities related to certain entities that were deconsolidated in 2012. In the fourth quarter of 2012, we sold our economic interests in and subsequently deconsolidated all of our Acacia entities and 15 legacy Sequoia entities. As part of the deconsolidation of our Acacia entities we accelerated certain hedging expenses and recorded a one-time charge of $11 million to net interest income. In addition, in 2012 net interest income at the Acacia entities cumulatively declined by $15 million due to a decline in interest income on the collateral supporting the Acacia entities’ liabilities. These same events accounted for the decrease in net interest income from 2011 to 2012.
Net interest income at Legacy Consolidated Entities will vary from period to period and depend primarily on changes in the levels of delinquencies and loss severities for loans held-for-investment, and changes in the rates of principal repayments or the investments held at these entities.
The following table shows the impact of other MVA and impairments at our Legacy Consolidated Entities for the years ended December 31, 2013, 2012, and 2011.
Table 30 – Other MVA at Legacy Consolidated Entities
| Years Ended December 31, | ||||||||||||
| (In Thousands) |
2013 | 2012 | 2011 | |||||||||
| Commercial loans, at fair value |
$ | - | $ | 241 | $ | 616 | ||||||
| Trading securities |
- | 99,351 | (10,061) | |||||||||
| Impairment on AFS securities |
- | - | (1,647) | |||||||||
| Risk management derivatives |
- | (11,347) | (25,448) | |||||||||
| ABS issued - Acacia |
- | (81,757) | 27,313 | |||||||||
| REO |
(613) | (344) | (1,319) | |||||||||
|
|
|
|
|
|
|
|||||||
| Total Other MVA, Net |
$ | (613) | $ | 6,144 | $ | (10,546) | ||||||
|
|
|
|
|
|
|
|||||||
Loan Loss Provision at Legacy Consolidated Sequoia Entities
Each quarter we utilize a loan loss reserving methodology that has been established to provide management with a reasonable and adequate estimate of loan loss reserving needs. This methodology is disclosed in Note 3 and Note 6 to the financial statements included in Part II, Item 8 of this Annual Report on Form 10-K.
The provision for loan losses at legacy consolidated Sequoia entities (Sequoia securitizations issued prior to 2012 that we consolidate for financial reporting purposes) was $1 million in 2013, as compared to less than $1 million in 2012 and $16 million in 2011. The increase in the provision from 2012 to 2013 was primarily attributable to an increase in serious delinquencies (loans 90+ days delinquent) to $79 million at the end of 2013 from $63 million at the end of 2012. The majority of this increase was associated with previously delinquent loans being foreclosed upon, which we believe can be attributed to efforts by Servicers to resolve delinquent loans held at legacy Sequoia entities. Additionally, this amount has increased as a greater amount of loans have entered foreclosure than have been resolved, with the average age of loans in foreclosure at 26 months at the end of 2013. The increase was partially offset by a decrease in observed loss severities primarily driven by an improving economy and continued housing price increases in 2013. The 2013 provision for loan losses was less than the net charge-offs of $5 million (or 0.26% of outstanding loan balances) for the year ended December 31, 2013, and the 2012 provision for loan losses was greater than the net charge-offs of $12 million (or 0.52% of outstanding loan balances) for the year ended December 31, 2012. This resulted in a decrease of $3 million and $12 million in our allowance for loan losses for the years ended 2013 and 2012, respectively. Charge-offs were generated by $14 million and $33 million of defaulted loan principal during 2013 and 2012, respectively, for average implied loss severities of 32% and 36%, respectively.
The decrease in the provision from 2011 to 2012 was primarily attributable to the improved performance of our troubled debt restructuring loan population over the course of 2012, as well as a significant decline in delinquent balances in the overall legacy consolidated Sequoia loan population. During 2012, we also derecognized $27 million of the allowance for loan losses related to 15 Sequoia entities that were deconsolidated for financial reporting purposes in the fourth quarter of 2012. The 2012 provision for loan losses was less than the net charge-offs of $12 million (or 0.52% of outstanding loan balances) for the year ended December 31, 2012, and the 2011 provision for loan losses was greater than the net charge-offs of $11 million (or 0.35% of outstanding loan balances) for the year ended December 31, 2011. This resulted in a decrease of $12 million and $4 million in our allowance for loan losses for the years ended 2012 and 2011, respectively. Charge-offs were generated by $33 million and $34 million of defaulted loan principal during 2012 and 2011, respectively, for average implied loss severities of 36% and 33%, respectively.
65
During 2013, the allowance for loan losses decreased to $25 million (or 1.44% of outstanding residential loans held-for-investment balances), from $28 million (or 1.25% of outstanding residential loans held-for-investment balances) at December 31, 2012. Serious delinquencies on loans held at consolidated Sequoia entities (90+ days delinquent) increased to $79 million (or 4.45% of outstanding loan balances) at December 31, 2013, from $63 million (or 2.75% of outstanding loan balances) at December 31, 2012. Loans originated in Florida, New Jersey, and Nevada accounted for 18% of total loans and 36% of the serious delinquent loan balance held by Sequoia entities at December 31, 2013.
At December 31, 2013, we estimate that there was one legacy consolidated Sequoia entity for which the carrying value of the entity’s liabilities exceeded the corresponding carrying value of the entity’s assets. This is primarily attributable to the continued building of loan loss allowances in accordance with GAAP, resulting in lower asset carrying values. The aggregate estimated net assets (or equity) at this consolidated entity were less than negative $1 million at December 31, 2013, an amount we expect to reverse through positive adjustments to earnings in future periods as the entity is retired or deconsolidated for financial reporting purposes.
Other MVA at Legacy Consolidated Entities
We applied the fair value option provided under GAAP to account for the assets (e.g., loans and securities) and liabilities (e.g., ABS issued) at the Acacia entities that were consolidated prior to December 31, 2012. Accordingly, changes in the fair value of these assets and liabilities were recorded in the consolidated statements of income as a component of other MVA in 2012 and 2011. Derivative assets and liabilities at Acacia securitization entities are accounted for as trading instruments with all changes in the fair value of these assets and liabilities recorded as other market valuation adjustments through our consolidated statements of income. Due to the deconsolidation of the Acacia entities during the fourth quarter of 2012, we reclassified $11 million of unrealized losses on derivatives to interest expense as discussed above. As of December 31, 2012, we have no unrealized losses related to Acacia entities. As we deconsolidated all Acacia entities in the fourth quarter of 2012, there will not be market valuation adjustments related to these items going forward.
Real Estate Loans at Legacy Consolidated Sequoia Entities
The following table provides details of residential loan activity at Legacy consolidated Sequoia securitization entities for the years ended December 31, 2013 and 2012.
Table 31 – Residential Loans at Legacy Consolidated Sequoia Entities — Activity
| Year Ended December 31, | ||||||||
| (In Thousands) |
2013 | 2012 | ||||||
| Balance at beginning of period |
$ | 2,272,812 | $ | 3,799,649 | ||||
| Principal repayments |
(500,151) | (558,170) | ||||||
| Charge-offs, net |
4,526 | 11,903 | ||||||
| Premium amortization |
(6,456) | (6,301) | ||||||
| Transfers to REO |
(7,116) | (18,875) | ||||||
| Provision for loan losses |
(1,448) | (171) | ||||||
| Deconsolidation adjustment |
- | (955,223) | ||||||
|
|
|
|
|
|||||
| Balance at End of Period |
$ | 1,762,167 | $ | 2,272,812 | ||||
|
|
|
|
|
|||||
66
Loan Characteristics
The following table highlights unpaid principal balances for loans at legacy consolidated Sequoia entities by product type at December 31, 2013. First lien adjustable rate mortgage (ARM) and hybrid loans comprise 92% of the consolidated Sequoia loan portfolio and were primarily originated in 2005 or prior. Conversely, fixed-rate loans, which make up 8% of the portfolio, were primarily originated in 2009 or later. Of the $63 million of hybrid loans held at legacy consolidated Sequoia securitization entities at December 31, 2013, $33 million (or 52%) had reset as of December 31, 2013, and now act as ARM loans.
Table 32 – Loan Characteristics at Legacy Consolidated Sequoia Entities
| December 31, 2013 (Dollars In Thousands) |
Principal Balance | Percent of Total | ||||||
| First Lien |
||||||||
| ARM |
$ | 1,541,166 | 87.03% | |||||
| Fixed |
150,279 | 8.49% | ||||||
| Hybrid (years to reset) |
||||||||
| Reset |
32,688 | 1.85% | ||||||
| 0-4 |
13,522 | 0.76% | ||||||
| 5-8 |
16,337 | 0.92% | ||||||
| Second Lien |
||||||||
| ARM |
16,811 | 0.95% | ||||||
|
|
|
|
|
|||||
| Total Outstanding Principal |
$ | 1,770,803 | 100.00% | |||||
|
|
|
|
|
|||||
For outstanding loans at legacy Sequoia entities consolidated by us at December 31, 2013, the weighted average FICO score (at origination) of borrowers backing these loans was 733 and the weighted average original LTV ratio of Sequoia loans was 66%.
The following chart presents the weighted average prepayment speeds of loans held at legacy consolidated Sequoia securitization entities still held at December 31, 2013 over the past two years.
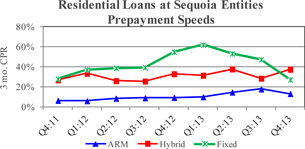
The majority of hybrid loans and all of the fixed-rate loans at the legacy consolidated Sequoia entities were securitized since 2010. Prepayment speeds on our fixed-rate loans continued to decline during the fourth quarter of 2013 reflecting mortgage rates that began to rise in the second quarter of 2013. At December 31, 2013, fixed-rate loans had a weighted average coupon of 4.64%. At December 31, 2013, LIBOR ARM loans had a weighted average coupon of 1.62% and hybrid loans had a weighted average coupon of 3.56% at legacy consolidated Sequoia entities.
Real Estate Securities at Legacy Consolidated Entities
In the fourth quarter of 2012, we derecognized the associated assets and liabilities of the Acacia entities as a result of a GAAP consolidation analysis performed upon the sale of our investments in these entities during the fourth quarter of 2012. During the second quarter of 2011, all remaining securities at a consolidated fund were sold. We recognized $2 million of OTTI on these securities in the year ended December 31, 2011.
67
Derivative Financial Instruments at Acacia Securitization Entities
Concurrent with the above-described derecognition of the Acacia assets and liabilities, we accelerated our amortization of net unrealized losses on interest rate agreements and reclassified $11 million to interest expense in the fourth quarter of 2012. For the years ended December 31, 2012 and 2011, we reclassified $15 million and $4 million, respectively, of unrealized losses on these derivatives to interest expense.
Taxable Income
The following table summarizes our taxable income (loss) and distributions to shareholders for the years ended December 31, 2013, 2012, and 2011. For each of these years, we had no undistributed REIT taxable income.
Table 33 – Taxable Income
| Year Ended December 31, | ||||||||||||
| (In Thousands) |
2013 est. (1) | 2012 | 2011 | |||||||||
| REIT taxable income |
$ | 76,169 | $ | 60,542 | $ | 19,543 | ||||||
| Taxable REIT subsidiary income (loss) |
17,149 | (7,627) | (9,721) | |||||||||
|
|
|
|
|
|
|
|||||||
| Total Taxable Income |
$ | 93,318 | $ | 52,915 | $ | 9,822 | ||||||
|
|
|
|
|
|
|
|||||||
| Distributions to shareholders |
$ | 92,005 | $ | 80,134 | $ | 78,382 | ||||||
| (1) | Our tax results for the year ended December 31, 2013 are estimates until we file tax returns for this year. |
Our estimated total taxable income for the year ended December 31, 2013, was $93 million ($1.14 per share) and included $13 million in realized credit losses on investments. This compared to taxable income for the year ended December 31, 2012, of $53 million ($0.66 per share) and included $26 million in realized credit losses on investments. Taxable income for the year ended December 31, 2011, was $10 million ($0.12 per share) that included $58 million in credit losses.
For the year ended December 31, 2013, we recorded a tax provision of $11 million for GAAP primarily related to mortgage banking activities at our TRS. $7 million of the tax provision represents a future tax obligation while only $4 million represents a current corporate level tax liability that will be paid for 2013. We are currently benefiting from favorable timing differences between when income associated with our mortgage banking activities is recognized for GAAP purposes versus when it is recognized for tax purposes, thus deferring a significant portion of the tax liability on that income. In addition, the 2013 tax provision was reduced from the statutory tax rate largely due to the release of valuation allowance recorded in prior years against our deferred tax assets. It is anticipated that the tax provision recorded for mortgage banking income in future periods will be closer to the federal statutory tax rate. The mortgage banking income is not expected to be excess inclusion income, was not earned at the REIT, and will not affect the tax characterization of our 2013 dividends. Consistent with prior periods, we did not book a material tax provision associated with taxable income generated at our REIT.
68
Taxable Income Distribution Requirement
As a REIT, we are required to distribute at least 90% of our taxable income, after the application of federal net operating loss carryforwards (“NOLs”), to our shareholders. For 2013, our estimated REIT taxable income of $76 million exceeded our available NOLs by $6 million, and therefore our minimum dividend distribution requirement was $5 million. The following table details our federal NOLs and capital loss carryforwards available as of December 31, 2013.
Table 34 – Federal Net Operating and Capital Loss Carryforwards
| Loss Carryforward Expiration by Period | ||||||||||||||||||||
| (In Thousands) |
1 to 3 Years |
3 to 5 Years |
5 to 15 years Years |
After 15 Years |
Total | |||||||||||||||
| REIT Loss Carryforwards |
||||||||||||||||||||
| Net operating loss |
$ | - | $ | - | $ | - | $ | (69,819) | $ | (69,819) | ||||||||||
| Capital loss |
(92,886) | (202,262) | - | - | (295,148) | |||||||||||||||
|
|
|
|
|
|
|
|
|
|
|
|||||||||||
| Total REIT Loss Carryforwards |
$ | (92,886) | $ | (202,262) | $ | - | $ | (69,819) | $ | (364,967) | ||||||||||
|
|
|
|
|
|
|
|
|
|
|
|||||||||||
| TRS Loss Carryforwards |
||||||||||||||||||||
| Net operating loss |
$ | - | $ | - | $ | - | $ | (30,160) | $ | (30,160) | ||||||||||
| Capital loss |
(20,308) | - | - | - | (20,308) | |||||||||||||||
|
|
|
|
|
|
|
|
|
|
|
|||||||||||
| Total TRS Loss Carryforwards |
$ | (20,308) | $ | - | $ | - | $ | (30,160) | $ | (50,468) | ||||||||||
|
|
|
|
|
|
|
|
|
|
|
|||||||||||
As of December 31, 2013, we maintained $70 million of NOLs at the REIT level. In order to utilize these carryforwards, taxable income must exceed our dividend distributions. During 2013, we distributed $92 million to shareholders and exceeded our estimated taxable income of $76 million. We do not expect to report any REIT taxable income on our 2013 federal income tax return after the application of a dividends paid deduction. As a result, we do not expect any of our federal NOLs at the REIT level to be utilized in 2013. Federal NOLs at the REIT level do not expire until 2029. Federal NOLs at the TRS level expire between 2030 and 2032.
Federal capital loss carryforwards of $295 million and $20 million at the REIT and TRS, respectively, will expire between 2015 and 2017. In order to utilize these carryforwards, the respective entities must recognize capital gains in excess of capital losses before the expiration dates. Utilization of capital loss carryforwards by the REIT reduces the REIT’s taxable income and distribution requirement. Capital loss carryforwards do not reduce the taxability of dividends to shareholders.
Tax Characteristics of Distributions to Shareholders
For the year ended December 31, 2013, we declared and distributed four regular quarterly dividends totaling $1.12 per share. Under the federal income tax rules applicable to REITs, the taxable portion of any distribution to shareholders in excess of the minimum requirement is determined by i) taxable income of the REIT, exclusive of the dividends paid deduction and NOLs; and, ii) net capital gains recognized by the REIT, exclusive of capital loss carryforwards.
Our 2013 dividend distributions are expected to be characterized for income tax purposes as 89% ordinary income and 11% return of capital. Thus, we expect approximately $82 million of our 2013 dividend distributions to be characterized as ordinary income to shareholders, as this amount represents the taxable income and net capital gains we generated in 2013 prior to the application of a dividends paid deduction, NOLs, and capital loss carryforwards in accordance with federal income tax rules. Of the $82 million, $6 million is expected to be attributable to net capital gains. The remaining $10 million of dividend distributions are expected to be characterized as a return of capital to shareholders and are generally not taxable. A distribution of capital reduces the tax basis for common shares held by a shareholder at each quarterly distribution date (provided the distribution does not exceed a shareholder’s tax basis in our common shares). While the REIT earned net capital gains in 2013, none of the 2013 dividend distributions are expected to be characterized as long-term capital gains. Under the federal income tax rules applicable to REITs, capital loss carryforwards offset the 2013 capital gains when determining the characterization of ordinary versus long-term capital gain dividend distributions.
In November 2013, our board of directors announced its intention to pay a regular dividend of $0.28 per share each quarter in 2014.
69
Differences between Estimated Total Taxable Income and GAAP Income
Differences between estimated taxable income and GAAP income are largely due to the following: (i) we cannot establish loss reserves for future anticipated events for tax but can for GAAP as realized credit losses are expensed when incurred for tax and these losses are anticipated through lower yields on assets or through loss provisions for GAAP; (ii) the timing, and possibly the amount, of some expenses (e.g., compensation expenses) are different for tax than for GAAP; (iii) since amortization and impairments differ for tax and GAAP, the tax and GAAP gains and losses on sales may differ, resulting in differences in realized gains on sale; (iv) at the REIT and certain TRS entities, unrealized gains and losses on market valuation adjustments of securities and derivatives are not recognized for tax until the instrument is sold or extinguished; (v) for tax, basis may not be assigned to mortgage servicing rights retained when whole loans are sold resulting in lower tax gain on sale, and, (vi) for tax, we do not consolidate noncontrolling interests or securitization entities as we do under GAAP. As a result of these differences in accounting, our estimated taxable income can vary significantly from our GAAP income during certain reporting periods.
The tax basis in assets and liabilities at the REIT was $2.5 billion and $1.5 billion, respectively, at December 31, 2013. The GAAP basis in assets and liabilities at the REIT was $4.2 billion and $3.0 billion, respectively, at December 31, 2013. The primary difference in both the tax and GAAP assets and liabilities is attributable to securitization entities that are consolidated for GAAP reporting purposes but not for tax purposes.
The tables below reconcile our estimated total taxable income to our GAAP income for the years ended December 31, 2013, 2012, and 2011.
Table 35 – Differences between Estimated Total Taxable Income and GAAP Net Income
| Year Ended December 31, 2013 | ||||||||||||
| (In Thousands, Except per Share Data) |
Tax (Est.) | GAAP | Differences | |||||||||
| Interest income |
$ | 208,627 | $ | 226,156 | $ | (17,529) | ||||||
| Interest expense |
(55,470) | (80,971) | 25,501 | |||||||||
|
|
|
|
|
|
|
|||||||
| Net interest income |
153,157 | 145,185 | 7,972 | |||||||||
| Provision for loan losses |
- | (4,737) | 4,737 | |||||||||
| Realized credit losses |
(13,068) | - | (13,068) | |||||||||
| Other market valuation adjustments, net |
- | (5,709) | 5,709 | |||||||||
| Mortgage banking activities, net |
17,708 | 100,676 | (82,968) | |||||||||
| MSR income, net |
8,218 | 20,309 | (12,091) | |||||||||
| Operating expenses |
(72,406) | (84,789) | 12,383 | |||||||||
| Other expense |
- | (12,000) | 12,000 | |||||||||
| Realized gains, net |
- | 25,259 | (25,259) | |||||||||
| Provision for income taxes |
(291) | (10,948) | 10,657 | |||||||||
|
|
|
|
|
|
|
|||||||
| Net Income |
$ | 93,318 | $ | 173,246 | $ | (79,928) | ||||||
|
|
|
|
|
|
|
|||||||
| Income per share |
$ | 1.14 | $ | 1.94 | $ | (0.80) | ||||||
70
| Year Ended December 31, 2012 | ||||||||||||
| (In Thousands, Except per Share Data) |
Tax | GAAP | Differences | |||||||||
| Interest income |
$ | 160,737 | $ | 231,384 | $ | (70,647) | ||||||
| Interest expense |
(26,187) | (120,705) | 94,518 | |||||||||
|
|
|
|
|
|
|
|||||||
| Net interest income |
134,550 | 110,679 | 23,871 | |||||||||
| Provision for loan losses |
- | (3,648) | 3,648 | |||||||||
| Realized credit losses |
(25,609) | - | (25,609) | |||||||||
| Other market valuation adjustments, net |
- | 1,539 | (1,539) | |||||||||
| Mortgage banking activities, net |
(401) | 36,319 | (36,720) | |||||||||
| MSR income, net |
623 | (1,391) | 2,014 | |||||||||
| Operating expenses |
(56,156) | (65,359) | 9,203 | |||||||||
| Realized gains, net |
- | 54,921 | (54,921) | |||||||||
| Provision for income taxes |
(93) | (1,291) | 1,198 | |||||||||
|
|
|
|
|
|
|
|||||||
| Net Income |
$ | 52,914 | $ | 131,769 | $ | (78,855) | ||||||
|
|
|
|
|
|
|
|||||||
| Income per share |
$ | 0.66 | $ | 1.59 | $ | (0.93) | ||||||
| Year Ended December 31, 2011 | ||||||||||||
| (In Thousands, Except per Share Data) |
Tax | GAAP | Differences | |||||||||
| Interest income |
$ | 128,334 | $ | 217,179 | $ | (88,845) | ||||||
| Interest expense |
(15,804) | (98,978) | 83,174 | |||||||||
|
|
|
|
|
|
|
|||||||
| Net interest income |
112,530 | 118,201 | (5,671) | |||||||||
| Provision for loan losses |
- | (16,151) | 16,151 | |||||||||
| Realized credit losses |
(57,526) | - | (57,526) | |||||||||
| Other market valuation adjustments, net |
- | (40,017) | 40,017 | |||||||||
| Mortgage banking activities, net |
- | - | - | |||||||||
| Operating expenses |
(45,166) | (47,741) | 2,575 | |||||||||
| Realized gains, net |
- | 10,946 | (10,946) | |||||||||
| Provision for income taxes |
(16) | (42) | 26 | |||||||||
| Less: Net loss attributable to noncontrolling interest |
- | (1,147) | 1,147 | |||||||||
|
|
|
|
|
|
|
|||||||
| Net Income |
$ | 9,822 | $ | 26,343 | $ | (16,521) | ||||||
|
|
|
|
|
|
|
|||||||
| Income per share |
$ | 0.12 | $ | 0.31 | $ | (0.19) | ||||||
Potential Taxable Income Volatility
We expect period-to-period estimated taxable income volatility for a variety of reasons, including those described below.
Credit Losses on Securities and Loans
To determine estimated taxable income, we are generally not permitted to anticipate, or reserve for, credit losses on investments which are generally purchased at a discount. For tax purposes, we accrue the entire purchase discount on a security into taxable income over the expected life of the security. Estimated taxable income is reduced when actual credit losses occur. For GAAP purposes, we establish a credit reserve and only accrete a portion of the purchase discount, if any, into income and write-down securities that become impaired. Our income recognition is therefore faster for tax as compared to GAAP, especially in the early years of owning a security (when there are generally few credit losses). At December 31, 2013, the cumulative difference between the GAAP and tax amortized cost basis of our residential subordinate securities (excluding our investments in our securitization entities) was $32 million.
As we have no credit reserves or allowances for tax, any future credit losses on securities or loans will have a more significant impact on tax earnings than on GAAP earnings and may create significant taxable income volatility to the extent the level of credit losses fluctuates during reporting periods. During years ended December 31, 2013, 2012, and 2011, we realized $13 million, $26 million, and $58 million, respectively, of credit losses on securities for tax that we had previously provisioned for under GAAP. We anticipate that credit losses will continue to be a significant factor for determining 2013 taxable income. Credit losses are based on our tax basis, which differs materially from our basis for GAAP purposes. We anticipate an additional $59 million of credit losses for tax
71
on securities, based on our projection of principal balance losses and assuming a similar tax basis as we have recently experienced, although the timing of actual losses is difficult to accurately project. At December 31, 2013, for GAAP we had a designated credit reserve of $117 million on our securities, and an allowance for loan losses of $33 million for our consolidated residential and commercial loans.
Recognition of Gains and Losses on Sale
Since amortization and impairments on assets differ for tax and GAAP, the tax and GAAP basis on assets sold or called may differ, resulting in differences in gains and losses on sale or call. In addition, gains realized for tax may be offset by prior capital losses and, thus, not affect taxable income. At December 31, 2013, the REIT had an estimated $295 million in capital loss carryforwards ($3.58 per share) that can be used to offset future capital gains over the next one to four years. Since our intention is to generally make long-term investments, it is difficult to anticipate when sales may occur and, thus, when or whether we might exhaust these capital loss carryforwards. At December 31, 2013, we had an estimated $20 million in capital loss carryforwards at the TRS level. We anticipate selling most of our portfolio of appreciated IO securities within the capital loss carryforward period. Consequently, although not certain, it is likely that the TRS will benefit from the use of the capital loss carryforwards.
Prepayments on Securities
As part of our investment in Sequoia securitization entities, we have retained IOs at the time they were issued. Our tax basis in these securities was $83 million at December 31, 2013, which includes a tax basis of $73 million for IOs retained from securitizations completed in 2010 and later. The return on IOs is sensitive to prepayments and, to the extent prepayments vary period to period, income from these IOs will vary. Typically, fast prepayments reduce yields and slow prepayments increase yields. We are not permitted to recognize a negative yield under tax accounting rules, so during periods of fast prepayments our periodic premium expense for tax purposes can be relatively low and the tax cost basis for these securities may not be significantly reduced. In periods prior to 2008, we experienced fast prepayments on the loans underlying our IOs. More recently, prepayments on loans owned at consolidated Sequoia entities issued prior to 2010 have been slow, and our tax basis is now below the fair values for these IOs in the aggregate. Most of the Sequoia securitizations consolidated by us are callable or will become callable over the next two years. If a Sequoia securitization is called, the remaining tax basis in the IO is expensed, creating an ordinary loss at the call date.
Prepayments also affect the taxable income recognition on other securities we own. We are required to use particular prepayment assumptions for the remaining lives of each security. As actual prepayment speeds vary, the yield we recognize for tax purposes will be adjusted accordingly. Thus, to the extent prepayments differ from our long-term assumptions or vary from period to period, the yield recognized will also vary and this difference could be material for a specific security.
Compensation Expense
The total tax expense for equity award compensation is dependent upon varying factors such as the timing of payments of dividend equivalent rights, the exercise of stock options, the distribution of deferred stock units and preferred stock units, and the cash deferrals to and withdrawals from our Executive Deferred Compensation Plan. For GAAP purposes, the total expense associated with an equity award is determined at the award date and is recognized over the vesting period. For tax, the total expense is recognized at the date of distribution or exercise, not the award date. In addition, some compensation may not be deductible for tax if it exceeds certain levels and is not performance-based. Thus, the total amount of compensation expense, as well as the timing, could be significantly different for tax than for GAAP.
As an example, for GAAP we expense the grant date fair value of performance stock units (“PSUs”) granted over the vesting term of those PSUs (regardless of the degree to which the performance conditions for vesting are ultimately satisfied, if at all), whereas for tax the value of the PSUs that actually vest in accordance with the performance conditions of those awards and are subsequently distributed to the award recipient is recorded as an expense on the date of distribution. If no PSUs under a particular grant ultimately vest, due to the failure to satisfy the performance conditions, no tax expense will be recorded for those PSUs, even though we would have already recorded expense for GAAP equal to the grant date fair value of the PSU awards. Conversely, if performance is such that a number of shares of common stock equal to 200% of the PSU award ultimately vest and are delivered to the award recipient, expense for tax will equal the common stock value on the date of distribution of 200% of the number of PSUs originally granted. This expense for tax could significantly exceed the recorded expense for GAAP.
In addition, since the decision to exercise options or distribute deferred stock units, performance stock units, or cash out of the Executive Deferred Compensation Plan is an employee’s, it can be difficult to project when the tax expense will occur.
72
Mortgage Servicing Rights
For GAAP purposes, we recognize MSRs through the acquisition of servicing rights from third parties or through the retention of MSRs associated with residential loans that we have acquired and subsequently transferred to non-consolidated securitization entities or to third parties. For tax purposes, basis in our MSR assets is recognized through the acquisition of servicing rights from third parties, or to the extent that the MSR entitles us to receive a servicing fee that is in excess of a safe harbor amount prescribed by the Internal Revenue Service. Tax basis in our MSR assets is not recognized when MSRs are retained from transfers of loans to non-consolidated securitization entities or to third parties thereby creating a temporary GAAP to tax difference on the gain from sale. For the year ended December 31, 2013, we purchased $3 million of MSRs on conforming loans that were recognized for tax purposes. No other tax basis in our MSR assets has been recognized to date.
For GAAP purposes, mortgage servicing fee income, net of servicing expense and changes in the estimated fair value of our MSRs, is recognized on our consolidated income statement over the life of the MSR asset. For tax purposes, only mortgage servicing fee income, net of servicing expense is recognized as taxable income. Any MSR where basis is recognized for tax purposes through acquisition is amortized as a tax expense over a finite life.
73
LIQUIDITY AND CAPITAL RESOURCES
Summary
Our principal sources of cash consist of borrowings under mortgage loan warehouse facilities and securities repurchase agreements, payments of principal and interest we receive on our securities portfolio and commercial investments portfolio, cash generated from our operating results, and proceeds from capital market transactions. Our most significant uses of cash are to purchase mortgage loans for our residential and commercial conduits, to repay principal and interest on our warehouse facilities, repurchase agreements, and long-term debt, to purchase investment securities, to make dividend payments on our capital stock, and to fund our operations.
We currently expect that our available capital and liquidity is sufficient to fund our business and investment objectives for most or all of 2014, in part because we believe we can source capital internally by selling or financing existing investments if needed to fund higher yielding investment opportunities. To the extent our expectation changes and we need external capital to fund our investment and business activities, we would consider the issuance of debt or equity securities under the shelf registration statement we currently have on file with the SEC, or the issuance of similar or other types of securities in public or private offerings, including, the possibility of raising dedicated capital for our commercial platform. There can be no assurance, however, that we will be able to raise additional capital at any particular time or on any particular terms.
At December 31, 2013, our total capital was $1.67 billion, including $1.25 billion in stockholders’ equity and $427 million of long-term debt. At December 31, 2013, we held $173 million of cash and cash equivalents and we estimated our investment capacity (defined as the amount of capital we have readily available for long-term investments) at approximately $130 million.
In the ordinary course of our business, we use short-term recourse debt through several different types of borrowing facilities and use cash borrowings under these facilities to, among other things, fund the acquisition of residential loans and the origination of commercial loans (including those we acquire and originate in anticipation of securitization), finance investments in securities and other investments, and otherwise fund our business and operations. At December 31, 2013, we had five residential loan warehouse facilities with a total outstanding debt balance of $185 million (secured by residential loans with an aggregate fair value of $205 million) and a total borrowing limit of $1.40 billion. We also had, at December 31, 2013, a $100 million short-term commercial loan warehouse facility with no outstanding balance and a long-term commercial loan warehouse facility with an outstanding balance of $49 million and a total borrowing limit of $150 million. In addition, at December 31, 2013, we had an aggregate outstanding short-term debt balance of $678 million under seven securities repurchase facilities, which were secured by securities with a fair market value of $839 million. We also had a secured line of credit with no outstanding debt balance and a total borrowing limit of $10 million (secured by securities with a fair market value in excess of $10 million) at December 31, 2013.
We are subject to risks relating to our liquidity and capital resources, including risks relating to incurring short-term debt under residential and commercial loan warehouse facilities, securities repurchase facilities, and other short-term debt facilities and other risks relating to our use of derivatives. A further discussion of these risks is set forth below under the heading “Risks Relating to Short-Term Debt Incurred Under Residential Mortgage Loan Warehouse Facilities, Securities Repurchase Facilities, and Other Short-Term Debt Facilities; and Risks Relating to Debt Incurred Under Commercial Debt Investment Repurchase Facilities” and in Part I, Item 1A – Risk Factors of this Annual Report on Form 10-K.
Cash Flows and Liquidity for the Year Ended December 31, 2013
Cash flow from residential and commercial mortgage banking activities and other investments can be volatile from quarter to quarter depending on many factors, including the timing and amount of loan and securities acquisitions and sales, the profitability of mortgage banking activities, as well as changes in credit losses, prepayments, and interest rates. Therefore, cash flows generated in the current period is not necessarily reflective of the long-term cash flows we will receive from these investments or activities.
Cash Flows from Operating Activities
Cash flows from operating activities were negative $222 million in 2013. This amount was negative due to the inclusion of the net cash utilized during the period from the purchase and sale of residential and commercial mortgage loans associated with our mortgage banking activities. Purchases of loans are financed to a large extent with short-term debt, for which changes in cash are included as a component of financing activities. Additionally, net cash utilized from the purchase and sale of loans during 2013 partially results from a timing difference as we had $493 million of residential and commercial loans held-for-sale at the end of 2013. Excluding cash flows from the purchase and sale of loans, cash flows from operating activities were $138 million in 2013.
74
In the fourth quarter of 2013, we recorded a non-cash charge to other expense to establish a legal reserve related to previously disclosed litigation regarding certain legacy Sequoia securitizations. The ultimate resolution of these matters could result in cash payments that equal or exceed this amount. The timing of any resolution cannot be determined with certainty.
Cash Flows from Investing Activities
Although we generally intend to hold our investment securities as long-term investments, we may sell certain of these securities in order to manage our interest rate risk and liquidity needs, to meet other operating objectives, and to adapt to market conditions. We cannot predict the timing and impact of future sales of investment securities, if any. Because many of our investment securities are financed through repurchase agreements, a significant portion of the proceeds from any sales of our investment securities would generally be used to repay balances under these financing sources. Similarly, all or a significant portion of cash flows from prepayments and scheduled amortization in respect of our investment securities would also generally be used to repay balances under these financing sources.
Cash Flows from Financing Activities
During 2013, we issued $287.5 million of convertible senior notes, as described below under the heading “Long-term Debt.”
During 2013, we paid $94 million of cash dividends on our common stock, representing a dividend of $0.28 per share, per quarter. In accordance with the terms of outstanding deferred stock units, which are stock-based compensation awards, each time we declare and pay a dividend on our common stock we are required to make a dividend equivalent payment in that same per share amount on each outstanding deferred stock unit.
In November 2013, our Board of Directors announced its intention to pay a regular dividend of $0.28 per share per quarter in 2014.
Short-Term Debt
At December 31, 2013, we had $863 million of short-term debt outstanding. For the year ended December 31, 2013, the highest balance of our short-term debt outstanding was $1.45 billion.
Long-Term Debt
Commercial Borrowings
At December 31, 2013, we had one commercial loan warehouse facility with an outstanding balance of $49 million and a total borrowing limit of $150 million.
Convertible Notes
In March 2013, we issued $287.5 million principal amount of 4.625% convertible senior notes due 2018. After deducting the underwriting discount and issuance costs, we received approximately $279 million of net proceeds. Including amortization of deferred issuance costs, the interest expense yield on our convertibles notes was 5.53% for the year ended December 31, 2013. At December 31, 2013, the accrued interest payable balance on this debt was $3 million.
Other Long-term Debt
Other long-term debt consists of $100 million and $50 million of trust preferred securities and subordinated notes, respectively issued by us in 2006 and 2007. This debt requires quarterly distributions at a floating rate equal to three-month LIBOR plus 2.25% until the notes are redeemed in whole. Beginning in the first quarter of 2011, we entered into interest rate swaps with aggregate notional values currently totaling $140 million to hedge the variability in this long-term debt interest expense, fixing our gross interest expense yield at 6.75%. These swaps are accounted for as cash flow hedges with all interest income recorded as a component of net interest income and other valuation changes recorded as a component of equity.
75
Asset-Backed Securities
In July 2011, Redwood transferred $365 million of residential securities into the Residential Resecuritization in connection with the issuance of $245 million of ABS by the Residential Resecuritization to third parties. At December 31, 2013, there were $263 million of securities owned at the Residential Resecuritization, which were funded with $95 million of ABS issued.
In November 2012, Redwood transferred $291 million (principal balance) of commercial loans into the Commercial Securitization in connection with the issuance of $172 million of ABS by the Commercial Securitization to third parties. At December 31, 2013, there were $258 million (carrying value) of commercial loans owned at the Commercial Securitization, which were funded with $154 million of ABS issued.
At December 31, 2013, there were $1.77 billion of loans owned at Sequoia securitization entities, which were funded with $1.69 billion of ABS issued at Sequoia entities. These loans and ABS issued are reported at their unpaid principal balances net of any unamortized premium or discount.
During the fourth quarter of 2012, we sold our remaining interests in the Acacia entities and derecognized the associated assets and liabilities.
Ratio of Earnings to Fixed Charges
The ratio of earnings to fixed charges represents the number of times “fixed charges” are covered by “earnings.” “Fixed charges” consist of interest on outstanding asset-backed securities issued and debt, as well as, amortization of debt discount and expense. “Earnings” consist of consolidated income before income taxes and fixed charges.
The following table presents our ratio of earnings to fixed charges for the each of the years ended December 31, 2013, 2012, 2011, 2010, and 2009.
Table 36 Ratio of Earnings to Fixed Charges
| Year Ended December 31, | ||||||||||
| 2013 | 2012 | 2011 | 2010 | 2009 | ||||||
| Ratio of earnings to fixed charges |
3.90 x | 2.20 x | 1.26 x | 2.32 x | 1.26 x | |||||
Risks Relating to Short-Term Debt Incurred Under Residential Mortgage Loan Warehouse Facilities, Securities Repurchase Facilities, and Other Short-Term Debt Facilities; and Risks Relating to Debt Incurred Under Commercial Debt Investment Repurchase Facilities
As described above under the heading “Results of Operations – Redwood (Parent),” in the ordinary course of our business, we use debt financing obtained through several different types of borrowing facilities to, among other things, finance the acquisition of residential mortgage loans we acquire (including those we acquire in anticipation of sale or securitization), finance commercial mortgage loans we originate (including those we originate in anticipation of sale or securitization), finance the other commercial debt investments we originate and acquire, and finance investments in securities and other investments. We may also use short-term borrowings to fund other aspects of our business and operations.
Residential Loan Warehouse Facilities. One source of our short-term debt financing is secured borrowings under residential loan warehouse facilities that are in place with five different financial institution counterparties. Under these five warehouse facilities, we had an aggregate borrowing limit of $1.4 billion at December 31, 2013; however, these facilities are uncommitted, which means that any request we make to borrow funds under these facilities may be declined for any reason, even if at the time of the borrowing request we have then-outstanding borrowings that are less than the borrowing limits under these facilities. Short-term financing for residential mortgage loans is obtained under these facilities by our transfer of mortgage loans to the counterparty in exchange for cash proceeds (in an amount less than 100% of the principal amount of the transferred mortgage loans), and our covenant to reacquire those loans from the counterparty for the same amount plus a financing charge.
In order to obtain financing for a residential loan under these facilities, the loan must initially (and continuously while the financing remains outstanding) meet certain eligibility criteria, including, without limitation, that the loan is not in a delinquent status.
76
In addition, under these warehouse facilities, residential loans can only be financed for a maximum period, which period would not generally exceed 364 days. We generally intend to repay the short-term financing of a loan under one of these facilities at or prior to the expiration of that financing with the proceeds of a securitization or other sale of that loan, through the proceeds of other short-term borrowings, or with other equity or long-term debt capital. While a residential loan is financed under a warehouse facility, to the extent the market value of the loan declines (which market value is generally determined by the counterparty under the facility), we are required to either immediately reacquire the loan or meet a margin requirement to pledge additional collateral, such as cash or additional residential loans, in an amount at least equal to the decline in value. See further discussion below under the heading “–Margin Call Provisions Associated with Short-Term Debt and Other Debt Financing.”
Because these warehouse facilities are uncommitted, at any given time we may not be able to obtain additional financing under them when we need it, exposing us to, among other things, liquidity risks of the types described in Part I, Item 1A of this Annual Report on Form 10-K, under the heading “Risk Factors,” and in Part II, Item 7A of this Annual Report on Form 10-K under the heading “Market Risks.” In addition, with respect to residential loans that at any given time are already being financed through these warehouse facilities, we are exposed to market, credit, liquidity, and other risks of the types described in Part I, Item 1A of this Annual Report on Form 10-K, under the heading “Risk Factors,” and in Part II, Item 7A of this Annual Report on Form 10-K under the heading “Market Risks,” if and when those loans become ineligible to be financed, decline in value, or have been financed for the maximum term permitted under the applicable facility.
Under our residential loan warehouse facilities, we also make various representations and warranties and have agreed to certain covenants, events of default, and other terms that if breached or triggered can result in our being required to immediately repay all outstanding amounts borrowed under these facilities and these facilities being unavailable to use for future financing needs. In particular, the terms of these facilities include financial covenants, cross-default provisions, judgment default provisions, and other events of default (such as, for example, events of default triggered by one of the following: a change in control over Redwood, regulatory investigation or enforcement action against Redwood, Redwood’s failure to continue to qualify as a REIT for tax purposes, or Redwood’s failure to maintain the listing of its common stock on the New York Stock Exchange). Under a cross-default provision, an event of default is triggered (and the warehouse facility becomes unavailable and outstanding amounts borrowed thereunder become due and payable) if an event of default or similar event occurs under another borrowing or credit facility we maintain in excess of a specified amount. Under a judgment default provision, an event of default is triggered (and the warehouse facility becomes unavailable and outstanding amounts borrowed thereunder become due and payable) if a judgment for damages in excess of a specified amount is entered against us in any litigation and we are unable to promptly satisfy the judgment. Financial covenants included in these warehouse facilities are further described below under the heading “–Financial Covenants Associated With Short-Term Debt and Other Debt Financing.”
These residential loan warehouse facilities could also become unavailable and outstanding amounts borrowed thereunder could become immediately due and payable if there is a material adverse change in our business. If we breach or trigger the representations and warranties, covenants, events of default, or other terms of our warehouse facilities, we are exposed to liquidity and other risks, including of the type described in Part I, Item 1A of this Annual Report on Form 10-K, under the heading “Risk Factors,” and in Part II, Item 7A of this Annual Report on Form 10-K under the heading “Market Risks.”
In addition to the five residential loan warehouse facilities described above, in the ordinary course of business we may seek to establish additional warehouse facilities that may be of a similar or greater size and may have similar or more restrictive terms. In the event a counterparty to one or more of our warehouse facilities becomes insolvent or unable or unwilling to perform its obligations under the facility, we may be unable to access short-term financing we need or fail to recover the full value of our residential mortgage loans financed.
Securities Repurchase Facilities. Another source of short-term debt financing is through securities repurchase facilities we have established with various different financial institution counterparties. Under these facilities we do not have an aggregate borrowing limit; however, these facilities are uncommitted, which means that any request we make to borrow funds under these facilities may be declined for any reason. Short-term financing for securities is obtained under these facilities by our transfer of securities to the counterparty in exchange for cash proceeds (in an amount less than 100% of the fair value of the transferred securities), and our covenant to reacquire those securities from the counterparty for the same amount plus a financing charge.
Under these securities repurchase facilities, securities are financed for a fixed period, which would not generally exceed 90 days. We generally intend to repay the short-term financing of a security under one of these facilities through a renewal of that financing with the same counterparty, through a sale of the security, or with other equity or long-term debt capital. While a security is financed under a securities repurchase facility, to the extent the value of the security declines (which value is generally determined by the counterparty under the facility), we are required to either immediately reacquire the security or meet a margin requirement to pledge
77
additional collateral, such as cash or U.S. Treasury securities, in an amount at least equal to the decline in value. See further discussion below under the heading “–Margin Call Provisions Associated with Short-Term Debt and Other Debt Financing.”
At the end of the fixed period applicable to the financing of a security under a securities repurchase facility, if we intend to continue to obtain financing for that security we would typically request the same counterparty to renew the financing for an additional fixed period. If the same counterparty does not renew the financing, it may be difficult for us to obtain financing for that security under one of our other securities repurchase facilities, due to the fact that the financial institution counterparties to our securities repurchase facilities generally only provide financing for securities that we purchased from them or one of their affiliates.
Because our securities repurchase facilities are uncommitted, at any given time we may not be able to obtain additional financing under them when we need it, exposing us to, among other things, liquidity risks of the types described in Part I, Item 1A of this Annual Report on Form 10-K, under the heading “Risk Factors,” and in Part II, Item 7A of this Annual Report on Form 10-K under the heading “Market Risks.” In addition, with respect to securities that at any given time are already being financed through our securities repurchase facilities, we are exposed to market, credit, liquidity, and other risks of the types described in Part I, Item 1A of this Annual Report on Form 10-K, under the heading “Risk Factors,” and in Part II, Item 7A of this Annual Report on Form 10-K under the heading “Market Risks,” if and when those securities decline in value, or have been financed for the maximum term permitted under the applicable facility.
Under our securities repurchase facilities, we also make various representations and warranties and have agreed to certain covenants, events of default, and other terms (including of the type described above under the heading “–Residential Loan Warehouse Facilities”) that if breached or triggered can result in our being required to immediately repay all outstanding amounts borrowed under these facilities and these facilities being unavailable to use for future financing needs. In particular, the terms of these facilities include financial covenants, cross-default provisions, judgment default provisions, and other events of default (including of the type described above under the heading “–Residential Loan Warehouse Facilities”). Financial covenants included in our repurchase facilities are further described below under the heading “–Financial Covenants Associated With Short-Term Debt and Other Debt Financing.”
Our securities repurchase facilities could also become unavailable and outstanding amounts borrowed thereunder could become immediately due and payable if there is a material adverse change in our business. If we breach or trigger the representations and warranties, covenants, events of default, or other terms of our securities repurchase facilities, we are exposed to liquidity and other risks, including of the type described in Part I, Item 1A of this Annual Report on Form 10-K, under the heading “Risk Factors,” and in Part II, Item 7A of this Annual Report on Form 10-K under the heading “Market Risks.”
In the ordinary course of business we may seek to establish additional securities repurchase facilities that may have similar or more restrictive terms. In the event a counterparty to one or more of our securities repurchase facilities becomes insolvent or unable or unwilling to perform its obligations under the facility, we may be unable to access the short-term financing we need or fail to recover the full value of our securities financed.
Commercial Mortgage Loan Warehouse Facility. Another source of short-term debt financing is secured borrowings under a commercial mortgage loan warehouse facility that is in place with a financial institution counterparty. Under this warehouse facility, we have an aggregate borrowing limit of $100 million; however, this facility is uncommitted, which means that any request we make to borrow funds under this facility may be declined for any reason, even if at the time of the borrowing request we have then-outstanding borrowings that are less than the borrowing limits under this facility. Short-term financing for commercial mortgage loans is obtained under this facility by our transfer of commercial mortgage loans to a special purpose entity which transfers them to the counterparty in exchange for cash proceeds (in an amount less than 100% of the principal amount of the transferred commercial mortgage loans), and our covenant to reacquire those commercial mortgage loans from the counterparty for the same amount plus a financing charge. Other periodic payments are also due under the facility.
In order to obtain financing for a commercial mortgage loan under this facility, the commercial mortgage loan must initially (and continuously while the financing remains outstanding) meet certain eligibility criteria, including, without limitation, that the commercial mortgage loan is not in a delinquent status. In addition, under this facility, a commercial mortgage loan can only be financed for a maximum period, which period would not generally exceed 180 days. We generally intend to repay the short-term financing of a commercial mortgage loan under this facility at or prior to the expiration of the financing term with the proceeds of a sale or securitization of that commercial mortgage loan, through the proceeds of other short-term borrowings, or with other equity or long-term debt capital. While a commercial mortgage loan is financed under this facility, to the extent the market value of the commercial mortgage loan declines (which market value is generally determined by the counterparty under the facility), we are required to either immediately reacquire the commercial mortgage loan or meet a margin requirement to pledge additional collateral,
78
such as cash or additional commercial mortgage loans, in an amount at least equal to the decline in value. See further discussion below under the heading “–Margin Call Provisions Associated with Short-Term Debt and Other Debt Financing.”
Because this warehouse facility is uncommitted, at any given time we may not be able to obtain additional financing under this facility when we need it, exposing us to, among other things, liquidity risks of the types described in Part I, Item 1A of this Annual Report on Form 10-K, under the heading “Risk Factors,” and in Part II, Item 7A of this Annual Report on Form 10-K under the heading “Market Risks.” In addition, with respect to commercial mortgage loans that at any given time are already being financed through this facility, we are exposed to market, credit, liquidity, and other risks of the types described in Part I, Item 1A of this Annual Report on Form 10-K, under the heading “Risk Factors,” and in Part II, Item 7A of this Annual Report on Form 10-K under the heading “Market Risks,” if and when those commercial mortgage loans become ineligible to be financed, decline in value, or have been financed for the maximum term permitted under the facility.
Under our commercial mortgage loan warehouse facility, we also make various representations and warranties and have agreed to certain covenants, events of default, and other terms that if breached or triggered can result in our being required to immediately repay all outstanding amounts borrowed under this facility and this facility being unavailable to use for future financing needs. In particular, the terms of this facility include financial covenants, cross-default provisions, judgment default provisions, and other events of default (including of the type described above under the heading “–Residential Loan Warehouse Facilities”). Financial covenants included in this warehouse facility are further described below under the heading “–Financial Covenants Associated With Short-Term Debt and Other Debt Financing.”
Our commercial mortgage loan warehouse facility could also become unavailable and outstanding amounts borrowed thereunder could become immediately due and payable if there is a material adverse change in our business. If we breach or trigger the representations and warranties, covenants, events of default, or other terms of this facility, we are exposed to liquidity and other risks, including of the type described in Part I, Item 1A of this Annual Report on Form 10-K, under the heading “Risk Factors,” and in Part II, Item 7A of this Annual Report on Form 10-K under the heading “Market Risks.”
In addition to the commercial mortgage loan warehouse facility described above, in the ordinary course of business we may seek to establish additional facilities that may be of a similar or greater size and may have similar or more restrictive terms. In the event a counterparty to one or more of our facilities becomes insolvent or unable or unwilling to perform its obligations under a facility, we may be unable to access the financing we need or we may fail to recover the full value of our commercial mortgage loans financed under the applicable facility.
Other Short-Term Debt Facilities. We also maintain a $10 million committed line of short-term credit from a bank, which is secured by our pledge of certain mortgage-backed securities we own. This bank line of credit is an additional source of short-term financing for us. Similar to the uncommitted warehouse and securities repurchase facilities described herein, under this committed line we make various representations and warranties and have agreed to certain covenants, events of default, and other terms that if breached or triggered can result in our being required to immediately repay all outstanding amounts borrowed under this facility and this facility being unavailable to use for future financing needs. The margin call provisions and financial covenants included in this committed line are further described below under the headings “–Margin Call Provisions Associated with Short-Term Debt and Other Debt Financing” and “–Financial Covenants Associated with Short-Term Debt and Other Debt Financing.” When we use this committed line to incur short-term debt we are exposed to the market, credit, liquidity, and other types of risks described above with respect to residential loan warehouse and securities repurchase facilities.
Commercial Debt Investment Repurchase Facility. Another source of debt financing is secured borrowings through a commercial debt investment repurchase facility that is in place with a financial institution counterparty. Under this repurchase facility, we have an aggregate borrowing limit of $150 million; however, any request we make to borrow funds under this facility secured by a particular commercial debt investment may be declined for any reason, even if at the time of the borrowing request we have then-outstanding borrowings that are less than the borrowing limits under this facility. Financing for commercial debt investments is obtained under this facility by our transfer of commercial debt investments to a special purpose entity which is beneficially owned by the counterparty in exchange for cash proceeds (in an amount less than 100% of the principal amount of the transferred commercial debt investments), and our covenant to reacquire those commercial debt investments for the same amount plus a financing charge. Other periodic payments are also due under the facility.
In order to obtain financing for a commercial debt investment under this facility, the commercial debt investment must initially (and continuously while the financing remains outstanding) meet certain eligibility criteria, including, without limitation, that the commercial debt investment is not in a delinquent status. This facility has an original three-year term. We generally intend to repay the financing of a commercial debt investment under this facility at or prior to the expiration of the financing term with the proceeds of a
79
securitization or other sale of that commercial debt investment, or with other equity or long-term debt capital. While a commercial debt investment is financed under this facility, to the extent the value of the commercial debt investment declines (which value is generally determined by the counterparty under the facility), we are required to either immediately reacquire the commercial debt investment or meet a margin requirement to pledge additional collateral, such as cash or additional commercial debt investments, in an amount at least equal to the decline in value. See further discussion below under the heading “–Margin Call Provisions Associated with Short-Term Debt and Other Debt Financing.”
Because the counterparty under this facility retains discretion to accept or reject a financing with respect to any particular commercial debt investment, at any given time we may not be able to obtain additional financing under this facility when we need it, exposing us to, among other things, liquidity risks of the types described in Part I, Item 1A of this Annual Report on Form 10-K, under the heading “Risk Factors,” and in Part II, Item 7A of this Annual Report on Form 10-K under the heading “Market Risks.” In addition, with respect to commercial debt investments that at any given time are already being financed through this facility, we are exposed to market, credit, liquidity, and other risks of the types described in Part I, Item 1A of this Annual Report on Form 10-K, under the heading “Risk Factors,” and in Part II, Item 7A of this Annual Report on Form 10-K under the heading “Market Risks,” if and when those commercial debt investments become ineligible to be financed, decline in value, or have been financed for the maximum term permitted under the facility.
Under our commercial debt investment repurchase facility, we also make various representations and warranties and have agreed to certain covenants, events of default, and other terms that if breached or triggered can result in our being required to immediately repay all outstanding amounts borrowed under this facility and this facility being unavailable to use for future financing needs. In particular, the terms of this facility include financial covenants, cross-default provisions, judgment default provisions, and other events of default (including of the type described above under the heading “–Residential Loan Warehouse Facilities”). Financial covenants included in our repurchase facilities are further described below under the heading “–Financial Covenants Associated With Short-Term Debt and Other Debt Financing.”
Our commercial debt investment repurchase facility could also become unavailable and outstanding amounts borrowed thereunder could become immediately due and payable if there is a material adverse change in our business. If we breach or trigger the representations and warranties, covenants, events of default, or other terms of this facility, we are exposed to liquidity and other risks, including of the type described in Part I, Item 1A of this Annual Report on Form 10-K, under the heading “Risk Factors,” and in Part II, Item 7A of this Annual Report on Form 10-K under the heading “Market Risks.”
In addition to the commercial debt investment repurchase facility described above, in the ordinary course of business we may seek to establish additional facilities that may be of a similar or greater size and may have similar or more restrictive terms. In the event a counterparty to one or more of our facilities becomes insolvent or unable or unwilling to perform its obligations under a facility, we may be unable to access the financing we need or we may fail to recover the full value of our commercial debt investments financed under the applicable facility.
Financial Covenants Associated With Short-Term Debt and Other Debt Financing
Set forth below is a summary of the financial covenants associated with our short-term debt and other debt financing facilities.
| • | Residential Loan Warehouse Facilities. As noted above, one source of our short-term debt financing is secured borrowings under residential loan warehouse facilities we have established with five different financial institution counterparties. Financial covenants included in these warehouse facilities are as follows and at December 31, 2013, and through the date of this Annual Report on Form 10-K, we were in compliance with each of these financial covenants: |
| o | Maintenance of a minimum dollar amount of stockholders’ equity/tangible net worth at Redwood. |
| o | Maintenance of a minimum dollar amount of cash and cash equivalents at Redwood or maintenance of an amount of cash and cash equivalents in excess of a specified percentage of outstanding short-term recourse indebtedness. |
| o | Maintenance of a minimum ratio of consolidated recourse indebtedness to stockholders’ equity and tangible net worth at Redwood. |
| o | Maintenance of uncommitted residential loan warehouse facilities with a specified level of unused borrowing capacity. |
| • | Securities Repurchase Facilities. As noted above, another source of our short-term debt financing is through secured borrowings under securities repurchase facilities we have established with various financial institution counterparties. |
80
| Financial covenants included in these securities repurchase facilities are as follows and at December 31, 2013, and through the date of this Annual Report on Form 10-K, we were in compliance with each of these financial covenants: |
| o | Maintenance of a minimum dollar amount of stockholders’ equity/tangible net worth at Redwood. |
| o | Maintenance of a minimum dollar amount of cash and cash equivalents at Redwood. |
| o | Maintenance of a minimum ratio of consolidated recourse indebtedness to consolidated adjusted tangible net worth at Redwood. |
| • | Commercial Mortgage Loan Warehouse Facility. As noted above, another source of our short-term debt financing is secured borrowings under a commercial mortgage loan warehouse facility that we have in place with a financial institution counterparty. Financial covenants included in this facility are as follows and at December 31, 2013, and through the date of this Annual Report on Form 10-K, we were in compliance with each of these financial covenants: |
| o | Maintenance of a minimum dollar amount of stockholders’ equity/tangible net worth at Redwood. |
| o | Maintenance of a minimum dollar amount of cash and cash equivalents at Redwood. |
| o | Maintenance of a minimum ratio of consolidated recourse indebtedness to stockholders’ equity at Redwood, including a separate minimum ratio for commercial assets which is applicable under certain specified circumstances. |
| • | Committed Line of Credit. As noted above, we also maintain a $10 million committed line of short-term credit from a bank, which is secured by our pledge of certain mortgage-backed securities we own. The types of financial covenants included in this bank line of credit are a subset of the covenants summarized above. |
| • | Commercial Debt Investment Repurchase Facility. As noted above, one source of our debt financing is secured borrowings under a commercial debt investment repurchase facility we have established with a financial institution counterparty. Financial covenants included in this facility are as follows and at December 31, 2013, and through the date of this Annual Report on Form 10-K, we were in compliance with each of these financial covenants: |
| o | Maintenance of a minimum dollar amount of stockholders’ equity/tangible net worth at Redwood. |
| o | Maintenance of a minimum dollar amount of cash and cash equivalents at Redwood. |
| o | Maintenance of a minimum ratio of consolidated recourse indebtedness to stockholders’ equity at Redwood. |
As noted above, at December 31, 2013, and through the date of this Annual Report on Form 10-K, we were in compliance with the financial covenants associated with our short-term debt and other debt financing facilities. In particular, with respect to: (i) financial covenants that require us to maintain a minimum dollar amount of stockholders’ equity or tangible net worth, at December 31, 2013 our level of stockholders’ equity and tangible net worth resulted in our being in compliance with these covenants by more than $200 million; and (ii) financial covenants that require us to maintain recourse indebtedness below a specified ratio, at December 31, 2013 our level of recourse indebtedness resulted in our being in compliance with these covenants at a level such that we could incur at least $1 billion in additional recourse indebtedness.
Margin Call Provisions Associated With Short-Term Debt and Other Debt Financing
| • | Residential Loan Warehouse Facilities. As noted above, one source of our short-term debt financing is secured borrowings under residential loan warehouse facilities we have established with five different financial institution counterparties. These warehouse facilities include the margin call provisions described below and during the year ended December 31, 2013, and through the date of this Annual Report on Form 10-K, we complied with any margin calls received from creditors under these warehouse facilities: |
| o | If at any time the market value (as determined by the creditor) of any residential mortgage loan financed under a facility declines, then the creditor may demand that we transfer additional collateral to the creditor (in the form of cash, U.S. Treasury obligations (in certain cases), or additional residential mortgage loans) with a value equal to the amount of the decline. If we receive any such demand, (i) under three of our residential loan warehouse facilities, we would generally be required to transfer the additional collateral on the same day (although demands received after a certain time would only require the transfer of additional collateral on the following business day) and (ii) under two of our residential loan |
81
| warehouse facilities, we would generally be required to transfer the additional collateral on the following business day. The value of additional residential mortgage loans transferred as additional collateral is determined by the creditor. |
| • | Securities Repurchase Facilities. Another source of our short-term debt financing is through secured borrowings under securities repurchase facilities we have established with various financial institution counterparties. These repurchase facilities include the margin call provisions described below and during the year ended December 31, 2013, and through the date of this Annual Report on Form 10-K, we complied with any margin calls received from creditors under these repurchase facilities: |
| o | If at any time the market value (as determined by the creditor) of any securities financed under a facility declines, then the creditor may demand that we transfer additional collateral to the creditor (in the form of cash, U.S. Treasury obligations, or additional securities) with a value equal to the amount of the decline. If we receive any such demand, we would generally be required to transfer the additional collateral on the same day. The value of additional securities transferred as additional collateral is determined by the creditor. |
| • | Commercial Mortgage Loan Warehouse Facility. As noted above, another source of our short-term debt financing is secured borrowings under a commercial mortgage loan warehouse facility we have in place with a financial institution counterparty. This facility includes the margin call provisions described below and during the year ended December 31, 2013, and through the date of this Annual Report on Form 10-K, we complied with any margin calls received from the creditor under this facility: |
| o | If at any time the market value (as determined by the creditor) of any commercial mortgage loan financed under the facility declines, then the creditor may demand that we transfer additional collateral to the creditor (in the form of cash or additional commercial mortgage loans) with a value equal to the amount of the decline. If we receive any such demand, we would generally be required to transfer the additional collateral on the following business day. The value of additional commercial mortgage loans transferred as additional collateral is determined by the creditor. |
| • | Committed Line of Credit. As noted above, we also maintain a $10 million committed line of short-term credit from a bank, which is secured by our pledge of certain mortgage-backed securities we own. Margin call provisions included in this bank line of credit are as follows and during the year ended December 31, 2013, and through the date of this Annual Report on Form 10-K, we complied with any margin calls received from this creditor under this line of credit: |
| o | If at any time the total market value (as determined by two broker-dealers) of the securities that are pledged as collateral under this facility declines to a value less than the outstanding amount of borrowings under this facility, then the creditor may demand that we transfer additional collateral to the creditor (in the form of cash, U.S. Treasury obligations, or additional securities) with a value equal to the amount of the difference. If we receive any such demand, we would generally be required to transfer the additional collateral within two business days. The value of additional collateral pledged is determined by the creditor. |
| • | Commercial Debt Investment Repurchase Facility. As noted above, one source of our debt financing is secured borrowings under a commercial debt investment repurchase facility we have established with a financial institution counterparty. This facility includes the margin call provisions described below and during the year ended December 31, 2013, and through the date of this Annual Report on Form 10-K, we complied with any margin calls received from the creditor under this facility: |
| o | If at any time the asset value (as determined by the creditor) of any commercial debt investment financed under the facility declines, then the creditor may demand that we transfer additional collateral to the creditor (in the form of cash or additional commercial debt investments) with a value equal to the amount of the decline. If we receive any such demand, we would generally be required to transfer the additional collateral on the second business day thereafter (although demands received after a certain time would allow an additional business day for the transfer of additional collateral to occur). The value of additional commercial debt investments transferred as additional collateral is determined by the creditor. |
OFF BALANCE SHEET ARRANGEMENTS AND CONTRACTUAL OBLIGATIONS
Off Balance Sheet Arrangements
We do not have any material off balance sheet arrangements.
82
Contractual Obligations
The following table presents our contractual obligations and commitments at December 31, 2013, as well as the obligations of the securitization entities that we sponsor and consolidate for financial reporting purposes.
Table 35 – Contractual Obligations and Commitments
| December 31, 2013 | Payments Due or Commitment Expiration by Period | |||||||||||||||||||
| (In Millions) |
Less Than 1 Year |
1 to 3 Years |
3 to 5 Years |
After 5 Years |
Total | |||||||||||||||
| Obligations of Redwood |
||||||||||||||||||||
| Short-term debt |
$ | 863 | $ | - | $ | - | $ | - | $ | 863 | ||||||||||
| Convertible notes |
- | - | 288 | - | 288 | |||||||||||||||
| Anticipated interest payments on convertible notes |
13 | 27 | 20 | - | 60 | |||||||||||||||
| Commercial borrowings |
- | 49 | - | - | 49 | |||||||||||||||
| Anticipated interest payments on commercial borrowings |
3 | 2 | - | - | 5 | |||||||||||||||
| Other long-term debt |
- | - | - | 140 | 140 | |||||||||||||||
| Anticipated interest payments on other long-term debt (1) |
9 | 19 | 19 | 171 | 218 | |||||||||||||||
| Accrued interest payable |
4 | - | - | - | 4 | |||||||||||||||
| Operating leases |
2 | 6 | 2 | 1 | 11 | |||||||||||||||
|
|
|
|
|
|
|
|
|
|
|
|||||||||||
| Total Redwood Obligations and Commitments |
$ | 894 | $ | 103 | $ | 329 | $ | 312 | $ | 1,638 | ||||||||||
|
|
|
|
|
|
|
|
|
|
|
|||||||||||
| Obligations of Consolidated Entities for Financial Reporting Purposes |
|
|||||||||||||||||||
| Consolidated ABS (2) |
$ | - | $ | 25 | $ | - | $ | 1,918 | $ | 1,943 | ||||||||||
| Anticipated interest payments on ABS (3) |
31 | 131 | 193 | 384 | 739 | |||||||||||||||
| Accrued interest payable |
2 | - | - | - | 2 | |||||||||||||||
|
|
|
|
|
|
|
|
|
|
|
|||||||||||
| Total Obligations of Entities Consolidated for Financial Reporting Purposes |
33 | 156 | 193 | 2,302 | 2,684 | |||||||||||||||
|
|
|
|
|
|
|
|
|
|
|
|||||||||||
| Total Consolidated Obligations and Commitments |
$ | 927 | $ | 259 | $ | 522 | $ | 2,614 | $ | 4,322 | ||||||||||
|
|
|
|
|
|
|
|
|
|
|
|||||||||||
| 1) | Includes anticipated interest payments related to hedges |
| 2) | All consolidated ABS issued are collateralized by real estate loans and securities. Although the stated maturity is as shown, the ABS obligations will pay down as the principal balances of these real estate loans or securities pay down. The amount shown is the principal balance of the ABS issued and not necessarily the value reported in our consolidated financial statements. |
| 3) | The anticipated interest payments on consolidated ABS issued is calculated based on the contractual maturity of the ABS and therefore assumes no prepayments of the principal outstanding at December 31, 2012. |
CRITICAL ACCOUNTING POLICIES AND ESTIMATES
The preparation of financial statements in conformity with GAAP requires us to make estimates and assumptions that affect the reported amounts of assets and liabilities at the date of the consolidated financial statements and the reported amounts of revenues and expenses during the reported period. Actual results could differ from those estimates. A discussion of critical accounting policies and the possible effects of changes in estimates on our financial statements is included in Note 3 — Summary of Significant Accounting Policies included in Part II, Item 8 of this Annual Report on Form 10-K. Management discusses the ongoing development and selection of these critical accounting policies with the audit committee of the board of directors
We expect quarter-to-quarter GAAP earnings volatility from our business activities. This volatility can occur for a variety of reasons, including the timing and amount of purchases, sales, calls, and repayment of consolidated assets, changes in the fair values of consolidated assets and liabilities, increases or decreases in earnings from mortgage banking activities, and certain non-recurring events. In addition, the amount or timing of our reported earnings may be impacted by technical accounting issues and estimates, some of which are described below.
83
Changes in Premium Amortization for Loans
The net unamortized premium for loans owned at Redwood, consolidated Sequoia Entities, and the Commercial Securitization, was $14 million at December 31, 2013. The amount of periodic premium amortization expense we recognize is volatile and dependent on a number of factors, including credit performance of the underlying loans, changes in prepayment speeds, and changes in short-term interest rates. Loan premium amortization was $6 million for both the years ended December 31, 2013 and 2012.
Changes in Allowance for Loan Losses
For real estate loans classified as held-for-investment, we establish and maintain an allowance for loan losses based on our estimate of credit losses inherent in our loan portfolios at the reporting date. To calculate the allowance for loan losses, we assess inherent losses by determining loss factors (defaults, loss severities on default liquidations, and the timing of default liquidations) that can be specifically applied to each of the consolidated loans or pools of loans.
Changes in actual defaults or our expectations on loss severities and default timing can have a significant effect on periodic income.
Changes in the Fair Value of Residential and Commercial Loans Held at Fair Value
Nearly all of our residential loans held-for-sale on our consolidated balance sheet at December 31, 2013, were being held for future securitizations or sales and expected to be sold to non-consolidated securitization entities or third parties. At the time of purchase, we typically elect the fair value option for these loans. For residential and commercial loans for which we have elected the fair value option, changes in fair values are recorded in mortgage banking activities, net, through the consolidated statements of income in the period in which the valuation change occurs. Periodic fluctuations in the values of these investments are inherently volatile and thus can lead to significant period-to-period GAAP earnings volatility.
Loans classified as held-for-sale that are not carried at fair value are carried at the lower of their cost basis or fair value. If the fair value of loans is lower than their cost basis, the difference is reported as a negative market valuation adjustment through other market valuation adjustments, net, through the consolidated statements of income in the period in which the valuation change occurs.
The fair value of loans is affected by, among other things, changes in interest rates, credit performance, prepayments, and market liquidity. To the extent interest rates change or market liquidity and or credit conditions materially change, the value of these loans could decline below their cost basis, which could have a material effect on reported earnings.
Changes in Mortgage Banking Income
A significant amount of our income in 2013 was derived from residential and commercial mortgage banking activities. The amount of income that can be earned from mortgage banking activities is primarily dependent on the volume of loans we are able to acquire or originate and any potential profit we earn upon the sale or securitization of these loans. Our ability to acquire or originate residential and commercial loans and the volume of loans we acquire or originate is dependent on many factors that are beyond our control, including general economic conditions and changes in interest rates, loan origination volumes industry-wide and at the sellers we purchase our loans from, increased regulation, and competition from other financial institutions. Our profitability from mortgage banking activities is also dependent on many factors, including our ability to effectively hedge certain risks related to changes in interest rates and other factors that are beyond our control, including changes in market credit risk pricing. Additionally, our income from mortgage banking activities is generally generated over the period from when we originate or identify a loan for purchase until we subsequently sell or securitize the loan. This income may encompass positive or negative market valuation adjustments on loans, hedging gains or losses associated with related risk management activities, and any other related transaction expenses, and may be realized unevenly over the course of one or more quarters for financial reporting purposes. Examples of additional factors that could impact our profitability include those discussed in Part I, Item 1A – Risk Factors of this Annual Report on Form 10-K and below, under the headings “Changes in the Fair Value of Residential and Commercial Loans Held at Fair Value” and “Changes in Fair Values of Derivative Financial Instruments.” Changes in the volumes of loans acquired or originated in connection with our mortgage banking activities and our profitability on these activities can have a significant effect on periodic income.
Changes in Yields for Securities
The yields we project on real estate securities can have a significant effect on the periodic interest income we recognize for financial reporting purposes. Yields can vary as a function of credit results, prepayment rates, and interest rates. If estimated future credit losses are less than our prior estimate, credit losses occur later than expected, or prepayment rates are faster than expected
84
(meaning the present value of projected cash flows is greater than previously expected for assets acquired at a discount to principal balance), the yield over the remaining life of the security may be adjusted upwards. If estimated future credit losses exceed our prior expectations, credit losses occur more quickly than expected, or prepayments occur more slowly than expected (meaning the present value of projected cash flows is less than previously expected for assets acquired at a discount to principal balance), the yield over the remaining life of the security may be adjusted downward.
Changes in the actual maturities of real estate securities may also affect their yields to maturity. Actual maturities are affected by the contractual lives of the associated mortgage collateral, periodic payments of principal, and prepayments of principal. Therefore, actual maturities of AFS securities are generally shorter than stated contractual maturities. Stated contractual maturities are generally greater than ten years. There is no assurance that our assumptions used to estimate future cash flows or the current period’s yield for each asset will not change in the near term, and any change could be material.
Changes in Fair Values of Securities
All securities owned at Redwood and legacy consolidated entities are classified as either trading or AFS securities, and in both cases are carried on our consolidated balance sheets at their estimated fair values. For trading securities, changes in fair values are recorded in the consolidated statements of income. Periodic fluctuations in the values of these investments are inherently volatile and thus can lead to significant GAAP earnings volatility each quarter.
For AFS securities, cumulative unrealized gains and losses are recorded as a component of accumulated other comprehensive income in our consolidated balance sheets. Unrealized gains are not credited to current earnings and unrealized losses are not charged against current earnings to the extent they are temporary in nature. Certain factors may require us, however, to recognize declines in the values of AFS securities as other-than-temporary impairments and record them through our current earnings. Factors that determine other-than-temporary-impairment include a change in our ability or intent to hold AFS securities, adverse changes to projected cash flows of assets, or the likelihood that declines in the fair values of assets would not return to their previous levels within a reasonable time. Impairments on AFS securities can lead to significant GAAP earnings volatility each quarter. In addition, sales of securities in large unrealized gain or loss positions that are not impaired can lead to significant GAAP earnings volatility each year.
Changes in Fair Values of Mortgage Servicing Rights
Mortgage servicing rights are carried on our consolidated balance sheets at their estimated fair values, with changes in fair values recorded in the consolidated statements of income as a component of MSR income (loss), net. Periodic fluctuations in the values of these investments are inherently volatile and can lead to significant GAAP earnings volatility each quarter. Periodic fluctuations in the values of our mortgage servicing rights can be caused by actual prepayments on the underlying loans, changes in assumptions regarding future projected prepayments on the underlying loans, or changes in the discount rate assumptions used to value mortgage servicing rights.
Changes in Fair Values of Derivative Financial Instruments
We can experience significant earnings volatility from our use of derivatives. We generally use derivatives as part of our mortgage banking activities (e.g., to manage risks associated with loans we plan to acquire and subsequently sell or securitize), and to manage variability in debt interest expense indexed to adjustable rates, and cash flows on assets and liabilities that have different coupon rates (fixed rates versus floating rates, or floating rates based on different indices). The nature of the instruments we use and the accounting treatment for the specific assets, liabilities, and derivatives may therefore lead to volatility in our periodic earnings, even when we are meeting our hedging objectives.
Some of our derivatives are accounted for as trading instruments with all associated changes in value recorded through our consolidated statements of income. Changes in value of the assets and liabilities we manage by using derivatives may not be accounted for similarly. This could lead to reported income and book values in specific periods that do not necessarily reflect the economics of our risk management strategy. Even when the assets and liabilities are similarly accounted for as trading instruments, periodic changes in their values may not coincide as other market factors (e.g., supply and demand) may affect certain instruments and not others at any given time.
85
Changes in Loss Contingency Reserves
We may be exposed to various loss contingencies, including, without limitation, those described in Note 14 to the financial statements included in Part II, Item 8 of this Annual Report on Form 10-K. In accordance with FASB guidance on accounting for contingencies, we review the need for any loss contingency reserves and establish them when, in the opinion of management, it is probable that a matter would result in a liability, and the amount of loss, if any, can be reasonably estimated. The establishment of a loss contingency reserve, the subsequent increase in a reserve or release of reserves previously established, or the recognition of a loss in excess of previously established reserves, can occur as a result of various factors and events that affect management’s opinion of whether the standard for establishing, increasing, or continuing to maintain, a reserve has been met. Changes in the loss contingency reserves can lead to significant GAAP earnings volatility each quarter.
NEW ACCOUNTING STANDARDS
A discussion of new accounting standards and the possible effects of these standards on our financial statements is included in Note 3 — Summary of Significant Accounting Policies included in Part II, Item 8 of this Annual Report on Form 10-K.
86
| ITEM 7A. | QUANTITATIVE AND QUALITATIVE DISCLOSURES ABOUT MARKET RISK |
Market Risks
We seek to manage risks inherent in our business — including but not limited to credit risk, interest rate risk, prepayment risk, liquidity risk, and fair value risk — in a prudent manner designed to enhance our earnings and dividends and preserve our capital. In general, we seek to assume risks that can be quantified from historical experience, to actively manage such risks, and to maintain capital levels consistent with these risks. This section presents a general overview of these risks. Additional information concerning the risks we are managing, how these risks are changing over time, and potential GAAP earnings and taxable income volatility we may experience as a result of these risks is further discussed in Part II, Item 7 of this Annual Report on Form 10-K.
Credit Risk
Integral to our business is assuming credit risk through our ownership of residential and commercial loans and securities as well as through our reliance on business counterparties. We believe the securities and loans we purchase are priced to generate an expected return that compensates us for the underlying credit risk associated with these investments. Nevertheless, there may be significant credit losses associated with these investments should they perform worse than we expect on a credit basis.
We manage our credit risks by analyzing the extent of the risk we are taking and reviewing whether we believe the appropriate underwriting criteria are met, and we utilize systems and staff to monitor the ongoing credit performance of our loans and securities. To the extent we find the credit risks on specific assets are changing adversely, we may be able to take actions, such as selling the affected investments, to mitigate potential losses. However, we may not always be successful in analyzing risks, reviewing underwriting criteria, foreseeing adverse changes in credit performance or in effectively mitigating future credit losses and the ability to sell an asset may be limited due to the structure of the asset or the absence of a liquid market for the asset.
Residential Loans and Securities
Our residential loans and securities backed by residential loans are generally secured by real property. Credit losses on real estate loans and securities can occur for many reasons, including: poor origination practices; fraud; faulty appraisals; documentation errors; poor underwriting; legal errors; poor servicing practices; weak economic conditions; decline in the value of homes, businesses, or commercial properties; special hazards; earthquakes and other natural events; over-leveraging of the borrower or on the property; reduction in market rents and occupancies and poor property management practices; changes in legal protections for lenders; reduction in personal incomes; job loss; and personal events such as divorce or health problems. In addition, if the U.S. economy or the housing market were to weaken (and that weakening was in excess of what we anticipated), credit losses could increase beyond levels that we have anticipated.
With respect to most of the loans securitized by securitization entities sponsored by us that we consolidate and for a portion of the loans underlying residential loan securities we have acquired from securitizations sponsored by others, the interest rate is adjustable. Accordingly, when short-term interest rates rise, required monthly payments from homeowners may rise under the terms of these loans, and this may increase borrowers’ delinquencies and defaults that can lead to additional credit losses.
We also own some securities backed by Alt-A quality loans (and, to a lesser degree, some backed by subprime loans) that have substantially higher credit risk characteristics than prime-quality loans. Consequently, we can expect these lower-quality loans to have higher rates of delinquency and loss, and if such losses differ from our assumptions, we could incur credit losses. In addition, we invest in riskier loan types with the potential for higher delinquencies and losses as compared to regular amortization loans, but believe these securities offer us the opportunity to generate attractive risk-adjusted returns as a result of attractive pricing and the manner in which these securitizations are structured. Nevertheless, there remains substantial uncertainty about the future performance of these assets.
Commercial Loans
The commercial loans we invest in are typically fixed-rate loans, the majority of which are interest-only loans that are generally subordinate to senior lien holders and are backed by a transaction sponsor or borrowing entity and not real property. In general, the loans we invest in require balloon payments at maturity. Consequently, we could be exposed to credit losses at the maturity of these loans if the borrower is unable to repay or refinance the borrowing with another third-party lender. The ability of the borrower to pay us back at maturity is a function of the cash flows generated on the commercial property, as well as the general level of interest rates. If interest rates rise to an extent that the cash flows on the property are insufficient to cover a new loan that is sufficient to pay off our loan, we would be subject to credit losses at maturity.
87
In addition, we originate commercial loans secured by first liens on commercial real estate with the intention to sell these loans or securitize them within a relatively short period of time following origination. Between the time of origination and the time of sale or securitization of these senior loans we are exposed to credit risk associated with these loans. In addition, we may, in some circumstances, invest in a subordinate security issued in a securitization transaction that includes one or more senior loans we originated, in which case we would continue to be exposed to credit risk with respect to these and other loans included in that securitization through our ownership of those subordinate securities.
Counterparties
We are also exposed to credit risk with respect to our business and lender counterparties. For example, counterparties we acquire loans from, lend to, or invest in, make representations and warranties and covenants to us, and may also indemnify us against certain losses. To the extent we have suffered a loss and are entitled to enforce those agreements to recover damages, if our counterparties are insolvent or unable or unwilling to comply with these agreements we would suffer a loss due to the credit risk associated with our counterparties. As an example, under short-term borrowing facilities and swap and other derivative agreements, we sometimes transfer assets as collateral to our counterparties. To the extent a counterparty is not able to return this collateral to us if and when we are entitled to its return, we could suffer a loss due to the credit risk associated with that counterparty.
In addition, because we rely on the availability of credit under committed and uncommitted borrowing facilities to fund our business and investments, our counterparties’ willingness and ability to extend credit to us under these facilities is a significant counterparty risk (and is discussed further below under the heading “Fair Value and Liquidity Risks”).
Interest Rate Risk
Changes in interest rates and the shape of the yield curve can affect the cash flows and fair values of our assets, liabilities, and derivative financial instruments and, consequently, affect our earnings and reported equity. Our general strategy with respect to interest rates is to maintain an asset/liability posture (including hedges) on a consolidated basis that assumes some interest rate risks but not to such a degree that the achievement of our long-term goals would likely be adversely affected by changes in interest rates. Accordingly, we are willing to accept short-term volatility of earnings and changes in our reported equity in order to accomplish our goal of achieving attractive long-term returns.
We purchase loans and mortgage-backed securities from third parties, securitize these assets and then sell certain tranches of these securities to third parties. We are exposed to interest rate risk during the “accumulation” period—the period when we enter into agreements to purchase the assets with the intention of securitizing or selling them at a future date. To mitigate this interest rate risk, we use derivative financial instruments for risk management purposes. We may also use derivative financial instruments in an effort to maintain a close match between pledged assets and debt, as well as between the interest rate characteristics of the assets in the securitization entities and the corresponding ABS issued. However, we generally do not attempt to completely hedge changes in interest rates, and at times, we may be subject to more interest rate risk than we generally desire in the long term. Changes in interest rates will have an impact on the values and cash flows of our assets and corresponding liabilities.
Prepayment Risk
Prepayment risks exist in the assets and associated liabilities consolidated on our balance sheets. In general, discount securities benefit from faster prepayment rates on the underlying real estate loans while premium securities (such as IOs) benefit from slower prepayments on the underlying loans. We note that changes in residential loan prepayment rates could result in GAAP and tax earnings volatility.
We caution that prepayment rates are difficult to predict or anticipate, and variations in prepayment rates can materially affect our earnings and dividend distribution requirements. ARM prepayment rates, for example, are driven by many factors, one of which is the steepness of the yield curve. As the yield curve flattens (short-term interest rates rise relative to longer-term interest rates), ARM prepayments typically increase. However, for borrowers who have impaired credit or who otherwise do not meet loan underwriting criteria, the ability to refinance (i.e., prepay) a loan even when interest rates decline may be limited.
Inflation Risk
Virtually all of our consolidated assets and liabilities are financial in nature. As a result, changes in interest rates and other factors drive our performance more directly than does inflation. Changes in interest rates do not necessarily correlate with inflation rates or changes in inflation rates. Separately, inflation or deflation in home prices can affect our credit risk.
88
Our financial statements are prepared in accordance with GAAP. Our activities and balance sheets are measured with reference to historical cost or fair value without considering inflation.
Fair Value and Liquidity Risks
To fund our assets we may use a variety of debt alternatives in addition to equity capital that present us with fair value and liquidity risks. We seek to manage these risks, including by maintaining what we believe to be adequate cash and capital levels.
Most residential loans we invest in are accumulated and sold or securitized through Sequoia securitization transactions and thus, changes in the fair value of the loans, once sold or securitized, do not have an impact on our liquidity. However, changes in fair values during the accumulation period (while these loans are typically funded with short-term debt before they are sold or securitized) may impact our liquidity. We may also own other real estate loans accounted for as held-for-sale and adverse changes in their value may be recognized through our income statement and may have an impact on our ability to obtain financing for them.
Many of the securities we acquire are funded with a combination of our capital, and secured financing or short-term debt facilities. To the extent we use capital or secured financing, we can reduce our liquidity risks; however, we would still be exposed to adverse changes in fair value of these securities as a result of changes in overall market liquidity. For the securities we acquire with a combination of capital and short-term debt, we would be exposed to liquidity risk to the extent the values of these investments decline and/or the counterparties we use to finance these investments adversely change our borrowing requirements. We attempt to mitigate our liquidity risk from short-term financing facilities by setting aside adequate capital.
Under short-term borrowing facilities, interest rate swaps and other derivatives agreements, we pledge assets as security for our payment obligations and make various representations and warranties and agree to certain covenants, events of default, and other terms. In addition, our short-term borrowing facilities are generally uncommitted, meaning that each time we request a new borrowing under a facility the lender has the option to decline to extend credit to us. The terms of these facilities and agreements typically include financial covenants (such as covenants to maintain a minimum amount of tangible net worth or stockholders’ equity and/or a minimum amount of liquid assets), margin requirements (which typically require us to pledge additional collateral if and when the value of previously pledged collateral declines), operating covenants (such as covenants to conduct our business in accordance with applicable laws and regulations and covenants to provide notice of certain events to creditors), representations and warranties (such as representations and warranties relating to characteristics of pledged collateral, our exposure to litigation and/or regulatory enforcement actions and the absence of material adverse changes to our financial condition, our operations, or our business prospects), and events of default (such as a breach of covenant or representation/warranty and cross-defaults, under which an event of default is triggered under a credit facility if an event of default or similar event occurs under another credit facility).
89
Quantitative Information on Market Risk
Our future earnings are sensitive to a number of market risk factors and changes in these factors may have a variety of secondary effects that, in turn, will also impact our earnings and equity. To supplement the discussion above of the market risks we face, the following table incorporates information that may be useful in analyzing certain market risks that may affect our consolidated balance sheet at December 31, 2013. The table presents principal cash flows and related average interest rates by year of repayment. The forward curve (future interest rates as implied by the yield structure of debt markets) at December 31, 2013, was used to project the average coupon rates for each year presented. The timing of principal cash flows includes assumptions on the prepayment speeds of assets based on their recent prepayment performance and future prepayment performance consistent with the forward curve. Our future results depend greatly on the credit performance of the underlying loans (this table assumes no credit losses), future interest rates, prepayments, and our ability to invest our existing cash and future cash flow.
| Principal Amounts Maturing and Effective Rates During Period | At December 31, 2013 | |||||||||||||||||||||||||||||||||||
| (Dollars in Thousands) |
2014 | 2015 | 2016 | 2017 | 2018 | Thereafter | |
Principal Balance |
|
|
Fair Value |
| ||||||||||||||||||||||||
| Interest rate sensitive assets |
||||||||||||||||||||||||||||||||||||
| Securitized Residential Loans |
||||||||||||||||||||||||||||||||||||
| Adjustable Rate |
Principal | $ | 235,061 | $ | 193,179 | $ | 168,814 | $ | 147,990 | $ | 127,581 | $ | 688,741 | $ | 1,561,366 | $ | 1,400,762 | |||||||||||||||||||
| Interest Rate | 1.79% | 1.81% | 2.68% | 3.84% | 4.72% | 5.84% | ||||||||||||||||||||||||||||||
| Fixed Rate |
Principal | $ | 19,279 | $ | 17,207 | $ | 15,350 | $ | 13,682 | $ | 12,175 | $ | 88,919 | $ | 166,613 | $ | 165,628 | |||||||||||||||||||
| Interest Rate | 4.67% | 4.67% | 4.66% | 4.66% | 4.66% | 4.77% | ||||||||||||||||||||||||||||||
| Hybrid |
Principal | 5,760 | 5,062 | 4,408 | 3,837 | 3,353 | 23,807 | 46,229 | 43,634 | |||||||||||||||||||||||||||
| Interest Rate | 3.06% | 2.99% | 3.81% | 4.88% | 5.90% | 5.84% | ||||||||||||||||||||||||||||||
| Unsecuritized Residential Loans |
||||||||||||||||||||||||||||||||||||
| Adjustable Rate |
Principal | 1,490 | - | - | - | - | - | 1,490 | 1,077 | |||||||||||||||||||||||||||
| Interest Rate | 1.68% | N/A | N/A | N/A | N/A | N/A | ||||||||||||||||||||||||||||||
| Fixed Rate |
Principal | 307,407 | - | - | - | - | - | 307,407 | 309,186 | |||||||||||||||||||||||||||
| Interest Rate | 4.29% | N/A | N/A | N/A | N/A | N/A | ||||||||||||||||||||||||||||||
| Hybrid |
Principal | 91,976 | - | - | - | - | - | 91,976 | 94,004 | |||||||||||||||||||||||||||
| Interest Rate | 3.42% | N/A | N/A | N/A | N/A | N/A | ||||||||||||||||||||||||||||||
| Residential Senior Securities |
||||||||||||||||||||||||||||||||||||
| Adjustable Rate |
Principal | 6,683 | 5,513 | 4,606 | 3,764 | 3,074 | 13,381 | 37,020 | 36,283 | |||||||||||||||||||||||||||
| Interest Rate | 2.25% | 2.39% | 3.08% | 4.10% | 5.02% | 5.68% | ||||||||||||||||||||||||||||||
| Fixed Rate |
Principal | 13,170 | 12,004 | 15,551 | 15,674 | 14,692 | 115,185 | 186,276 | 277,365 | |||||||||||||||||||||||||||
| Interest Rate | 3.47% | 3.62% | 2.72% | 4.53% | 4.89% | 5.31% | ||||||||||||||||||||||||||||||
| Hybrid |
Principal | 108,259 | 94,098 | 75,261 | 62,781 | 52,894 | 272,064 | 665,358 | 661,619 | |||||||||||||||||||||||||||
| Interest Rate | 2.87% | 2.97% | 3.75% | 4.63% | 5.57% | 6.35% | ||||||||||||||||||||||||||||||
| Residential Re-REMIC Securities |
||||||||||||||||||||||||||||||||||||
| Fixed Rate |
Principal | - | 385 | 538 | 489 | 792 | 73,061 | 75,264 | 56,208 | |||||||||||||||||||||||||||
| Interest Rate | 5.83% | 5.86% | 7.85% | 5.85% | 5.84% | 5.73% | ||||||||||||||||||||||||||||||
| Hybrid |
Principal | - | - | 3,781 | 11,891 | 10,011 | 113,099 | 138,782 | 120,168 | |||||||||||||||||||||||||||
| Interest Rate | 4.43% | 4.06% | 4.24% | 4.67% | 5.62% | 6.82% | ||||||||||||||||||||||||||||||
| Residential Subordinate Securities |
||||||||||||||||||||||||||||||||||||
| Adjustable Rate |
Principal | 1,501 | 1,481 | 1,382 | 1,635 | 2,580 | 21,220 | 29,798 | 23,004 | |||||||||||||||||||||||||||
| Interest Rate | 3.38% | 3.43% | 4.73% | 3.92% | 4.13% | 4.34% | ||||||||||||||||||||||||||||||
| Fixed Rate |
Principal | 18,515 | 17,777 | 17,207 | 21,325 | 31,937 | 524,850 | 631,611 | 483,384 | |||||||||||||||||||||||||||
| Interest Rate | 3.81% | 3.82% | 5.03% | 3.89% | 3.93% | 4.00% | ||||||||||||||||||||||||||||||
| Hybrid |
Principal | 5,510 | 6,266 | 6,031 | 5,131 | 4,159 | 33,144 | 60,241 | 24,830 | |||||||||||||||||||||||||||
| Interest Rate | 2.64% | 2.51% | 7.44% | 3.70% | 4.52% | 4.50% | ||||||||||||||||||||||||||||||
90
Quantitative Information on Market Risk
| Principal Amounts Maturing and Effective Rates During Period | At December 31, 2013 | |||||||||||||||||||||||||||||||||||
| (Dollars in Thousands) |
2014 | 2015 | 2016 | 2017 | 2018 | Thereafter | |
Principal Balance |
|
|
Fair Value |
| ||||||||||||||||||||||||
| Interest rate sensitive assets continued |
||||||||||||||||||||||||||||||||||||
| Commercial Loans Held-for-Investment |
||||||||||||||||||||||||||||||||||||
| Fixed Rate |
Principal | $ | 22,004 | $ | 33,129 | $ | 68,671 | $ | 25,485 | $ | 47,364 | $ | 107,333 | $ | 303,986 | $ | 298,961 | |||||||||||||||||||
| Interest Rate | 10.46% | 10.54% | 10.53% | 10.59% | 10.62% | 10.35% | ||||||||||||||||||||||||||||||
| Adjustable Rate |
Principal | 33,848 | 10,000 | 5,497 | - | - | - | 49,345 | 49,345 | |||||||||||||||||||||||||||
| Interest Rate | 11.74% | 12.09% | 13.09% | N/A | N/A | N/A | ||||||||||||||||||||||||||||||
| Commercial Loans Held-for-Sale |
||||||||||||||||||||||||||||||||||||
| Fixed Rate |
Principal | 87,650 | - | - | - | - | - | 87,650 | 89,111 | |||||||||||||||||||||||||||
| Interest Rate | 5.03% | N/A | N/A | N/A | N/A | N/A | ||||||||||||||||||||||||||||||
| Interest rate sensitive liabilities |
||||||||||||||||||||||||||||||||||||
| Asset-backed securities issued |
||||||||||||||||||||||||||||||||||||
| Sequoia Entities |
||||||||||||||||||||||||||||||||||||
| Adjustable Rate |
Principal | 84,187 | 73,358 | 74,535 | 76,681 | 75,828 | 1,153,485 | 1,538,073 | 1,324,736 | |||||||||||||||||||||||||||
| Interest Rate | 0.78% | 1.01% | 1.80% | 2.73% | 3.44% | 4.41% | ||||||||||||||||||||||||||||||
| Fixed Rate |
Principal | 1,627 | 1,707 | 1,791 | 1,879 | 1,971 | 77,283 | 86,257 | 87,311 | |||||||||||||||||||||||||||
| Interest Rate | 2.31% | 2.31% | 2.31% | 2.31% | 2.31% | 2.31% | ||||||||||||||||||||||||||||||
| Hybrid |
Principal | 1,879 | 1,898 | 1,871 | 1,838 | 1,810 | 74,696 | 83,994 | 81,735 | |||||||||||||||||||||||||||
| Interest Rate | 3.53% | 3.55% | 3.97% | 4.50% | 5.01% | 4.98% | ||||||||||||||||||||||||||||||
| Residential Resecuritization |
||||||||||||||||||||||||||||||||||||
| Adjustable Rate |
Principal | 7,519 | 9,134 | 9,610 | 9,471 | 9,522 | 49,678 | 94,934 | 96,358 | |||||||||||||||||||||||||||
| Interest Rate | 2.24% | 2.62% | 3.63% | 4.78% | 5.69% | 6.62% | ||||||||||||||||||||||||||||||
| Commercial Securitization |
||||||||||||||||||||||||||||||||||||
| Fixed Rate |
Principal | 19,687 | 43,016 | 73,393 | 8,631 | - | 8,965 | 153,693 | 156,766 | |||||||||||||||||||||||||||
| Interest Rate | 5.69% | 5.84% | 6.31% | 2.49% | 0.00% | 0.00% | ||||||||||||||||||||||||||||||
| Short-term Debt |
Principal | 862,763 | - | - | - | - | - | 862,763 | 862,763 | |||||||||||||||||||||||||||
| Interest Rate | 1.42% | N/A | N/A | N/A | N/A | N/A | ||||||||||||||||||||||||||||||
| Long-term Debt |
||||||||||||||||||||||||||||||||||||
| Commercial Borrowings |
Principal | - | 49,473 | - | - | - | - | 49,473 | 49,473 | |||||||||||||||||||||||||||
| Interest Rate | 5.21% | 5.51% | N/A | N/A | N/A | N/A | ||||||||||||||||||||||||||||||
| Convertible Notes |
Principal | - | - | - | - | 287,500 | - | 287,500 | 299,719 | |||||||||||||||||||||||||||
| Interest Rate | 4.63% | 4.63% | 4.63% | 4.63% | 4.63% | N/A | ||||||||||||||||||||||||||||||
| Other long-term debt |
Principal | - | - | - | - | - | 139,500 | 139,500 | 111,600 | |||||||||||||||||||||||||||
| Interest Rate | 2.50% | 2.74% | 3.69% | 4.85% | 5.74% | 6.93% | ||||||||||||||||||||||||||||||
| Interest rate agreements |
||||||||||||||||||||||||||||||||||||
| Interest Rate Swaps |
||||||||||||||||||||||||||||||||||||
| (Purchased) |
Notional Amount | - | - | - | - | 80,000 | 378,000 | 458,000 | (10,627) | |||||||||||||||||||||||||||
| Receive Strike Rate | 0.30% | 0.79% | 1.96% | 3.00% | 3.79% | 4.68% | ||||||||||||||||||||||||||||||
| Pay Strike Rate | 2.77% | 3.41% | 3.77% | 3.78% | 3.73% | 4.32% | ||||||||||||||||||||||||||||||
91
ITEM 8. FINANCIAL STATEMENTS AND SUPPLEMENTARY DATA
The Consolidated Financial Statements of Redwood Trust, Inc. and Notes thereto, together with the Reports of Independent Registered Public Accounting Firm thereon, are set forth on pages F-1 through F-74 of this Annual Report on Form 10-K and incorporated herein by reference.
ITEM 9. CHANGES IN AND DISAGREEMENTS WITH ACCOUNTANTS ON ACCOUNTING AND FINANCIAL DISCLOSURE
None.
ITEM 9A. CONTROLS AND PROCEDURES
We have adopted and maintain disclosure controls and procedures that are designed to ensure that information required to be disclosed on our reports under the Securities Exchange Act of 1934, as amended (the Exchange Act) is recorded, processed, summarized, and reported within the time periods specified in the U.S. Securities and Exchange Commission’s rules and forms and that the information is accumulated and communicated to our management, including our chief executive officer and chief financial officer, as appropriate, to allow for timely decisions regarding required disclosure. In designing and evaluating the disclosure controls and procedures, management recognizes that any controls and procedures, no matter how well designed and operated, can provide only reasonable assurance of achieving the desired control objectives, and management is required to apply its judgment in evaluating the cost-benefit relationship of possible controls and procedures.
As required by Rule 13a-15(b) of the Exchange Act, we have carried out an evaluation, under the supervision and with the participation of management, including our chief executive officer and chief financial officer, of the effectiveness of the design and operation of our disclosure controls and procedures as of the end of the quarter covered by this report. Based on the foregoing, our chief executive officer and chief financial officer concluded that our disclosure controls and procedures were effective at a reasonable assurance level.
There have been no changes in our internal control over financial reporting that occurred during the quarter ended December 31, 2013, that have materially affected, or are reasonably likely to materially affect, our internal control over financial reporting.
92
MANAGEMENT’S REPORT ON INTERNAL CONTROL OVER FINANCIAL REPORTING
Management of Redwood Trust, Inc., together with its consolidated subsidiaries (the company, or Redwood), is responsible for establishing and maintaining adequate internal control over financial reporting. Our internal control over financial reporting is a process designed under the supervision of our chief executive officer and chief financial officer to provide reasonable assurance regarding the reliability of financial reporting and the preparation of our financial statements for external reporting purposes in accordance with U.S. generally accepted accounting principles (GAAP).
As of the end of our 2013 fiscal year, management conducted an assessment of the effectiveness of our internal control over financial reporting based on the framework established in Internal Control — Integrated Framework released by the Committee of Sponsoring Organizations of the Treadway Commission (COSO) in 1992. Based on this assessment, management has determined that the company’s internal control over financial reporting as of December 31, 2013, was effective.
Our internal control over financial reporting includes policies and procedures that pertain to the maintenance of records that, in reasonable detail, accurately and fairly reflect transactions and dispositions of assets; provide reasonable assurances that transactions are recorded as necessary to permit preparation of financial statements in accordance with GAAP, and that receipts and expenditures are being made only in accordance with authorizations of management and the board of directors of Redwood; and provide reasonable assurance regarding prevention or timely detection of unauthorized acquisition, use or disposition of our assets that could have a material effect on our financial statements.
The company’s internal control over financial reporting as of December 31, 2013, has been audited by Grant Thornton LLP, an independent registered public accounting firm, as stated in their report appearing on page F-3, which expresses an unqualified opinion on the effectiveness of the company’s internal control over financial reporting as of December 31, 2013.
There is no information required to be disclosed in a report on Form 8-K during the fourth quarter of the year covered by this Annual Report on Form 10-K that has not been so reported.
93
PART III
ITEM 10. DIRECTORS, EXECUTIVE OFFICERS AND CORPORATE GOVERNANCE
The information required by Item 10 is incorporated herein by reference to the definitive Proxy Statement to be filed with the SEC pursuant to Regulation 14A within 120 days after the end of the fiscal year covered by this Annual Report on Form 10-K.
ITEM 11. EXECUTIVE COMPENSATION
The information required by Item 11 is incorporated herein by reference to the definitive Proxy Statement to be filed with the SEC pursuant to Regulation 14A within 120 days after the end of the fiscal year covered by this Annual Report on Form 10-K.
ITEM 12. SECURITY OWNERSHIP OF CERTAIN BENEFICIAL OWNERS AND MANAGEMENT AND RELATED STOCKHOLDER MATTERS
The information required by Item 12 is incorporated herein by reference to the definitive Proxy Statement to be filed with the SEC pursuant to Regulation 14A within 120 days after the end of the fiscal year covered by this Annual Report on Form 10-K.
ITEM 13. CERTAIN RELATIONSHIPS AND RELATED TRANSACTIONS, AND DIRECTOR INDEPENDENCE
The information required by Item 13 is incorporated herein by reference to the definitive Proxy Statement to be filed with the SEC pursuant to Regulation 14A within 120 days after the end of the fiscal year covered by this Annual Report on Form 10-K.
ITEM 14. PRINCIPAL ACCOUNTING FEES AND SERVICES
The information required by Item 14 is incorporated herein by reference to the definitive Proxy Statement to be filed with the SEC pursuant to Regulation 14A within 120 days after the end of the fiscal year covered by this Annual Report on Form 10-K.
94
PART IV
ITEM 15. EXHIBITS, FINANCIAL STATEMENT SCHEDULES
Documents filed as part of this report:
| (1) | Consolidated Financial Statements and Notes thereto |
| (2) | Schedules to Consolidated Financial Statements: |
All Consolidated Financial Statements schedules not included have been omitted because they are either inapplicable or the information required is provided in the Company’s Consolidated Financial Statements and Notes thereto, included in Part II, Item 8, of this Annual Report on Form 10-K.
| (3) | Exhibits: |
| Exhibit Number |
Exhibit | |
| 3.1 | Articles of Amendment and Restatement of the Registrant, effective July 6, 1994 (incorporated by reference to the Registrant’s Quarterly Report on Form 10-Q, Exhibit 3.1, filed on August 6, 2008) | |
| 3.1.1 | Articles Supplementary of the Registrant, effective August 10, 1994 (incorporated by reference to the Registrant’s Quarterly Report on Form 10-Q, Exhibit 3.1.1, filed on August 6, 2008) | |
| 3.1.2 | Articles Supplementary of the Registrant, effective August 11, 1995 (incorporated by reference to the Registrant’s Quarterly Report on Form 10-Q, Exhibit 3.1.2, filed on August 6, 2008) | |
| 3.1.3 | Articles Supplementary of the Registrant, effective August 9, 1996 (incorporated by reference to the Registrant’s Quarterly Report on Form 10-Q, Exhibit 3.1.3, filed on August 6, 2008) | |
| 3.1.4 | Certificate of Amendment of the Registrant, effective June 30, 1998 (incorporated by reference to the Registrant’s Quarterly Report on Form 10-Q, Exhibit 3.1.4, filed on August 6, 2008) | |
| 3.1.5 | Articles Supplementary of the Registrant, effective April 7, 2003 (incorporated by reference to the Registrant’s Quarterly Report on Form 10-Q, Exhibit 3.1.5, filed on August 6, 2008) | |
| 3.1.6 | Articles of Amendment of the Registrant, effective June 12, 2008 (incorporated by reference to the Registrant’s Quarterly Report on Form 10-Q, Exhibit 3.1.6, filed on August 6, 2008) | |
| 3.1.7 | Articles of Amendment of the Registrant, effective May 19, 2009 (incorporated by reference to the Registrant’s Current Report on Form 8-K, Exhibit 3.1, filed on May 21, 2009) | |
| 3.1.8 | Articles of Amendment of the Registrant, effective May 24, 2011 (incorporated by reference to the Registrant’s Current Report on Form 8-K, Exhibit 3.1, filed on May 20, 2011) | |
| 3.1.9 | Articles of Amendment of the Registrant, effective May 18, 2012 (incorporated by reference to the Registrant’s Current Report on Form 8-K, Exhibit 3.1, filed on May 21, 2012) | |
| 3.1.10 | Articles of Amendment of the Registrant, effective May 16, 2013 (incorporated by reference to the Registrant’s Current Report on Form 8-K, Exhibit 3.1, filed on May 21, 2013) | |
| 3.2.1 | Amended and Restated Bylaws of the Registrant, as adopted on March 5, 2008 (incorporated by reference to the Registrant’s Current Report on Form 8-K, Exhibit 3.1, filed on March 11, 2008) | |
| 3.2.2 | First Amendment to Amended and Restated Bylaws of the Registrant, as adopted on May 17, 2012 (incorporated by reference to the Registrant’s Current Report on Form 8-K, Exhibit 3.2, filed on May 21, 2012) | |
| 4.1 | Form of Common Stock Certificate (incorporated by reference to the Registrant’s Registration Statement on Form S-11 (No. 333-08363), Exhibit 4.3, filed on August 6, 1996) | |
| 4.2 | Indenture dated as of October 1, 2001 between Sequoia Mortgage Trust 5 and Bankers Trust Company of California, N.A., as Trustee (incorporated by reference to Sequoia Mortgage Funding Corporation’s Current Report on Form 8-K, Exhibit 99.1, filed on November 15, 2001) | |
| 4.3 | Indenture dated as April 1, 2002 between Sequoia Mortgage Trust 6 and Deutsche Bank National Trust Company, as Trustee (incorporated by reference to Sequoia Mortgage Funding Corporation’s Current Report on Form 8-K, Exhibit 99.1, filed on May 13, 2002) | |
| 4.4 | Junior Subordinated Indenture dated as of December 12, 2006 between the Registrant and The Bank of New York Trust Company, National Association, as Trustee (incorporated by reference to the Registrant’s Current Report on Form 8-K, Exhibit 1.4, filed on December 12, 2006) | |
| 4.5 | Amended and Restated Trust Agreement dated December 12, 2006 among the Registrant, The Bank of New York Trust Company, National Association, The Bank of New York (Delaware), the Administrative Trustees (as named therein) and the several holders of the Preferred Securities from time to time (incorporated by reference to the Registrant’s Current Report on Form 8-K, Exhibit 1.3, filed on December 12, 2006 |
95
| Exhibit Number |
Exhibit | |
| 4.6 | Purchase Agreement dated December 12, 2006 among the Registrant, Redwood Capital Trust I and Merrill Lynch International (incorporated by reference to the Registrant’s Current Report on Form 8-K, Exhibit 1.1, filed on December 12, 2006) | |
| 4.7 | Purchase Agreement dated December 12, 2006 among the Registrant, Redwood Capital Trust I and Bear, Stearns & Co. Inc. (incorporated by reference to the Registrant’s Current Report on Form 8-K, Exhibit 1.2, filed on December 12, 2006) | |
| 4.8 | Subordinated Indenture dated as of May 23, 2007 between the Registrant and Wilmington Trust Company (incorporated by reference to the Registrant’s Current Report on Form 8-K, Exhibit 1.2, filed on May 23, 2007) | |
| 4.9 | Purchase Agreement dated May 23, 2007 between the Registrant and Obsidian CDO Warehouse, LLC (incorporated by reference to the Registrant’s Current Report on Form 8-K, Exhibit 1.1, filed on May 23, 2007) | |
| 4.10 | Indenture, dated as of November 28, 2012, among RCMC 2012-CREL1, LLC, as Issuer, KeyCorp Real Estate Capital Markets, Inc., as Advancing Agent, and Wells Fargo Bank, National Association, as Trustee, Paying Agent, Transfer Agent, Custodian, Backup Advancing Agent and Notes Registrar (incorporated by reference to the Registrant’s Current Report on Form 8-K, Exhibit 10.1, filed on December 4, 2012) | |
| 4.11 | Indenture, dated March 6, 2013, between Redwood Trust, Inc. and Wilmington Trust, National Association, as Trustee (incorporated by reference to the Registrant’s Current Report on Form 8-K/A, Exhibit 4.1, filed on March 6, 2013) | |
| 4.12 | First Supplemental Indenture, dated March 6, 2013, between Redwood Trust, Inc. and Wilmington Trust, National Association, as Trustee (including the form of 4.625% Convertible Senior Note due 2018) (incorporated by reference to the Registrant’s Current Report on Form 8-K/A, Exhibit 4.2, filed on March 6, 2013) | |
| 9.1 | Waiver Agreement dated as of November 15, 2007 between the Registrant and Davis Selected Advisors, L.P. (incorporated by reference to the Registrant’s Annual Report on Form 10-K, Exhibit 9.1, filed on March 5, 2008) | |
| 9.2 | Amendment of Waiver Agreement dated as of January 16, 2008 between Registrant and Davis Selected Advisors, L.P. (incorporated by reference to the Registrant’s Annual Report on Form 10-K, Exhibit 9.2, filed on March 5, 2008) | |
| 10.1* | Amended and Restated 1994 Executive and Non-Employee Director Stock Option Plan, as last amended January 24, 2002 (incorporated by reference to the Registrant’s Quarterly Report on Form 10-Q, Exhibit 10.14.5, filed on May 15, 2002) | |
| 10.2* | 2002 Incentive Plan, as amended through May 16, 2013 (incorporated by reference to the Registrant’s Current Report on Form 8-K, Exhibit 10.1, filed on May 21, 2013) | |
| 10.3* | Form of Employee Incentive Stock Option Grant Agreement under 2002 Incentive Plan (incorporated by reference to the Registrant’s Annual Report on Form 10-K, Exhibit 10.8.1, filed on March 16, 2005) | |
| 10.4* | Form of Employee Non-Qualified Stock Option Grant Agreement under 2002 Incentive Plan (incorporated by reference to the Registrant’s Annual Report on Form 10-K, Exhibit 10.8.2, filed on filed on March 16, 2005) | |
| 10.5* | Form of Amendment to Employee Non-Qualified Stock Option Grant Agreement under 2002 Incentive Plan (incorporated by reference to the Registrant’s Current Report on Form 8-K, Exhibit 10.2, filed on November 17, 2005) | |
| 10.6* | Form of Restricted Stock Award Agreement under 2002 Incentive Plan – Pre-December 2011 (incorporated by reference to the Registrant’s Annual Report on Form 10-K, Exhibit 10.8.3, filed on March 16, 2005) | |
| 10.7* | Form of Deferred Stock Unit Award Agreement under 2002 Incentive Plan – Pre-December 2011 (incorporated by reference to the Registrant’s Current Report on Form 8-K, Exhibit 10.1, filed on December 2, 2010) | |
| 10.8* | Form of Performance Stock Unit Award Agreement under 2002 Incentive Plan – Pre-December 2011 (incorporated by reference to the Registrant’s Current Report on Form 8-K, Exhibit 10.2, filed on December 2, 2010) | |
| 10.9* | Form of Restricted Stock Award Agreement under 2002 Incentive Plan (incorporated by reference to the Registrant’s Current Report on Form 8-K, Exhibit 10.3, filed on December 8, 2011) | |
| 10.10* | Form of Deferred Stock Unit Award Agreement under 2002 Incentive Plan (incorporated by reference to the Registrant’s Current Report on Form 8-K, Exhibit 10.1, filed on December 8, 2011) | |
| 10.11* | Form of Performance Stock Unit Award Agreement under 2002 Incentive Plan – December 2011 (incorporated by reference to the Registrant’s Current Report on Form 8-K, Exhibit 10.2, filed on December 8, 2011) | |
| 10.12* | Form of Performance Stock Unit Award Agreement under 2002 Incentive Plan – December 2012 (incorporated by reference to the Registrant’s Current Report on Form 8-K, Exhibit 10.1, filed on December 11, 2012) | |
| 10.13* | 2002 Employee Stock Purchase Plan, as amended through May 16, 2013 (incorporated by reference to the Registrant’s Current Report on Form 8-K, Exhibit 10.2, filed on May 21, 2013) | |
| 10.14* | Executive Deferred Compensation Plan, as amended and restated on December 10, 2008 (incorporated by reference to the Registrant’s Current Report on Form 8-K, Exhibit 10.1, filed on January 14, 2009) |
96
| Exhibit Number |
Exhibit | |
| 10.15* | First Amendment to Amended and Restated Executive Deferred Compensation Plan, effective as of November 23, 2013 (filed herewith) | |
| 10.16* | Direct Stock Purchase and Dividend Reinvestment Plan (incorporated by reference to the Plan text included in the Registrant’s Prospectus Supplement filed on September 5, 2012) | |
| 10.17* | Summary of the Registrant’s Compensation Arrangements for Non-Employee Directors (incorporated by reference to the “Director Compensation” section of the Registrant’s Definitive Proxy Statement filed on April 2, 2013) | |
| 10.18* | Revised Form of Indemnification Agreement for Directors and Executive Officers (incorporated by reference to the Registrant’s Current Report on Form 8-K, Exhibit 99.3, filed on November 16, 2009) | |
| 10.19 | Office Building Lease, dated February 27, 2003 (incorporated by reference to the Registrant’s Annual Report on Form 10-K, Exhibit 10.30.2, filed on March 12, 2004) | |
| 10.20 | Office Building Lease (second floor), dated July 31, 2006 (incorporated by reference to the Registrant’s Quarterly Report on Form 10-Q, Exhibit 10.1, filed November 2, 2006) | |
| 10.21 | Second Amendment to Lease, dated July 31, 2006 (incorporated by reference to the Registrant’s Quarterly Report on Form 10-Q, Exhibit 10.3, filed November 2, 2006) | |
| 10.22 | Office Building Lease, effective as of and dated as of June 1, 2012 (incorporated by reference to the Registrant’s Quarterly Report on Form 10-Q, Exhibit 10.1, filed November 3, 2011) | |
| 10.23 | Lease Agreement, dated as of January 11, 2013, between MG-Point, LLC, as Landlord, and the Registrant, as Tenant (incorporated by reference to the Registrant’s Annual Report on Form 10-K, Exhibit 10.22, filed on February 26, 2013) | |
| 10.24 | First Amendment to Lease, effective as of June 27, 2013, between MG-Point, LLC, as Landlord, and the Registrant, as Tenant (incorporated by reference to the Registrant’s Quarterly Report on Form 10-Q, Exhibit 10.4, filed August 8, 2013) | |
| 10.25* | Amended and Restated Employment Agreement, dated as of March 31, 2009, by and between George E. Bull, III and the Registrant (incorporated by reference to the Registrant’s Quarterly Report on Form 10-Q, Exhibit 10.4, filed on August 8, 2013) | |
| 10.26* | Amended and Restated Employment Agreement, dated as of March 31, 2009, by and between Martin S. Hughes and the Registrant (incorporated by reference to the Registrant’s Quarterly Report on Form 10-Q, Exhibit 10.2, filed on May 5, 2009) | |
| 10.27* | Amended and Restated Employment Agreement, dated as of March 31, 2009, by and between Brett D. Nicholas and the Registrant (incorporated by reference to the Registrant’s Quarterly Report on Form 10-Q, Exhibit 10.3, filed on May 5, 2009) | |
| 10.28* | Amended and Restated Employment Agreement, dated as of March 31, 2009, by and between Harold F. Zagunis and the Registrant (incorporated by reference to the Registrant’s Quarterly Report on Form 10-Q, Exhibit 10.4, filed on May 5, 2009) | |
| 10.29* | First Amendment to Amended and Restated Employment Agreement, by and between Martin S. Hughes and the Registrant, dated as of March 17, 2010 (incorporated by reference to the Registrant’s Current Report on Form 8-K, Exhibit 10.1, filed on March 18, 2010) | |
| 10.30* | First Amendment to Amended and Restated Employment Agreement, by and between Brett D. Nicholas and the Registrant, dated as of March 17, 2010 (incorporated by reference to the Registrant’s Current Report on Form 8-K, Exhibit 10.2, filed on March 18, 2010) | |
| 10.31* | Second Amendment to Amended and Restated Employment Agreement, by and between Martin S. Hughes and the Registrant, dated as of February 24, 2011 (incorporated by reference to the Registrant’s Annual Report on Form 10-K, Exhibit 10.23, filed on February 24, 2011) | |
| 10.32* | Second Amendment to Amended and Restated Employment Agreement, by and between Brett D. Nicholas and the Registrant, dated as of February 24, 2011 (incorporated by reference to the Registrant’s Annual Report on Form 10-K, Exhibit 10.24, filed on February 24, 2011) | |
| 10.33* | First Amendment to Amended and Restated Employment Agreement, by and between Harold F. Zagunis and the Registrant, dated as of February 24, 2011 (incorporated by reference to the Registrant’s Annual Report on Form 10-K, Exhibit 10.25, filed on February 24, 2011) | |
| 10.34* | Third Amendment to Amended and Restated Employment Agreement, by and between Martin S. Hughes and the Registrant, dated as of May 17, 2012 (incorporated by reference to the Registrant’s Current Report on Form 8-K, Exhibit 10.3, filed on May 21, 2012) | |
| 10.35* | Third Amendment to Amended and Restated Employment Agreement, by and between Brett D. Nicholas and the Registrant, dated as of May 17, 2012 (incorporated by reference to the Registrant’s Current Report on Form 8-K, Exhibit 10.4, filed on May 21, 2012) |
97
| Exhibit Number |
Exhibit | |
| 10.36* | Second Amendment to Amended and Restated Employment Agreement, by and between Harold F. Zagunis and the Registrant, dated as of May 17, 2012 (incorporated by reference to the Registrant’s Current Report on Form 8-K, Exhibit 10.5, filed on May 21, 2012) | |
| 10.37* | Fourth Amendment to Amended and Restated Employment Agreement, by and between Martin S. Hughes and the Registrant, dated as of December 14, 2012 (incorporated by reference to the Registrant’s Annual Report on Form 10-K, Exhibit 10.35, filed on February 26, 2013) | |
| 10.38* | Fourth Amendment to Amended and Restated Employment Agreement, by and between Brett D. Nicholas and the Registrant, dated as of December 14, 2012 (incorporated by reference to the Registrant’s Annual Report on Form 10-K, Exhibit 10.36, filed on February 26, 2013) | |
| 10.39* | Third Amendment to Amended and Restated Employment Agreement, by and between Harold F. Zagunis and the Registrant, dated as of December 14, 2012 (incorporated by reference to the Registrant’s Annual Report on Form 10-K, Exhibit 10.37, filed on February 26, 2013) | |
| 10.40* | Transition Agreement, dated as of December 10, 2008, between Douglas B. Hansen and the Registrant (incorporated by reference to the Registrant’s Annual Report on Form 10-K, Exhibit 10.27, filed on February 26, 2009) | |
| 10.41* | Transition Agreement, dated as of March 17, 2010, between George E. Bull, III and the Registrant (incorporated by reference to the Registrant’s Quarterly Report on Form 10-Q, Exhibit 10.3, filed on May 5, 2010) | |
| 10.42* | Transition and Separation Agreement, dated as of June 6, 2013, between Scott M. Chisholm and the Registrant (incorporated by reference to the Registrant’s Current Report on Form 8-K, Exhibit 10.1, filed on June 11, 2013) | |
| 12 | Computation of Ratio of Earnings to Fixed Charges (filed herewith) | |
| 21 | List of Subsidiaries (filed herewith) | |
| 23 | Consent of Grant Thornton LLP (filed herewith) | |
| 31.1 | Certification of the Chief Executive Officer pursuant to Section 302 of the Sarbanes-Oxley Act of 2002 (filed herewith) | |
| 31.2 | Certification of the Chief Financial Officer pursuant to Section 302 of the Sarbanes-Oxley Act of 2002 (filed herewith) | |
| 32.1 | Certification of the Chief Executive Officer pursuant to Section 906 of the Sarbanes-Oxley Act of 2002 (filed herewith) | |
| 32.2 | Certification of the Chief Financial Officer pursuant to Section 906 of the Sarbanes-Oxley Act of 2002 (filed herewith) | |
| 101 | Pursuant to Rule 405 of Regulation S-T, the following financial information from the Registrant’s Annual Report on Form 10-K for the period ended December 31, 2013, is filed in XBRL-formatted interactive data files: (i) Consolidated Balance Sheets at December 31, 2013 and 2012; (ii) Consolidated Statements of Income for the years ended December 31, 2013, 2012, and 2011; (iii) Statements of Consolidated Comprehensive (Loss) Income for the years ended December 31, 2013, 2012, and 2011; (iv) Consolidated Statements of Changes in Equity for the years ended December 31, 2013, 2012, and 2011; (v) Consolidated Statements of Cash Flows for the years ended December 31, 2013, 2012, and 2011; and (vi) Notes to Consolidated Financial Statements. |
| * | Indicates exhibits that include management contracts or compensatory plan or arrangements. |
98
SIGNATURES
Pursuant to the requirements of Section 13 or 15(d) of the Securities Exchange Act of 1934, the registrant has duly caused this report to be signed on its behalf by the undersigned, hereunto duly authorized.
| REDWOOD TRUST, INC. | ||||||
| Date: February 25, 2014 | By: | /S/ MARTIN S. HUGHES | ||||
| Martin S. Hughes | ||||||
| Chief Executive Officer | ||||||
Pursuant to the requirements the Securities Exchange Act of 1934, this report has been signed below by the following persons on behalf of the registrant and in the capacities and on the dates indicated.
| Signature |
Title |
Date | ||
| /S/ MARTIN S. HUGHES |
Director and Chief Executive Officer | February 25, 2014 | ||
| Martin S. Hughes | (Principal Executive Officer) | |||
| /S/ CHRISTOPHER J. ABATE |
Chief Financial Officer | February 25, 2014 | ||
| Christopher J. Abate | (Principal Financial Officer) | |||
| /S/ COLLIN L. COCHRANE |
Managing Director and Controller | February 25, 2014 | ||
| Collin L. Cochrane | (Principal Accounting Officer) | |||
| /S/ RICHARD D. BAUM |
Director, Chairman of the Board | February 25, 2014 | ||
| Richard D. Baum | ||||
| /S/ DOUGLAS B. HANSEN |
Director, Vice-Chairman of the Board | February 25, 2014 | ||
| Douglas B. Hansen | ||||
| /S/ MARIANN BYERWALTER |
Director | February 25, 2014 | ||
| Mariann Byerwalter | ||||
| /S/ GREG H. KUBICEK |
Director | February 25, 2014 | ||
| Greg H. Kubicek | ||||
| /S/ JEFFREY T. PERO |
Director | February 25, 2014 | ||
| Jeffrey T. Pero | ||||
| /S/ GEORGANNE C. PROCTOR |
Director | February 25, 2014 | ||
| Georganne C. Proctor | ||||
| /S/ CHARLES J. TOENISKOETTER |
Director | February 25, 2014 | ||
| Charles J. Toeniskoetter | ||||
99
CONSOLIDATED FINANCIAL STATEMENTS,
REPORTS OF INDEPENDENT REGISTERED PUBLIC ACCOUNTING FIRM
For Inclusion in Annual Report on Form 10-K Filed With
Securities and Exchange Commission
December 31, 2013
F-1
INDEX TO CONSOLIDATED FINANCIAL STATEMENTS
REDWOOD TRUST, INC.
F-2
REPORT OF INDEPENDENT REGISTERED PUBLIC ACCOUNTING FIRM
Board of Directors and Shareholders
Redwood Trust, Inc.
We have audited the internal control over financial reporting of Redwood Trust, Inc. (a Maryland corporation) and subsidiaries (the “Company”) as of December 31, 2013, based on criteria established in the 1992 Internal Control—Integrated Framework issued by the Committee of Sponsoring Organizations of the Treadway Commission (COSO). The Company’s management is responsible for maintaining effective internal control over financial reporting and for its assessment of the effectiveness of internal control over financial reporting, included in the accompanying Management’s Report on Internal Control over Financial Reporting. Our responsibility is to express an opinion on the Company’s internal control over financial reporting based on our audit.
We conducted our audit in accordance with the standards of the Public Company Accounting Oversight Board (United States). Those standards require that we plan and perform the audit to obtain reasonable assurance about whether effective internal control over financial reporting was maintained in all material respects. Our audit included obtaining an understanding of internal control over financial reporting, assessing the risk that a material weakness exists, testing and evaluating the design and operating effectiveness of internal control based on the assessed risk, and performing such other procedures as we considered necessary in the circumstances. We believe that our audit provides a reasonable basis for our opinion.
A company’s internal control over financial reporting is a process designed to provide reasonable assurance regarding the reliability of financial reporting and the preparation of financial statements for external purposes in accordance with generally accepted accounting principles. A company’s internal control over financial reporting includes those policies and procedures that (1) pertain to the maintenance of records that, in reasonable detail, accurately and fairly reflect the transactions and dispositions of the assets of the company; (2) provide reasonable assurance that transactions are recorded as necessary to permit preparation of financial statements in accordance with generally accepted accounting principles, and that receipts and expenditures of the company are being made only in accordance with authorizations of management and directors of the company; and (3) provide reasonable assurance regarding prevention or timely detection of unauthorized acquisition, use, or disposition of the company’s assets that could have a material effect on the financial statements.
Because of its inherent limitations, internal control over financial reporting may not prevent or detect misstatements. Also, projections of any evaluation of effectiveness to future periods are subject to the risk that controls may become inadequate because of changes in conditions, or that the degree of compliance with the policies or procedures may deteriorate.
In our opinion, the Company maintained, in all material respects, effective internal control over financial reporting as of December 31, 2013, based on criteria established in the 1992 Internal Control—Integrated Framework issued by COSO.
We also have audited, in accordance with the standards of the Public Company Accounting Oversight Board (United States), the consolidated financial statements of the Company as of and for the year ended December 31, 2013, and our report dated February 25, 2014, expressed an unqualified opinion on those financial statements.
/s/ GRANT THORNTON LLP
Irvine, CA
February 25, 2014
F-3
REPORT OF INDEPENDENT REGISTERED PUBLIC ACCOUNTING FIRM
Board of Directors and Shareholders
Redwood Trust, Inc.
We have audited the accompanying consolidated balance sheets of Redwood Trust, Inc. (a Maryland corporation) and subsidiaries (the “Company”) as of December 31, 2013 and 2012, and the related consolidated statements of income, comprehensive income (loss), changes in equity, and cash flows for each of the three years in the period ended December 31, 2013. These financial statements are the responsibility of the Company’s management. Our responsibility is to express an opinion on these financial statements based on our audits.
We conducted our audits in accordance with the standards of the Public Company Accounting Oversight Board (United States). Those standards require that we plan and perform the audit to obtain reasonable assurance about whether the financial statements are free of material misstatement. An audit includes examining, on a test basis, evidence supporting the amounts and disclosures in the financial statements. An audit also includes assessing the accounting principles used and significant estimates made by management, as well as evaluating the overall financial statement presentation. We believe that our audits provide a reasonable basis for our opinion.
In our opinion, the consolidated financial statements referred to above present fairly, in all material respects, the financial position of Redwood Trust, Inc. and subsidiaries as of December 31, 2013 and 2012, and the results of their operations and their cash flows for each of the three years in the period ended December 31, 2013 in conformity with accounting principles generally accepted in the United States of America.
We also have audited, in accordance with the standards of the Public Company Accounting Oversight Board (United States), the Company’s internal control over financial reporting as of December 31, 2013, based on criteria established in the 1992 Internal Control—Integrated Framework issued by the Committee of Sponsoring Organizations of the Treadway Commission (COSO), and our report dated February 25, 2014 expressed an unqualified opinion.
/s/ GRANT THORNTON LLP
Irvine, CA
February 25, 2014
F-4
REDWOOD TRUST, INC. AND SUBSIDIARIES
| (In Thousands, Except Share Data) |
December 31, 2013 | December 31, 2012 | ||||||
| ASSETS | ||||||||
| Residential loans, held-for-sale (includes $403,747 and $556,283 at fair value) |
$ | 404,267 | $ | 562,658 | ||||
| Residential loans, held-for-investment |
1,762,167 | 2,272,812 | ||||||
| Commercial loans, held-for-sale (includes $89,111 and $0 at fair value) |
89,111 | 8,500 | ||||||
| Commercial loans, held-for-investment |
343,344 | 304,510 | ||||||
| Real estate securities, at fair value |
1,682,861 | 1,108,753 | ||||||
| Mortgage servicing rights, at fair value |
64,824 | 5,315 | ||||||
| Cash and cash equivalents |
173,201 | 81,080 | ||||||
|
|
|
|
|
|||||
| Total earning assets |
4,519,775 | 4,343,628 | ||||||
|
|
|
|
|
|||||
| Restricted cash |
398 | 383 | ||||||
| Accrued interest receivable |
13,475 | 12,442 | ||||||
| Derivative assets |
7,787 | 2,972 | ||||||
| Deferred securities issuance costs |
13,453 | 9,293 | ||||||
| Other assets |
53,640 | 75,380 | ||||||
|
|
|
|
|
|||||
| Total Assets (1) |
$ | 4,608,528 | $ | 4,444,098 | ||||
|
|
|
|
|
|||||
| LIABILITIES AND EQUITY | ||||||||
| Liabilities |
||||||||
| Short-term debt |
$ | 862,763 | $ | 551,918 | ||||
| Accrued interest payable |
6,366 | 4,592 | ||||||
| Derivative liabilities |
18,167 | 51,081 | ||||||
| Accrued expenses and other liabilities |
48,704 | 26,902 | ||||||
| Deferred tax liability |
7,316 | - | ||||||
| Asset-backed securities issued |
1,942,962 | 2,529,941 | ||||||
| Long-term debt |
476,467 | 139,500 | ||||||
|
|
|
|
|
|||||
| Total liabilities (1) |
3,362,745 | 3,303,934 | ||||||
| Equity |
||||||||
| Common stock, par value $0.01 per share, 180,000,000 and 165,000,000 shares authorized; 82,504,801 and 81,716,416 issued and outstanding |
825 | 817 | ||||||
| Additional paid-in capital |
1,760,899 | 1,744,554 | ||||||
| Accumulated other comprehensive income |
148,766 | 138,332 | ||||||
| Cumulative earnings |
806,298 | 633,052 | ||||||
| Cumulative distributions to stockholders |
(1,471,005) | (1,376,591) | ||||||
|
|
|
|
|
|||||
| Total equity |
1,245,783 | 1,140,164 | ||||||
|
|
|
|
|
|||||
| Total Liabilities and Equity |
$ | 4,608,528 | $ | 4,444,098 | ||||
|
|
|
|
|
|||||
| (1) | Our consolidated balance sheets include assets of consolidated variable interest entities (“VIEs”) that can only be used to settle obligations of these VIEs and liabilities of consolidated VIEs for which creditors do not have recourse to the primary beneficiary (Redwood Trust, Inc.). At December 31, 2013 and 2012, assets of consolidated VIEs totaled $2,299,576 and $2,893,117, respectively, and liabilities of consolidated VIEs totaled $1,944,911 and $2,532,916 respectively. See Note 4 for further discussion. |
The accompanying notes are an integral part of these consolidated financial statements.
F-5
REDWOOD TRUST, INC. AND SUBSIDIARIES
CONSOLIDATED STATEMENTS OF INCOME
| Year Ended December 31, | ||||||||||||
| (In Thousands, Except Share Data) |
2013 | 2012 | 2011 | |||||||||
| Interest Income |
||||||||||||
| Residential loans |
$ | 67,016 | $ | 82,169 | $ | 81,116 | ||||||
| Commercial loans |
43,420 | 26,759 | 8,835 | |||||||||
| Real estate securities |
115,563 | 122,386 | 127,179 | |||||||||
| Cash and cash equivalents |
157 | 70 | 49 | |||||||||
|
|
|
|
|
|
|
|||||||
| Total interest income |
226,156 | 231,384 | 217,179 | |||||||||
| Interest Expense |
||||||||||||
| Short-term debt |
(17,436) | (9,390) | (1,031) | |||||||||
| Asset-backed securities issued |
(39,716) | (101,732) | (88,433) | |||||||||
| Long-term debt |
(23,819) | (9,583) | (9,514) | |||||||||
|
|
|
|
|
|
|
|||||||
| Total interest expense |
(80,971) | (120,705) | (98,978) | |||||||||
|
|
|
|
|
|
|
|||||||
| Net Interest Income |
145,185 | 110,679 | 118,201 | |||||||||
| Provision for loan losses |
(4,737) | (3,648) | (16,151) | |||||||||
|
|
|
|
|
|
|
|||||||
| Net Interest Income After Provision |
140,448 | 107,031 | 102,050 | |||||||||
| Noninterest Income |
||||||||||||
| Mortgage banking activities, net |
100,676 | 36,319 | - | |||||||||
| Mortgage servicing rights income, net |
20,309 | (1,391) | - | |||||||||
| Other market valuation adjustments, net (1) |
(5,709) | 1,539 | (40,017) | |||||||||
| Realized gains, net |
25,259 | 54,921 | 10,946 | |||||||||
|
|
|
|
|
|
|
|||||||
| Total noninterest income |
140,535 | 91,388 | (29,071) | |||||||||
| Operating expenses |
(84,789) | (65,359) | (47,741) | |||||||||
| Other expense |
(12,000) | - | - | |||||||||
|
|
|
|
|
|
|
|||||||
| Net income before provision for income taxes |
184,194 | 133,060 | 25,238 | |||||||||
| Provision for income taxes |
(10,948) | (1,291) | (42) | |||||||||
|
|
|
|
|
|
|
|||||||
| Net income |
173,246 | 131,769 | 25,196 | |||||||||
| Less: Net loss attributable to noncontrolling interest |
- | - | (1,147) | |||||||||
|
|
|
|
|
|
|
|||||||
| Net Income Attributable to Redwood Trust, Inc. |
$ | 173,246 | $ | 131,769 | $ | 26,343 | ||||||
|
|
|
|
|
|
|
|||||||
| Basic earnings per common share |
$ | 2.05 | $ | 1.61 | $ | 0.31 | ||||||
| Diluted earnings per common share |
$ | 1.94 | $ | 1.59 | $ | 0.31 | ||||||
| Regular dividends declared per common share |
$ | 1.12 | $ | 1.00 | $ | 1.00 | ||||||
| Basic weighted average shares outstanding |
81,985,897 | 79,529,950 | 78,229,510 | |||||||||
| Diluted weighted average shares outstanding |
93,694,924 | 80,673,682 | 78,299,510 | |||||||||
| (1) | For the year ended December 31, 2013, other-than-temporary impairments were $4,532, of which $1,833 were recognized through the Income Statement, and $2,699 were recognized in Accumulated Other Comprehensive Income (Loss). |
For the year ended December 31, 2012, other-than-temporary impairments were $3,536, of which $2,509 were recognized through the Income Statement, and $1,027 were recognized in Accumulated Other Comprehensive Income (Loss).
For the year ended December 31, 2011, other-than-temporary impairments were $15,106, of which $9,472 were recognized through the Income Statement, and $5,634 were recognized in Accumulated Other Comprehensive Income (Loss).
The accompanying notes are an integral part of these consolidated financial statements.
F-6
REDWOOD TRUST, INC. AND SUBSIDIARIES
STATEMENTS OF CONSOLIDATED COMPREHENSIVE INCOME (LOSS)
| Year Ended December 31, | ||||||||||||
| (In Thousands) |
2013 | 2012 | 2011 | |||||||||
| Net Income |
$ | 173,246 | $ | 131,769 | $ | 26,343 | ||||||
| Other comprehensive income (loss): |
||||||||||||
| Net unrealized (loss) gain on available-for-sale securities |
(1,918) | 131,227 | (88,502) | |||||||||
| Reclassification of unrealized (gain) loss to net income |
(20,008) | 1,448 | 5,048 | |||||||||
| Net unrealized gain (loss) on interest rate agreements |
32,079 | 3,987 | (42,115) | |||||||||
| Reclassification of unrealized loss on interest rate agreements to net income |
281 | 14,821 | 4,243 | |||||||||
|
|
|
|
|
|
|
|||||||
| Total other comprehensive income (loss) |
10,434 | 151,483 | (121,326) | |||||||||
| Total comprehensive income (loss) |
183,680 | 283,252 | (94,983) | |||||||||
| Less: Comprehensive income attributable to noncontrolling interest |
- | - | (4,164) | |||||||||
|
|
|
|
|
|
|
|||||||
| Comprehensive Income (Loss) Attributable to Redwood Trust, Inc. |
$ | 183,680 | $ | 283,252 | $ | (99,147) | ||||||
|
|
|
|
|
|
|
|||||||
The accompanying notes are an integral part of these consolidated financial statements.
F-7
REDWOOD TRUST, INC. AND SUBSIDIARIES
CONSOLIDATED STATEMENTS OF CHANGES IN EQUITY
For the Year Ended December 31, 2013
| Accumulated | ||||||||||||||||||||||||||||||||
| Common Stock | Additional | Other | Cumulative | |||||||||||||||||||||||||||||
| Paid-In | Comprehensive | Cumulative | Distributions | Noncontrolling | ||||||||||||||||||||||||||||
| (In Thousands, Except Share Data) |
Shares | Amount | Capital | Income | Earnings | to Stockholders | Interest | Total | ||||||||||||||||||||||||
| December 31, 2012 |
81,716,416 | $ | 817 | $ | 1,744,554 | $ | 138,332 | $ | 633,052 | $ | (1,376,591) | $ | - | $ | 1,140,164 | |||||||||||||||||
| Net income |
- | - | - | - | 173,246 | - | - | 173,246 | ||||||||||||||||||||||||
| Other comprehensive income |
- | - | - | 10,434 | - | - | - | 10,434 | ||||||||||||||||||||||||
| Issuance of common stock: |
||||||||||||||||||||||||||||||||
| Dividend reinvestment & stock purchase plans |
431,679 | 4 | 8,144 | - | - | - | - | 8,148 | ||||||||||||||||||||||||
| Employee stock purchase and incentive plans |
356,706 | 4 | (5,346) | - | - | - | - | (5,342) | ||||||||||||||||||||||||
| Non-cash equity award compensation |
- | - | 13,547 | - | - | - | - | 13,547 | ||||||||||||||||||||||||
| Common dividends declared |
- | - | - | - | - | (94,414) | - | (94,414) | ||||||||||||||||||||||||
|
|
|
|
|
|
|
|
|
|
|
|
|
|
|
|
|
|||||||||||||||||
| December 31, 2013 |
82,504,801 | $ | 825 | $ | 1,760,899 | $ | 148,766 | $ | 806,298 | $ | (1,471,005) | $ | - | $ | 1,245,783 | |||||||||||||||||
|
|
|
|
|
|
|
|
|
|
|
|
|
|
|
|
|
|||||||||||||||||
For the Year Ended December 31, 2012
| Accumulated | ||||||||||||||||||||||||||||||||
| Common Stock | Additional | Other | Cumulative | |||||||||||||||||||||||||||||
| Paid-In | Comprehensive | Cumulative | Distributions | Noncontrolling | ||||||||||||||||||||||||||||
| (In Thousands, Except Share Data) |
Shares | Amount | Capital | Income (Loss) | Earnings | to Stockholders | Interest | Total | ||||||||||||||||||||||||
| December 31, 2011 |
78,555,908 | $ | 786 | $ | 1,697,979 | $ | (13,151) | $ | 501,283 | $ | (1,294,313) | $ | - | $ | 892,584 | |||||||||||||||||
| Net income |
- | - | - | - | 131,769 | - | - | 131,769 | ||||||||||||||||||||||||
| Other comprehensive income |
- | - | - | 151,483 | - | - | - | 151,483 | ||||||||||||||||||||||||
| Issuance of common stock: |
||||||||||||||||||||||||||||||||
| Dividend reinvestment & stock purchase plans |
2,741,168 | 28 | 38,552 | - | - | - | - | 38,580 | ||||||||||||||||||||||||
| Employee stock purchase and incentive plans |
419,340 | 3 | (1,819) | - | - | - | - | (1,816) | ||||||||||||||||||||||||
| Non-cash equity award compensation |
- | - | 9,842 | - | - | - | - | 9,842 | ||||||||||||||||||||||||
| Common dividends declared |
- | - | - | - | - | (82,278) | - | (82,278) | ||||||||||||||||||||||||
|
|
|
|
|
|
|
|
|
|
|
|
|
|
|
|
|
|||||||||||||||||
| December 31, 2012 |
81,716,416 | $ | 817 | $ | 1,744,554 | $ | 138,332 | $ | 633,052 | $ | (1,376,591) | $ | - | $ | 1,140,164 | |||||||||||||||||
|
|
|
|
|
|
|
|
|
|
|
|
|
|
|
|
|
|||||||||||||||||
For the Year Ended December 31, 2011
| Accumulated | ||||||||||||||||||||||||||||||||
| Common Stock | Additional | Other | Cumulative | |||||||||||||||||||||||||||||
| Paid-In | Comprehensive | Cumulative | Distributions | Noncontrolling | ||||||||||||||||||||||||||||
| (In Thousands, Except Share Data) |
Shares | Amount | Capital | Income (Loss) | Earnings | to Stockholders | Interest | Total | ||||||||||||||||||||||||
| December 31, 2010 |
78,124,668 | $ | 781 | $ | 1,689,851 | $ | 112,339 | $ | 474,940 | $ | (1,213,158) | $ | 10,839 | $ | 1,075,592 | |||||||||||||||||
| Net income |
- | - | - | - | 26,343 | - | (1,147) | 25,196 | ||||||||||||||||||||||||
| Other comprehensive (loss) income |
- | - | - | (125,490) | - | - | 4,164 | (121,326) | ||||||||||||||||||||||||
| Issuance of common stock: |
||||||||||||||||||||||||||||||||
| Dividend reinvestment & stock purchase plans |
708,664 | 7 | 8,784 | - | - | - | - | 8,791 | ||||||||||||||||||||||||
| Employee stock purchase and incentive plans |
374,662 | 4 | (2,782) | - | - | - | - | (2,778) | ||||||||||||||||||||||||
| Non-cash equity award compensation |
- | - | 9,108 | - | - | - | - | 9,108 | ||||||||||||||||||||||||
| Share repurchases |
(652,086) | (6) | (6,982) | - | - | - | - | (6,988) | ||||||||||||||||||||||||
| Distributions to noncontrolling interest, net |
- | - | - | - | - | - | (14,112) | (14,112) | ||||||||||||||||||||||||
| Common dividends declared |
- | - | - | - | - | (81,155) | - | (81,155) | ||||||||||||||||||||||||
| Deconsolidation elimination |
- | - | - | - | - | - | 256 | 256 | ||||||||||||||||||||||||
|
|
|
|
|
|
|
|
|
|
|
|
|
|
|
|
|
|||||||||||||||||
| December 31, 2011 |
78,555,908 | $ | 786 | $ | 1,697,979 | $ | (13,151) | $ | 501,283 | $ | (1,294,313) | $ | - | $ | 892,584 | |||||||||||||||||
|
|
|
|
|
|
|
|
|
|
|
|
|
|
|
|
|
|||||||||||||||||
The accompanying notes are an integral part of these consolidated financial statements.
F-8
REDWOOD TRUST, INC. AND SUBSIDIARIES
CONSOLIDATED STATEMENTS OF CASH FLOWS
| Year Ended December 31, | ||||||||||||
| (In Thousands) |
2013 | 2012 | 2011 | |||||||||
| Cash Flows From Operating Activities: |
||||||||||||
| Net income attributable to Redwood Trust, Inc. |
$ | 173,246 | $ | 131,769 | $ | 26,343 | ||||||
| Adjustments to reconcile net income to net cash (used in) provided by operating activities: |
||||||||||||
| Amortization of premiums, discounts, and securities issuance costs, net |
(26,165) | (12,803) | (31,851) | |||||||||
| Depreciation and amortization of non-financial assets |
388 | 1,873 | 1,713 | |||||||||
| Purchases of loans |
(7,766,203) | (2,335,865) | - | |||||||||
| Proceeds from sales of loans |
7,405,088 | 1,696,433 | - | |||||||||
| Principal payments on loans |
19,030 | 9,904 | - | |||||||||
| Net settlements of derivatives |
45,447 | (22,653) | - | |||||||||
| Provision for loan losses |
4,737 | 3,648 | 16,151 | |||||||||
| Non-cash equity award compensation |
13,547 | 9,842 | 9,108 | |||||||||
| Market valuation adjustments, net |
(95,931) | (14,976) | 40,017 | |||||||||
| Realized gains, net |
(36,290) | (75,790) | (10,946) | |||||||||
| Net change in: |
||||||||||||
| Accrued interest receivable and other assets |
12,001 | 8,762 | (42,348) | |||||||||
| Accrued interest payable, deferred tax liabilities, and accrued expenses and other liabilities |
29,276 | 36,509 | 9,623 | |||||||||
|
|
|
|
|
|
|
|||||||
| Net cash (used in) provided by operating activities |
(221,829) | (563,347) | 17,810 | |||||||||
|
|
|
|
|
|
|
|||||||
| Cash Flows From Investing Activities: |
||||||||||||
| Purchases of loans held-for-investment |
(65,771) | (156,344) | (960,014) | |||||||||
| Proceeds from sales of loans (1) |
440 | 357,742 | 2,092 | |||||||||
| Principal payments on loans |
523,900 | 573,646 | 409,009 | |||||||||
| Purchases of real estate securities |
(488,598) | (358,720) | (128,566) | |||||||||
| Proceeds from sales of real estate securities |
220,535 | 201,461 | 86,254 | |||||||||
| Principal payments on real estate securities |
163,951 | 218,447 | 166,134 | |||||||||
| Purchase of mortgage servicing rights |
(3,106) | - | - | |||||||||
| Net increase in restricted cash |
(15) | 200 | 9,537 | |||||||||
|
|
|
|
|
|
|
|||||||
| Net cash provided by (used in) investing activities |
351,336 | 836,432 | (415,554) | |||||||||
|
|
|
|
|
|
|
|||||||
| Cash Flows From Financing Activities: |
||||||||||||
| Proceeds from borrowings on short-term debt |
6,661,464 | 1,458,341 | 697,499 | |||||||||
| Repayments on short-term debt |
(6,350,619) | (1,334,479) | (313,580) | |||||||||
| Proceeds from issuance of asset-backed securities |
- | 174,191 | 887,974 | |||||||||
| Repayments on asset-backed securities issued |
(584,400) | (683,532) | (492,561) | |||||||||
| Deferred securities issuance costs |
(9,184) | (4,486) | (4,503) | |||||||||
| Proceeds from issuance of long-term debt |
336,994 | - | - | |||||||||
| Repayments on long-term debt |
(27) | - | - | |||||||||
| Net settlements of derivatives |
(7) | (23,702) | (39,926) | |||||||||
| Net proceeds from issuance of common stock |
8,667 | 39,062 | 9,116 | |||||||||
| Net payments on repurchase of common stock |
- | - | (6,988) | |||||||||
| Taxes paid on equity award distributions |
(5,861) | (2,298) | (3,103) | |||||||||
| Dividends paid |
(94,413) | (82,278) | (100,686) | |||||||||
| Change in noncontrolling interests |
- | - | (15,259) | |||||||||
|
|
|
|
|
|
|
|||||||
| Net cash (used in) provided by financing activities |
(37,386) | (459,181) | 617,983 | |||||||||
|
|
|
|
|
|
|
|||||||
| Net increase (decrease) in cash and cash equivalents |
92,121 | (186,096) | 220,239 | |||||||||
| Cash and cash equivalents at beginning of period |
81,080 | 267,176 | 46,937 | |||||||||
|
|
|
|
|
|
|
|||||||
| Cash and cash equivalents at end of period |
$ | 173,201 | $ | 81,080 | $ | 267,176 | ||||||
|
|
|
|
|
|
|
|||||||
| Supplemental Cash Flow Information: |
||||||||||||
| Cash paid during the period for: |
||||||||||||
| Interest |
$ | 85,418 | $ | 114,908 | $ | 106,757 | ||||||
| Taxes |
3,397 | 312 | 51 | |||||||||
| Supplemental Noncash Information: |
||||||||||||
| Real estate securities retained from loan securitizations |
$ | 392,932 | $ | 143,885 | $ | - | ||||||
| Retention of mortgage servicing rights from loan securitizations and sales |
44,063 | 7,329 | - | |||||||||
| Transfers from loans held-for-investment to loans held-for-sale |
- | - | 393,304 | |||||||||
| Transfers from residential loans to real estate owned |
4,711 | 8,970 | 11,258 | |||||||||
| (1) | For the year ended December 31, 2012, the proceeds from sales of loans included in investing activities related to residential loans that were reclassified from loans held-for-investment to loans held-for-sale during the fourth quarter of 2011. |
The accompanying notes are an integral part of these consolidated financial statements.
F-9
REDWOOD TRUST, INC. AND SUBSIDIARIES
NOTES TO CONSOLIDATED FINANCIAL STATEMENTS
December 31, 2013
Note 1. Redwood Trust
Redwood Trust, Inc., together with its subsidiaries, is an internally-managed specialty finance company focused on engaging in residential and commercial mortgage banking activities and investing in mortgage- and other real estate-related assets. We seek to invest in real estate-related assets that have the potential to generate attractive cash flow returns over time and to generate income through our mortgage banking activities. We operate our business in three segments: residential mortgage banking, residential investments, and commercial mortgage banking and investments.
Our primary sources of income are net interest income from our investment portfolios and income from our mortgage banking activities. Net interest income consists of the interest income we earn less the interest expenses we incur on borrowed funds and other liabilities. Income from mortgage banking activities consists of the profit we seek to generate through the acquisition or orgination of loans and their subsequent sale or securitization. References herein to “Redwood,” the “company,” “we,” “us,” and “our” include Redwood Trust, Inc. and its consolidated subsidiaries, unless the context otherwise requires. We assume a range of risks in our investments and the level of risk is influenced by, among other factors, the manner in which we finance our purchases of, and derive income from, our investments.
Redwood was incorporated in the State of Maryland on April 11, 1994, and commenced operations on August 19, 1994. Our executive offices are located at One Belvedere Place, Suite 300, Mill Valley, California 94941.
Note 2. Basis of Presentation
The consolidated financial statements presented herein are at December 31, 2013 and 2012, and for the years ended December 31, 2013, 2012, and 2011. These consolidated financial statements have been prepared in conformity with generally accepted accounting principles (“GAAP”) in the United States of America — as prescribed by the Financial Accounting Standards Board’s (“FASB”) Accounting Standards Codification (“ASC”) — and using the Securities and Exchange Commission’s (“SEC”) instructions to Form 10-K.
In 2013, we began presenting the income from and the fair market valuations related to mortgage servicing rights in a separate line on our consolidated statements of income, “mortgage servicing rights, income, net.” As MSRs have become a larger component of our balance sheet, we believe this change more clearly presents the full impact to our earnings from our investments in these assets. Additionally, in 2013, we began presenting market valuation changes for our retained Sequoia interest-only (“IO”) securities in mortgage banking activities. This change better aligns our reported results with the economics underlying our residential mortgage banking activities as we utilize our retained Sequoia IO securities in part as an economic hedge to manage interest rate risk on our inventory of residential mortgage loans held for future sale and those indentified for purchase. For each of these changes, we have conformed the presentation of prior periods for consistency of comparison. Additionally, certain other prior year amounts have been reclassified in the consolidated financial statements and the related footnotes to conform to the 2013 presentation.
Organization
For tax purposes, Redwood Trust, Inc. is structured as a real estate investment trust (“REIT”). The REIT entity also owns various qualified and taxable REIT subsidiaries. Our consolidated financial statements include the accounts of Redwood, its direct and indirect wholly-owned subsidiaries, and other entities in which we have a controlling financial interest. All significant intercompany balances and transactions have been eliminated. Our consolidated subsidiaries include both qualifying REIT subsidiaries and taxable subsidiaries. References to the REIT include Redwood and its qualifying REIT subsidiaries, excluding taxable subsidiaries.
We sponsor our Sequoia securitization program, which we use for the securitization of residential mortgage loans. References to Sequoia with respect to any time or period generally refer collectively to all the then consolidated Sequoia securitization entities for the periods presented. We have also engaged in securitization transactions in order to obtain financing for certain of our securities and commercial loans. We previously engaged in other securitization transactions through the Acacia program, which was used for the securitization of mortgage-backed securities and other types of financial assets. References to Acacia generally refer collectively to the consolidated Acacia securitization entities for the periods presented.
Financial Information About Industry Segments
FASB ASC 280, Segment Reporting, establishes standards for reporting financial and descriptive information about an enterprise’s reportable segments. Our three business segments are residential mortgage banking, residential investments, and commercial mortgage banking and investments.
F-10
REDWOOD TRUST, INC. AND SUBSIDIARIES
NOTES TO CONSOLIDATED FINANCIAL STATEMENTS
December 31, 2013
Note 2. Basis of Presentation - (continued)
See Note 21 for further discussion on business segments.
Principles of Consolidation
We apply FASB guidance to determine whether we must consolidate transferred financial assets and variable interest entities (“VIEs”) for financial reporting purposes. We currently consolidate the assets and liabilities of the Sequoia securitization entities where we maintain an ongoing involvement, as well as an entity formed in connection with a resecuritization transaction we engaged in during 2011 (“Residential Resecuritization”), and an entity formed in connection with a commercial securitization we engaged in during the fourth quarter of 2012 (“Commercial Securitization”). Prior to December 31, 2012, we consolidated the assets and liabilities of certain Acacia securitization entities. Additionally, prior to the fourth quarter of 2011, we also consolidated the assets, liabilities, and noncontrolling interests of the Opportunity Fund (“Fund”) that we managed. Each securitization entity is independent of Redwood and of each other and the assets and liabilities are not owned by and are not legal obligations of Redwood Trust, Inc. Our exposure to these entities is primarily through the financial interests we have retained, although we are exposed to certain financial risks associated with our role as a sponsor, manager, or depositor of these entities or as a result of our having sold assets directly or indirectly to these entities.
For financial reporting purposes, the underlying loans and securities owned at the consolidated Sequoia entities, the Residential Resecuritization entity, and the Commercial Securitization entity are shown under residential and commercial loans and real estate securities on our consolidated balance sheets. The asset-backed securities (“ABS”) issued to third parties by these entities are shown under ABS issued. In our consolidated statements of income, we record interest income on the loans and securities owned at these entities and interest expense on the ABS issued by these entities. We also recorded interest income and expense on the securities and ABS at previously consolidated Acacias and on the securities owned at the Fund and any income attributable to noncontrolling interest holders during prior periods.
See Note 4 for further discussion on principles of consolidation.
Note 3. Summary of Significant Accounting Policies
Use of Estimates
The preparation of financial statements requires us to make a number of significant estimates. These include estimates of fair value of certain assets and liabilities, amounts and timing of credit losses, prepayment rates, and other estimates that affect the reported amounts of certain assets and liabilities as of the date of the consolidated financial statements and the reported amounts of certain revenues and expenses during the reported period. It is likely that changes in these estimates (e.g., valuation changes due to supply and demand, credit performance, prepayments, interest rates, or other reasons) will occur in the near term. Our estimates are inherently subjective in nature and actual results could differ from our estimates and the differences could be material.
Fair Value Measurements
Our financial statements include assets and liabilities that are measured at their estimated fair values in accordance with GAAP. A fair value measurement represents the price at which an orderly transaction would occur between willing market participants at the measurement date. We develop fair values for financial assets or liabilities based on available inputs and pricing that is observed in the marketplace. Examples of market information that we attempt to obtain include the following:
| • | Quoted prices for the same or similar securities; |
| • | Relevant reports issued by analysts and rating agencies; |
| • | The current level of interest rates and any directional movements in relevant indices, such as credit risk indices; |
| • | Information about the performance of mortgage loans, such as delinquency and foreclosure rates, loss experience, and prepayment rates; |
| • | Indicative prices or yields from broker/dealers (including prices from counterparties under securities repurchase agreements); and, |
| • | Other relevant observable inputs, including nonperformance risk and liquidity premiums. |
F-11
REDWOOD TRUST, INC. AND SUBSIDIARIES
NOTES TO CONSOLIDATED FINANCIAL STATEMENTS
December 31, 2013
Note 3. Summary of Significant Accounting Policies - (continued)
After considering all available indications of the appropriate rate of return that market participants would require, we consider the reasonableness of the range indicated by the results to determine an estimate that is most representative of fair value.
The markets for many of the loans and securities that we invest in and issue are generally illiquid. Establishing fair values for illiquid assets and liabilities is inherently subjective and is often dependent upon our estimates and modeling assumptions. If we determine that either the volume and/or level of trading activity for an asset or liability has significantly decreased from normal market conditions, or price quotations or observable inputs are not associated with orderly transactions, the market inputs that we obtain might not be relevant. For example, broker or pricing service quotes might not be relevant if an active market does not exist for the financial asset or liability. The nature of the quote (for example, whether the quote is an indicative price or a binding offer) is also evaluated.
In circumstances where relevant market inputs cannot be obtained, increased analysis and management judgment are required to estimate fair value. This generally requires us to establish internal assumptions about future cash flows and appropriate risk-adjusted discount rates. Regardless of the valuation inputs we apply, the objective of fair value measurement is unchanged from what it would be if markets were operating at normal activity levels and/or transactions were orderly; that is, to determine the current exit price.
See Note 5 for further discussion on fair value measurements.
Fair Value Option
We have the option to measure eligible financial assets, financial liabilities, and commitments at fair value on an instrument-by-instrument basis. This option is available when we first recognize a financial asset or financial liability or enter into a firm commitment. Subsequent changes in the fair value of assets, liabilities, and commitments where we have elected the fair value option are recorded in our consolidated statements of income.
During 2013, we elected the fair value option for certain residential and commercial loans, Sequoia IO securities and MSRs. We generally elect the fair value option for residential and commercial loans that are held-for-sale, due to our intent to sell or securitize the loans in the near-term. We generally elect the fair value option for Sequoia IO securities as we use these in part to hedge certain risks associated with our residential loans held-for-sale. We elected the fair value option for our MSRs in order to reflect the current value of these investments in our financial position and results each period.
See Note 5 for further discussion on the fair value option.
Real Estate Loans
Residential and Commercial Loans — Held-for-Sale
Residential and commercial loans held-for-sale include loans that we are marketing for sale to third parties, including transfers to securitization entities that we plan to sponsor and expect to be accounted for as sales for financial reporting purposes.
Residential and Commercial Loans — Fair Value
We generally elect the fair value option for residential and commercial loans that we purchase with the intent to sell to third parties or transfer to Sequoia securitizations. Coupon interest is recognized as revenue when earned and deemed collectible or until a loan becomes more than 90 days past due. Changes in fair value are recurring and are reported through our consolidated statements of income in mortgage banking activities, net for residential and commercial loans held at fair value.
Residential and Commercial Loans — Lower of Cost or Fair Value
Certain residential and commercial loans held-for-sale that are not accounted for under the fair value option (generally loans acquired prior to 2011) are carried at the lower of their cost or fair value. If the fair value of an individual loan or pool of loans held-for-sale is lower than its amortized cost basis, this difference is reported through our consolidated statements of income as a negative market valuation adjustment in mortgage banking activities, net. Coupon interest for loans held-for-sale is recognized as revenue when earned and deemed collectible or until a loan becomes more than 90 days past due at which point it is placed on non-accrual status. Gains or losses on the sale of residential or commercial loans held-for-sale are based on the specific identification method for loans measured on an individual basis or in aggregate for those loans measured on a pool basis.
F-12
REDWOOD TRUST, INC. AND SUBSIDIARIES
NOTES TO CONSOLIDATED FINANCIAL STATEMENTS
December 31, 2013
Note 3. Summary of Significant Accounting Policies - (continued)
Residential and Commercial Loans — Held-for-Investment
Loans held-for-investment include residential loans owned at consolidated Sequoia entities and commercial loans owned at the Commercial Securitization entity and by us, net of any allowance for loan losses. Coupon interest is recognized as revenue when earned and deemed collectible or until a loan becomes more than 90 days past due or has been individually impaired, at which point the loan is placed on nonaccrual status. Interest previously accrued for loans that have become greater than 90 days past due or individually impaired is reserved for in the allowance for loan losses. Residential loans delinquent more than 90 days or in foreclosure are characterized as a serious delinquency. Cash principal and interest that is advanced from servicers subsequent to a loan becoming greater than 90 days past due or individually impaired is accounted for as a reduction in the outstanding loan principal balance. When a seriously delinquent loan previously placed on nonaccrual status has cured, meaning all delinquent principal and interest have been remitted by the borrower, the loan is placed back on accrual status. Alternately, loans that have been individually impaired may be placed back on accrual status if restructured and after the loan is considered reperforming. A restructured loan is considered reperforming when the loan has been current for at least 12 months.
We use the interest method to determine an effective yield to amortize the premium or discount on real estate loans held-for-investment. For residential loans acquired prior to July 1, 2004, we use coupon interest rates as they change over time and anticipated principal payments to determine periodic amortization. For residential and commercial loans acquired after July 1, 2004, we use the initial coupon interest rate of the loans (without regard to future changes in the underlying indices) and anticipated principal payments, if any, to determine periodic amortization.
We reclassify loans held-for-investment as loans held-for-sale if we determine that these loans will be sold or transferred to third parties. This may occur, for example, if we exercise our right to call ABS issued by a Sequoia securitization trust and decide to subsequently sell the underlying loans to third parties.
See Note 6 for further discussion on residential loans. See Note 7 for further discussion on commercial loans.
Residential Loans — Allowance for Loan Losses
For residential loans classified as held-for-investment, we establish and maintain an allowance for loan losses based on our estimate of credit losses inherent in our loan portfolios at the reporting date. To calculate the allowance for loan losses, we assess inherent losses by determining loss factors (defaults, the timing of defaults, and loss severities upon defaults) that can be specifically applied to each loan or pool of loans.
We consider the following factors in evaluating the allowance for loan losses:
| • | Ongoing analyses of loans, including, but not limited to, the age of loans and year of origination, underwriting standards, business climate, economic conditions, and other observable data; |
| • | Historical loss rates and past performance of similar loans; |
| • | Relevant market research and publicly available third-party reference loss rates; |
| • | Trends in delinquencies and charge-offs; |
| • | Effects and changes in credit concentrations; |
| • | Information supporting a borrower’s ability to meet obligations; |
| • | Ongoing evaluations of fair values of collateral using current appraisals and other valuations; and, |
| • | Discounted cash flow analyses. |
F-13
REDWOOD TRUST, INC. AND SUBSIDIARIES
NOTES TO CONSOLIDATED FINANCIAL STATEMENTS
December 31, 2013
Note 3. Summary of Significant Accounting Policies - (continued)
Once we determine the amount of defaults, the timing of the defaults, and severity of losses upon the defaults, we estimate expected losses for each individual loan or pool of loans over its expected life. We then estimate the timing of these losses and the losses probable to occur over an appropriate loss confirmation period. This period is defined as the range of time between the occurrence of a credit loss (such as the initial deterioration of the borrower’s financial condition) and the confirmation of that loss (the actual impairment or charge-off of the loan). The losses expected to occur within the estimated loss confirmation period are the basis of our allowance for loan losses, since we believe these losses exist at the reported date of the financial statements. We re-evaluate the adequacy of our allowance for loan losses quarterly.
As part of the loss mitigation efforts undertaken by servicers of residential loans owned at Sequoia securitization entities, a number of loan modifications have been completed to help make mortgage loans more affordable for certain borrowers. Loan modifications may include, but are not limited to: (i) conversion of a floating rate mortgage loan into a fixed rate mortgage loan; (ii) reduction in the contractual interest rate of a mortgage loan; (iii) forgiveness of a portion of the contractual interest and/or principal amounts owed on a mortgage loan; and, (iv) extension of the contractual maturity of a mortgage loan. We evaluate all loan modifications performed by servicers to determine if they constitute troubled debt restructurings (“TDRs”) according to GAAP. If a loan is determined to be a TDR, it is removed from the general loan pools used for calculating allowances for loan losses and assessed for impairment on an individual basis based upon any adverse change in the expected future cash flows resulting from the modification. This difference is recorded to the provision for loan losses in our consolidated statements of income.
When foreclosed property is received in full satisfaction for a defaulted loan, we estimate the fair value of the property, based on estimated net proceeds from the sale of the property (including servicer advances and other costs). To the extent that the fair value of the property is below the recorded investment of the loan, we record a charge against the allowance for loan losses for the difference. Foreclosed property is subsequently recorded as real estate owned (“REO”), a component of other assets on our consolidated balance sheets. Actual losses incurred on loans liquidated through a short-sale are also charged against the allowance for loan losses.
See Note 6 for further discussion on the allowance for loan losses for residential loans.
Commercial Loans — Allowance for Loan Losses
For commercial loans classified as held-for-investment, we establish and maintain a general allowance for loan losses inherent in our portfolio at the reporting date and, where appropriate, a specific allowance for loan losses for loans we have determined to be impaired at the reporting date. An individual loan is considered impaired when it is deemed probable that we will not be able to collect all amounts due according to the contractual terms of the loan.
Our methodology for assessing the adequacy of the allowance for loan losses begins with a formal review of each commercial loan in the portfolio and the assignment of an internal impairment status. Reviews are performed at least quarterly. We consider the following factors in evaluating each loan:
| • | Loan to value ratios upon origination or acquisition of the loan; |
| • | The most recent financial information available for each loan and associated properties, including net operating income, debt service coverage ratios, occupancy rates, rent rolls, as well as any other loss factors we consider relevant, such as, but not limited to, specific loan trigger events that would indicate an adverse change in expected cash flows or payment delinquency; |
| • | Economic trends, both macroeconomic as well as those directly affecting the properties associated with our loans, and the supply and demand of competing projects in the sub-market in which the subject property is located; and, |
| • | The loan sponsor or borrowing entity’s ability to ensure that properties associated with the loan are managed and operated sufficiently. |
Loan reviews are completed by asset management and finance personnel and reviewed and approved by senior management.
Based on the assigned internal impairment status, a loan is categorized as “Pass,” “Watch List,” or “Workout.” Pass loans are defined as loans that are performing in accordance with the contractual terms of the loan agreement. Watch List loans are defined as performing loans for which the timing of cost recovery is under review. Workout loans are defined as loans that we believe have a credit impairment that may lead to a realized loss. Workout loans are typically assessed for impairment on an individual basis. Where an individual commercial loan is impaired, we record an allowance to reduce the carrying value of the loan to the current present value of expected future cash flows discounted at the loan’s effective rate or if a loan is collateral dependent, we reduce the carrying value to the estimated fair market value of the loan, with a corresponding charge to provision for loan losses on our consolidated statements of income.
F-14
REDWOOD TRUST, INC. AND SUBSIDIARIES
NOTES TO CONSOLIDATED FINANCIAL STATEMENTS
December 31, 2013
Note 3. Summary of Significant Accounting Policies - (continued)
For all commercial loans that are not individually impaired, we assess the commercial loan portfolio in aggregate for loan losses based on our expectation of credit losses inherent in the portfolio at the reporting date. Our expectation of credit losses is informed by, among other things:
| • | Historical loss rates and past performance of similar loans in our own portfolio, if any; |
| • | Publicly available third-party reference loss rates on similar loans; and, |
| • | Trends in delinquencies and charge-offs in our own portfolio and among industry participants. |
See Note 7 for further discussion on the allowance for loan losses for commercial loans.
Repurchase Reserves
We sell residential mortgage loans to various parties, including (1) securitization trusts, (2) Fannie Mae and Freddie Mac (the “Agencies”), and (3) other financial institutions that purchase mortgage loans for investment or private label securitization. We may be required to repurchase residential mortgage loans in the event of a breach of specified contractual representation and warranties. We do not originate residential mortgage loans and believe the initial risk of loss due to loan repurchases (i.e., due to a breach of representations and warranties) would generally be a contingency to the companies from whom we acquired the loans. However, in some cases, for example, where loans were acquired from companies that have since become insolvent, repurchase claims may result in our being liable for a repurchase obligation.
We establish reserves for mortgage repurchase liabilities related to various representations and warranties that reflect management’s estimate of losses for loans for which we could have a repurchase obligation, based on a combination of factors. Such factors can include estimated future defaults and loan repurchase rates, the potential severity of loss in the event of defaults, and the probability of our being liable for a repurchase obligation. We establish a liability at the time loans are sold and continually update our liability estimate during its life. The liability for mortgage loan repurchase losses is included in other liabilities on our consolidated balance sheets and the related expense is included as a component of mortgage banking activities, net on our consolidated statements of income.
See Note 15 for further discussion on the residential repurchase reserves.
We have originated and sold commercial mortgage loans and have made standard representations and warranties upon sale of the loans to the loan purchasers, and in some cases, to securitization trusts. We review the need for a repurchase reserve related to these commercial loans on an ongoing basis and are not aware of any breaches of representations and warranties related to these loans.
Real Estate Securities, at Fair Value
We classify our real estate securities as trading or available-for-sale securities. We use the “prime” or “non-prime” designation to categorize our residential securities based upon the general credit characteristics of the residential loans underlying each security at the time of origination. For example, prime residential loans are generally characterized by lower loan-to-value (“LTV”) ratios at the time the loans were originated, and are made to borrowers with higher Fair Isaac Corporation (“FICO”) scores. Non-prime residential loans are generally characterized by higher LTV ratios at the time the loans were originated and may have been made to borrowers with lower credit scores or impaired credit histories (while exhibiting the ability to repay their loans) at the time the loan was originated. Regardless of whether or not the loans underlying a residential security were designated as prime or non-prime at origination, there is a risk that the borrower may not be able to repay the loan.
Trading Securities
We primarily denote trading securities as those securities where we have adopted the fair value option. Trading securities may include residential, commercial, and collateralized debt obligation (“CDO”) securities. Trading securities are carried at their estimated fair values. Coupon interest is recognized as interest income when earned and deemed collectible. Changes in the fair value of Sequoia IO securities designated as trading securities are reported in mortgage banking activities, net, a component of our consolidated statements of income. Changes in the fair value of other trading securities are reported through our consolidated statements of income in other market valuation adjustments, net.
F-15
REDWOOD TRUST, INC. AND SUBSIDIARIES
NOTES TO CONSOLIDATED FINANCIAL STATEMENTS
December 31, 2013
Note 3. Summary of Significant Accounting Policies - (continued)
Available-for-Sale Securities
AFS securities primarily consist of non-agency residential mortgage backed securities (“RMBS”) and may include other residential and commercial securities. Non-agency RMBS are not issued or guaranteed by a federally chartered corporation, such as Fannie Mae or Freddie Mac, or any agency of the U.S. Government. AFS securities are carried at their estimated fair value with unrealized gains and losses excluded from earnings (except when an other-than-temporary impairment (“OTTI”) is recognized, as discussed below) and reported in accumulated other comprehensive income/(loss) (“AOCI”), a component of stockholders’ equity.
Interest income on AFS securities is accrued based on their outstanding principal balance and contractual terms and interest income is recognized based on the security’s effective interest rate. In order to calculate the effective interest rate, we must project cash flows over the remaining life of each security and make assumptions with regards to interest rates, prepayment rates, the timing and amount of credit losses, and other factors. On at least a quarterly basis, we review and, if appropriate, make adjustments to our cash flow projections based on input and analysis received from external sources, internal models, and our own judgments about interest rates, prepayment rates, the timing and amount of credit losses, and other factors. Changes in cash flows from those originally projected, or from those estimated at the last evaluation, may result in a prospective change in the yield/interest income recognized on these securities or in the recognition of OTTI as discussed below.
For AFS securities purchased and held at a discount, a portion of the discount may be designated as non-accretable purchase discount (“credit reserve”), based on the cash flows we have projected for the security. The amount designated as credit reserve may be adjusted over time, based on our periodic evaluation of projected cash flows. If the performance of a security with a credit reserve is more favorable than previously forecasted, a portion of the credit reserve may be reallocated to accretable discount and recognized into interest income over time. Conversely, if the performance of a security with a credit reserve is less favorable than forecasted, the amount designated as credit reserve may be increased, or impairment charges and write-downs of such securities to a new cost basis could result.
When the fair value of an AFS security is less than its amortized cost at the reporting date, the security is considered impaired. We assess our impaired securities at least quarterly to determine if the impairment is temporary or other-than-temporary (resulting in an OTTI). If we either — (i) intend to sell the impaired security; (ii) will more likely than not be required to sell the impaired security before it recovers in value; or (iii) if there has been an adverse change in cash flows — the impairment is deemed an OTTI. In the case of criteria (i) and (ii), we record the entire difference between the security’s estimated fair value and its amortized cost at the reporting date in our consolidated statements of income. If there has been an adverse change in cash flows, only the portion of the OTTI related to “credit” losses is recognized through other market valuation adjustments, net on our consolidated statements of income, with the remaining “non-credit” portion recognized through AOCI on the consolidated balance sheets. If the first two criteria are not met and there has not been an adverse change in cash flows, the impairment is considered temporary and the entire unrealized loss is recognized through AOCI on our consolidated balance sheets.
For impaired AFS securities, to determine if there has been an adverse change in cash flows and if any portion of a resulting OTTI is related to credit losses, we compare the present value of the cash flows expected to be collected as of the current financial reporting date to the amortized cost basis of the security. The discount rate used to calculate the present value of expected future cash flows is the current yield used for income recognition purposes. If the present value of the current expected cash flows is less than the amortized cost basis, there has been an adverse change and the security is considered OTTI with the difference between these two amounts representing the credit loss. The determination as to whether an OTTI exists and, if so, the amount of credit impairment recognized in earnings is subjective, as such determinations are based on information available at the time of assessment as well as our estimates of future performance and cash flow projections. As a result, the timing and amount of OTTI constitute a material estimate that is susceptible to significant change.
See Note 8 for further discussion on real estate securities.
MSRs
We recognize MSRs through the retention of servicing rights associated with residential mortgage loans that we have acquired and subsequently transferred to third parties or through the direct acquisition of MSRs sold by third parties. Typically, our MSRs are created through the transfer of loans to a third party or to a Sequoia residential mortgage securitization sponsored by us that meets the GAAP criteria for sale accounting.
F-16
REDWOOD TRUST, INC. AND SUBSIDIARIES
NOTES TO CONSOLIDATED FINANCIAL STATEMENTS
December 31, 2013
Note 3. Summary of Significant Accounting Policies - (continued)
Our MSRs are held and managed at Redwood Residential Acquisition Corporation, a wholly-owned subsidiary of RWT Holdings, Inc., which is a taxable REIT subsidiary of ours. We contract with a licensed sub-servicer to perform servicing functions for loans associated with our MSRs. We have elected the fair value option for all of our MSRS, and they are initially recognized and carried at their estimated fair values. Income from MSRs and changes in the estimated fair value of MSRs are reported in MSR income, net, a component of our consolidated statements of income.
See Note 9 for further discussion on MSRs.
Cash and Cash Equivalents
Cash and cash equivalents include non-restricted cash and highly liquid investments with original maturities of three months or less.
Restricted Cash
Restricted cash primarily includes principal and interest payments that are collateral for, or payable to, owners of ABS issued by consolidated securitization entities. Restricted cash may also include cash retained in the Sequoia securitization entities or in the Residential Resecuritization or Commercial Securitization entities prior to the payments on or redemptions of outstanding ABS issued.
Accrued Interest Receivable
Accrued interest receivable includes interest that is due and payable to us and deemed collectible. Cash interest is generally received within thirty days of recording the receivable. For financial assets where we have elected the fair value option, the associated accrued interest receivable on these assets is measured at fair value. For financial assets where we have not elected the fair value option, the associated accrued interest carrying values approximate fair values.
Derivative Financial Instruments
Derivative financial instruments we typically utilize include contractual interest rate agreements, financial futures contracts, and “To Be Announced” (“TBA”) contracts. In addition, certain loan purchase commitments (“LPCs”) and loan forward sale commitments (“FSCs”) we enter into are treated as derivatives for financial reporting purposes in accordance with GAAP. All derivative financial instruments are recorded at fair value in our consolidated balance sheets. Derivatives with positive fair values to us are reported as assets and derivatives with negative fair values to us are reported as liabilities. We classify each of our derivative financial instruments as either (i) a trading instrument (no specific hedging designation for financial reporting purposes) or (ii) a hedge of a forecasted transaction or of the variability of cash flows to be received or paid related to a recognized asset or liability (cash flow hedge).
Changes in the fair values of derivatives accounted for as trading instruments, including any associated interest income or expense, are recorded in our consolidated statements of income through other market valuation adjustments, net. The valuation changes related to LPCs and FSCs as well as derivatives used to manage certain risks associated with the residential and commercial loans we own or plan to acquire and sell or securitize are excluded from other market valuation adjustments, net, and are included in mortgage banking activities, net, on our consolidated statements of income. Changes in the fair values of derivatives accounted for as cash flow hedges, to the extent they are effective, are recorded in accumulated other comprehensive income, a component of equity. Interest income or expense, and any ineffectiveness associated with these derivatives, are recorded as a component of net interest income in our consolidated statements of income. We measure the effective portion of cash flow hedges by comparing the change in fair value of the expected future variable cash flows of the derivative hedging instruments with the change in fair value of the expected future variable cash flows of the hedged item.
We will discontinue cash flow hedge accounting if (i) we determine that the hedging derivative is no longer expected to be effective in offsetting changes in the cash flows of the designated hedged item; (ii) the derivative expires or is sold, terminated, or exercised; (iii) the derivative is de-designated as a cash flow hedge; or, (iv) it is probable that a forecasted transaction associated with the hedged item will not occur by the end of the originally specified time period. To the extent we de-designate or terminate a cash flow hedging relationship and the associated hedged item continues to exist, any unrealized gain or loss of the cash flow hedge at the time of de-designation remains in accumulated other comprehensive income and is amortized using the straight-line method through interest expense over the remaining life of the hedged item.
F-17
REDWOOD TRUST, INC. AND SUBSIDIARIES
NOTES TO CONSOLIDATED FINANCIAL STATEMENTS
December 31, 2013
Note 3. Summary of Significant Accounting Policies - (continued)
Interest Rate Agreements
Interest rate agreements that we currently utilize include swaps and swaptions. Interest rate swaps are agreements in which (i) one counterparty exchanges a stream of fixed interest payments for another counterparty’s stream of variable interest cash flows; or, (ii) each counterparty exchanges variable interest cash flows that are referenced to different indices. Interest rate swaptions are agreements that provide the owner the right but not the obligation to enter into an underlying interest rate swap with a counterparty in the future. Interest rate caps are agreements in which the owner receives payments at the end of each period for which the prevailing interest rate exceeds an agreed upon strike price. We enter into interest rate agreements primarily to reduce significant changes in our income or equity caused by interest rate volatility. Certain of these interest rate agreements may be designated as cash flow hedges.
Eurodollar Futures, Financial Futures and TBA Contracts
Eurodollar futures are futures contracts on time deposits denominated in U.S. dollars at banks outside the United States. Eurodollar futures, unlike our other derivatives, have maturities of only three months. Therefore, in order to achieve the desired interest rate offset necessary to manage our risk, consecutively maturing contracts are required, resulting in a stated notional amount that is typically higher than our other derivatives. Financial futures are futures contracts on benchmark U.S. Treasury rates. TBA contracts are forward contracts to purchase mortgage-backed securities that will be issued by a U.S. government sponsored enterprise (“GSE”) in the future. We purchase or sell these derivatives to offset — to varying degrees — changes in the values of mortgage products for which we have exposure to interest rate volatility.
Loan Purchase and Forward Sale Commitments
LPCs are agreements with third-party residential loan originators to purchase residential loans at a future date. LPCs that qualify as derivatives are recorded at their estimated fair values on our consolidated balance sheets. Changes in fair value are recurring and are reported through our consolidated statements of income in mortgage banking activities, net. We also enter into FSCs with third-parties to sell residential loans at a future date. FSCs that qualify as derivatives are recorded at their estimated fair values on our consolidated balance sheets. Changes in fair value are recurring and are reported through our consolidated statements of income in mortgage banking activities, net.
See Note 10 for further discussion on derivative financial instruments.
Deferred Tax Assets and Liabilities
Our deferred tax assets/liabilities are generated by temporary differences in GAAP and taxable income at our taxable subsidiaries. These differences generally reflect differing accounting treatments for GAAP and tax, such as accounting for mortgage servicing rights, discount and premium amortization, credit losses, equity awards, asset impairments, and certain valuation estimates. As a result of these differences, we may recognize taxable income in periods prior to when we recognize income for GAAP. When this occurs, we pay the tax liability as required and establish a deferred tax asset for GAAP. As the income is subsequently realized in future periods under GAAP, the deferred tax asset is reduced. We may also recognize GAAP income in periods prior to when we recognize income for tax. When this occurs, we establish a deferred tax liability for GAAP. As the income is subsequently realized in future periods for tax, the deferred tax liability is reduced.
In assessing the realizability of deferred tax assets, we consider whether it is more likely than not that some portion or all of the deferred tax assets will not be realized. The ultimate realization of deferred tax assets is dependent upon the generation of future taxable income during the periods in which those temporary differences become deductible. We consider historical and projected future taxable income and capital gains as well as tax planning strategies in making this assessment. We determine the extent to which realization of this deferred asset is not assured and establish a valuation allowance accordingly. The estimate of net deferred tax assets could change in future periods to the extent that actual or revised estimates of future taxable income during the carryforward periods change from current expectations.
Deferred Securities Issuance Costs
Securities issuance costs are expenses associated with the issuance of long-term debt, and the ABS issued from the Residential Resecuritization, the Commercial Securitization, and Sequoia securitization entities we sponsor and consolidate for financial reporting purposes. These expenses typically include underwriting, rating agency, legal, accounting, and other fees. ABS issuance
F-18
REDWOOD TRUST, INC. AND SUBSIDIARIES
NOTES TO CONSOLIDATED FINANCIAL STATEMENTS
December 31, 2013
Note 3. Summary of Significant Accounting Policies - (continued)
costs associated with liabilities accounted for under the fair value option are expensed as incurred. ABS issuance costs associated with liabilities reported at cost are deferred. Deferred securities issuance costs are reported on our consolidated balance sheets as deferred charges (an asset) and are amortized as an adjustment to interest expense using the interest method, based upon the actual and estimated repayment schedules of the related securities issued.
Other Assets
Other assets include margin and investment receivable, REO, income tax receivables, fixed assets, principal receivable, and other prepaid expenses and receivables.
REO property acquired through, or in lieu of, foreclosure is initially recorded at fair value, and subsequently reported at the lower of its carrying amount or fair value (less estimated cost to sell). Changes in the fair value of an REO property that has a fair value at or below its carrying amount are recorded in our consolidated statements of income as a component of other market valuation adjustments, net. Margin receivable reflects cash collateral we have posted with various counterparties relating to our derivative and lending agreements with those counterparties, as applicable.
See Note 11 for further discussion on other assets.
Short-Term Debt
Short-term debt includes borrowings under master repurchase agreements, loan warehouse facilities, and other forms of borrowings that expire within one year with various counterparties. These borrowings may be unsecured or collateralized by cash, loans, or securities. If the value (as determined by the applicable counterparty) of the collateral securing those borrowings decreases, we may be subject to margin calls during the period the borrowings are outstanding. In instances where we do not satisfy the margin calls within the required time frame, the counterparty may retain the collateral and pursue any outstanding debt amount from us.
See Note 12 for further discussion on short-term debt.
Accrued Interest Payable
Accrued interest payable includes interest that is due and payable to third parties. Interest is generally paid within one to three months of recording the payable, based upon our remittance requirements, and is paid semi-annually for our convertible debt. For borrowings where we have elected the fair value option, the associated accrued interest on these liabilities is measured at fair value. For financial liabilities where we have not elected the fair value option, the associated accrued interest carrying values approximate fair values.
Asset-Backed Securities Issued
The majority of the liabilities reported on our consolidated balance sheets represent ABS issued by bankruptcy-remote entities sponsored by Redwood. Sequoia, Acacia, the Residential Resecuritization, and the Commercial Securitization assets are held in the custody of securitization trustees and are not owned by Redwood. These trustees collect principal and interest payments (less servicing and related fees) from the assets and make corresponding principal and interest payments to the ABS investors.
Residential Resecuritization, Commercial Securitization, and Sequoia ABS Issued
Residential Resecuritization, Commercial Securitization, and Sequoia ABS issued are carried at their unpaid principal balances net of any unamortized discount or premium.
Acacia ABS Issued
Prior to December 31, 2013, we consolidated certain Acacia securitization entities. Acacia ABS issued were accounted for under the fair value option and carried at their estimated fair values. Changes in fair value (gains or losses) were reported in our consolidated statements of income through other market valuation adjustments, net.
See Note 13 for further discussion on ABS issued.
F-19
REDWOOD TRUST, INC. AND SUBSIDIARIES
NOTES TO CONSOLIDATED FINANCIAL STATEMENTS
December 31, 2013
Note 3. Summary of Significant Accounting Policies - (continued)
Long-Term Debt
Commercial Borrowings
Commercial borrowings include borrowings under a master repurchase agreement that expires in more than one year with a financial institution counterparty. These borrowings are collateralized by commercial loans. If the value (as determined by the applicable counterparty) of the collateral securing those borrowings decreases, we may be subject to margin calls during the period the borrowings are outstanding. In instances where we do not satisfy the margin calls within the required time frame, the counterparty may retain the collateral and pursue any outstanding debt amount from us.
Convertible Notes
Convertible notes include unsecured convertible senior notes and are carried at their unpaid principal balance. Interest on the notes is payable semiannually and the notes mature on April 15, 2018. If converted by a holder, upon conversion, the holder of the notes would receive shares of our common stock.
Trust Preferred Securities and Subordinated Notes
Trust preferred securities and subordinated notes are carried at their unpaid principal balance. This long-term debt is unsecured with quarterly interest payments determined based upon a floating rate equal to the three-month London Interbank Offered Rate (“LIBOR”) plus a margin until it is redeemed in whole or matures at a future date.
See Note 14 for further discussion on long-term debt.
Equity
Accumulated Other Comprehensive Income (Loss)
Net unrealized gains and losses on real estate securities available-for-sale and interest rate agreements designated as cash flow hedges are reported as components of accumulated other comprehensive income on our consolidated statements of changes in equity and our consolidated balance sheets. Net unrealized gains and losses on securities and interest rate agreements held by our taxable subsidiaries that are reported in other comprehensive income are adjusted for the effects of taxation and may create deferred tax assets or liabilities.
Earnings Per Common Share
Basic earnings per common share (“EPS”) is computed by dividing net income allocated to common shareholders by the weighted average common shares outstanding. Net income allocated to common shareholders represents net income allocable to common shareholders, less income allocated to participating securities (as described herein). Diluted EPS is computed by dividing income allocated to common shareholders by the weighted average common shares outstanding plus amounts representing the dilutive effect of share-based payment awards and the assumed conversion of convertible notes to common shares.
The two-class method is an earnings allocation formula under which EPS is calculated for common stock and participating securities according to dividends declared and participating rights in undistributed earnings. Under this method, all earnings (distributed and undistributed) are allocated between participating securities and common shares based on their respective rights to receive dividends or dividend equivalents. Accounting guidance on EPS defines vested and unvested share-based payment awards containing nonforfeitable rights to dividends or dividend equivalents as participating securities that are included in computing EPS under the two-class method.
See Note 16 for further discussion on equity.
Incentive Plans
In May 2013, our shareholders approved an amendment and restatement to our previously amended 2002 Redwood Trust, Inc. Incentive Plan (“Incentive Plan”) for executive officers, employees, and non-employee directors. The amendment provided, among other things, for an increase in the number of shares available for distribution under the plan. The Incentive Plan authorizes our Board
F-20
REDWOOD TRUST, INC. AND SUBSIDIARIES
NOTES TO CONSOLIDATED FINANCIAL STATEMENTS
December 31, 2013
Note 3. Summary of Significant Accounting Policies - (continued)
of Directors (or a committee appointed by our Board of Directors) to grant incentive stock options (“ISOs”), non-qualifying stock options (“NQSOs”), performance stock units (“PSUs”), deferred stock units (“DSUs”), restricted stock, performance shares, performance units, stock appreciation rights, limited stock appreciation rights (awards), and dividend equivalent rights (“DERs”) to eligible recipients other than non-employee directors. Long-term incentive awards granted under the Incentive Plan generally vest over a three- or four-year period. Awards made under the Incentive Plan to officers and other employees in lieu of the payment in cash of a portion of annual bonuses earned generally vest immediately, but are subject to a three-year mandatory holding period. Non-employee directors are also provided annual awards under the Incentive Plan that generally vest immediately. The cost of the awards is amortized over the vesting period on a straight-line basis.
Employee Stock Purchase Plan
In May 2013, our shareholders approved an amendment to our previously amended 2002 Redwood Trust, Inc. Employee Stock Purchase Plan (“ESPP”) to increase the number of shares available under the ESPP. The purpose of the ESPP is to give our employees an opportunity to acquire an equity interest in the Company through the purchase of shares of common stock at a discount. The ESPP allows eligible employees to purchase common stock at 85% of its fair value, subject to certain limits. Fair value as defined under the ESPP is the lesser of the closing market price of the common stock on the first day of the calendar year or the last day of the calendar quarter.
Executive Deferred Compensation Plan
In November 2013, our Board of Directors approved an amendment to our 2002 Executive Deferred Compensation Plan (“EDCP”) to allow non-employee directors to defer certain cash payments and dividends into DSUs. The EDCP allows eligible employees and directors to defer portions of current salary and certain other forms of compensation. The Company matches some deferrals. Compensation deferred under the EDCP is recorded as a liability on our consolidated balance sheets. The EDCP allows for the investment of deferrals in either an interest crediting account or DSUs.
401(k) Plan
We offer a tax-qualified 401(k) Plan to all employees for retirement savings. Under this Plan, employees are allowed to defer and invest up to 100% of their cash earnings, subject to the maximum 401(k) Plan contribution limit set forth by the Internal Revenue Service. We match some employee contributions to encourage participation and to provide a retirement planning benefit to employees. Plan matching contributions made by the Company for the years ended December 31, 2013, 2012, and 2011 were $0.2 million, $0.3 million, and $0.4 million, respectively. Vesting of the 401(k) Plan matching contributions is based on the employee’s tenure at the Company, and over time an employee becomes increasingly vested in both prior and new matching contributions.
See Note 17 for further discussion on equity compensation plans.
Taxes
We have elected to be taxed as a REIT under the Internal Revenue Code and the corresponding provisions of state law. To qualify as a REIT we must distribute at least 90% of our annual REIT taxable income to shareholders (not including taxable income retained in our taxable subsidiaries) within the time frame set forth in the tax code and also meet certain other requirements related to assets, income, and stock ownership. We assess our tax positions for all open tax years and record tax benefits only if tax positions meet a more-likely-than-not threshold in accordance with FASB guidance on accounting for uncertainty in income taxes. We classify interest and penalties on material uncertain tax positions as interest expense and operating expense, respectively, in our consolidated statements of income.
See Note 20 for further discussion on taxes.
Recent Accounting Pronouncements
In December 2011, FASB issued Accounting Standards Update (“ASU”) 2011-11, Disclosures about Offsetting Assets and Liabilities. This ASU requires the presentation of gross and net information about transactions that are (1) offset in the financial statements or (2) subject to an enforceable master netting arrangement or similar agreement, regardless of whether the transactions are actually offset in the statement of financial position. The ASU is effective prospectively for fiscal years beginning on or after January 1, 2013. We adopted ASU 2011-11 in the first quarter of 2013 and, as a result, presented disclosures on financial assets and liabilities subject to master netting agreements, which can be found below in this Note 3.
F-21
REDWOOD TRUST, INC. AND SUBSIDIARIES
NOTES TO CONSOLIDATED FINANCIAL STATEMENTS
December 31, 2013
Note 3. Summary of Significant Accounting Policies - (continued)
In February 2013, the FASB issued ASU 2013-02, Reporting of Amounts Reclassified Out of Accumulated Other Comprehensive Income, which adds new disclosure requirements for items reclassified out of accumulated other comprehensive income. The ASU does not amend any existing requirements for reporting net income or other comprehensive income in the financial statements and is effective prospectively for reporting periods beginning after December 15, 2012. We adopted ASU 2013-02 in the first quarter of 2013 and, as a result, expanded our disclosures related to items reclassified out of accumulated other comprehensive income. These disclosures can be found in Note 16.
Balance Sheet Netting
Certain of our derivatives, loan warehouse, and repurchase agreements are subject to master netting arrangements or similar agreements. Under GAAP, in certain circumstances we may elect to present certain financial assets, liabilities and related collateral subject to master netting arrangements in a net position on our consolidated balance sheets. However, we do not report any of these financial assets or liabilities on a net basis, and instead present them on a gross basis on our consolidated balance sheets.
The table below presents financial assets and liabilities that are subject to master netting arrangements or similar agreements categorized by financial instrument, together with corresponding financial instruments and corresponding collateral received or pledged at December 31, 2013 and 2012.
Offsetting of Financial Assets, Liabilities, and Collateral
| Gross | Gross Amounts |
Net Amounts of Assets |
Gross Amounts Not Offset in Consolidated Balance Sheet (1) |
|||||||||||||||||||||
| December 31, 2013 (In Thousands) |
Amounts of
Recognized Assets (Liabilities) |
Offset
in Consolidated Balance Sheet |
(Liabilities) Presented in Consolidated Balance Sheet |
Financial Instruments |
Cash Collateral (Received) Pledged |
Net Amount | ||||||||||||||||||
| Assets (2) |
||||||||||||||||||||||||
| Interest rate agreements |
$ | 6,566 | $ | - | $ | 6,566 | $ | (5,402) | $ | - | $ | 1,164 | ||||||||||||
| TBAs |
1,138 | - | 1,138 | (656) | (482) | - | ||||||||||||||||||
| Futures |
- | - | - | - | - | - | ||||||||||||||||||
|
|
|
|
|
|
|
|
|
|
|
|
|
|||||||||||||
| Total Assets |
$ | 7,704 | $ | - | $ | 7,704 | $ | (6,058) | $ | (482) | $ | 1,164 | ||||||||||||
|
|
|
|
|
|
|
|
|
|
|
|
|
|||||||||||||
| Liabilities (2) |
||||||||||||||||||||||||
| Interest rate agreements |
$ | (16,599) | $ | - | $ | (16,599) | $ | 5,402 | $ | 11,197 | $ | - | ||||||||||||
| TBAs |
(661) | - | (661) | 656 | 5 | - | ||||||||||||||||||
| Futures |
(528) | - | (528) | - | 528 | - | ||||||||||||||||||
| Loan warehouse debt |
(184,789) | - | (184,789) | 184,789 | - | - | ||||||||||||||||||
| Security repurchase agreements |
(677,974) | - | (677,974) | 677,974 | - | - | ||||||||||||||||||
| Commercial borrowings |
(49,467) | - | (49,467) | 49,467 | - | - | ||||||||||||||||||
|
|
|
|
|
|
|
|
|
|
|
|
|
|||||||||||||
| Total Liabilities |
$ | (930,018) | $ | - | $ | (930,018) | $ | 918,288 | $ | 11,730 | $ | - | ||||||||||||
|
|
|
|
|
|
|
|
|
|
|
|
|
|||||||||||||
F-22
REDWOOD TRUST, INC. AND SUBSIDIARIES
NOTES TO CONSOLIDATED FINANCIAL STATEMENTS
December 31, 2013
Note 3. Summary of Significant Accounting Policies - (continued)
| Gross | Gross Amounts |
Net Amounts of Assets |
Gross Amounts Not Offset in Consolidated Balance Sheet (1) |
|||||||||||||||||||||
| December 31, 2012 (In Thousands) |
Amounts of
Recognized Assets (Liabilities) |
Offset
in Consolidated Balance Sheet |
(Liabilities) Presented in Consolidated Balance Sheet |
Financial Instruments |
Cash Collateral (Received) Pledged |
Net Amount | ||||||||||||||||||
| Assets (2) |
||||||||||||||||||||||||
| Interest rate agreements |
$ | 2,972 | $ | - | $ | 2,972 | $ | (2,210) | $ | - | $ | 762 | ||||||||||||
| TBAs |
- | - | - | - | - | - | ||||||||||||||||||
| Futures |
- | - | - | - | - | - | ||||||||||||||||||
|
|
|
|
|
|
|
|
|
|
|
|
|
|||||||||||||
| Total Assets |
$ | 2,972 | $ | - | $ | 2,972 | $ | (2,210) | $ | - | $ | 762 | ||||||||||||
|
|
|
|
|
|
|
|
|
|
|
|
|
|||||||||||||
| Liabilities (2) |
||||||||||||||||||||||||
| Interest rate agreements |
$ | (50,476) | $ | - | $ | (50,476) | $ | 2,210 | $ | 48,266 | $ | - | ||||||||||||
| TBAs |
- | - | - | - | - | - | ||||||||||||||||||
| Futures |
(607) | - | (607) | - | 607 | - | ||||||||||||||||||
| Loan warehouse debt |
(179,982) | - | (179,982) | 179,982 | - | - | ||||||||||||||||||
| Security repurchase agreements |
(371,936) | - | (371,936) | 371,936 | - | - | ||||||||||||||||||
|
|
|
|
|
|
|
|
|
|
|
|
|
|||||||||||||
| Total Liabilities |
$ | (603,001) | $ | - | $ | (603,001) | $ | 554,128 | $ | 48,873 | $ | - | ||||||||||||
|
|
|
|
|
|
|
|
|
|
|
|
|
|||||||||||||
| (1) | Amounts presented in these columns are limited in total to the net amount of assets or liabilities presented in the prior column by instrument. In certain cases, there is excess cash collateral or financial assets we have pledged to a counterparty that exceed the financial liabilities subject to a master netting arrangement or similar agreement. Additionally, in certain cases, counterparties have pledged excess cash collateral to us that exceeds our corresponding financial assets. In each case, these excess amounts are excluded from the table although they are separately reported in our consolidated balance sheets as assets or liabilities, respectively. |
| (2) | Interest rate agreements, TBAs, and futures are components of derivatives instruments on our consolidated balances sheets. Loan warehouse debt, which is secured by residential mortgage loans, and security repurchase agreements are components of short-term debt on our consolidated balance sheets. Commercial borrowings are a component of long-term debt on our consolidated balance sheets. |
For each category of financial instrument set forth in the table above, the assets and liabilities resulting from individual transactions within that category between Redwood and a counterparty are subject to a master netting arrangement or similar agreement with that counterparty that provides for individual transactions to be treated as a single transaction. In the event of the termination and close-out any of those transactions, the corresponding master netting arrangement or similar agreement provides for settlement on a net basis and for settlement to include the proceeds of the liquidation of any corresponding collateral, subject to certain limitations on termination, settlement, and liquidation of collateral that may apply in the event of the bankruptcy or insolvency of a party that should not inhibit the eventual practical realization of the principal benefits of those transactions or the corresponding master netting arrangement or similar agreement and any corresponding collateral.
Note 4. Principles of Consolidation
GAAP requires us to consider whether securitizations and other transfers of financial assets should be treated as sales or financings, as well as whether any VIEs – for example, certain legal entities often used in securitization and other structured finance transactions – should be included in our consolidated financial statements. The GAAP principles we apply require us to reassess our requirement to consolidate VIEs each quarter and therefore our determination may change based upon new facts and circumstances pertaining to each VIE. This could result in a material impact to our consolidated financial statements during subsequent reporting periods.
F-23
REDWOOD TRUST, INC. AND SUBSIDIARIES
NOTES TO CONSOLIDATED FINANCIAL STATEMENTS
December 31, 2013
Note 4. Principles of Consolidation - (continued)
Analysis of Consolidated VIEs
The VIEs we are required to consolidate include certain Sequoia securitization entities, the Residential Resecuritization entity, and the Commercial Securitization entity. Each of these entities is independent of Redwood and of each other and the assets and liabilities are not owned by and are not legal obligations of ours, although we are exposed to certain financial risks associated with our role as the sponsor or manager of these entities as well as from retained financial interests we hold in certain of these entities. Prior to December 31, 2012, we were also required to consolidate certain Acacia securitization entities. The following table presents a summary of the assets and liabilities of these VIEs. Intercompany balances have been eliminated for purposes of this presentation.
Assets and Liabilities of Consolidated VIEs
| December 31, 2013 (Dollars in Thousands) |
Sequoia
Entities |
Residential Resecuritization |
Commercial Securitization |
Total | ||||||||||||
| Residential loans, held-for-investment |
$ | 1,762,167 | $ | - | $ | - | $ | 1,762,167 | ||||||||
| Commercial loans, held-for-investment |
- | - | 257,741 | 257,741 | ||||||||||||
| Real estate securities, at fair value |
- | 263,204 | - | 263,204 | ||||||||||||
| Restricted cash |
152 | - | 137 | 289 | ||||||||||||
| Accrued interest receivable |
2,714 | 627 | 1,975 | 5,316 | ||||||||||||
| Other assets |
3,661 | - | 7,198 | 10,859 | ||||||||||||
|
|
|
|
|
|
|
|
|
|||||||||
| Total Assets |
$ | 1,768,694 | $ | 263,831 | $ | 267,051 | $ | 2,299,576 | ||||||||
|
|
|
|
|
|
|
|
|
|||||||||
| Accrued interest payable |
$ | 1,218 | $ | 11 | $ | 720 | $ | 1,949 | ||||||||
| Asset-backed securities issued |
1,694,335 | 94,934 | 153,693 | 1,942,962 | ||||||||||||
|
|
|
|
|
|
|
|
|
|||||||||
| Total Liabilities |
$ | 1,695,553 | $ | 94,945 | $ | 154,413 | $ | 1,944,911 | ||||||||
|
|
|
|
|
|
|
|
|
|||||||||
| Number of VIEs |
24 | 1 | 1 | 26 | ||||||||||||
| December 31, 2012 (Dollars in Thousands) |
Sequoia
Entities |
Residential Resecuritization |
Commercial Securitization |
Total | ||||||||||||
| Residential loans, held-for-investment |
$ | 2,272,812 | $ | - | $ | - | $ | 2,272,812 | ||||||||
| Commercial loans, held-for-investment |
- | - | 283,610 | 283,610 | ||||||||||||
| Real estate securities, at fair value |
- | 324,606 | - | 324,606 | ||||||||||||
| Restricted cash |
147 | - | 137 | 284 | ||||||||||||
| Accrued interest receivable |
4,484 | 839 | 2,132 | 7,455 | ||||||||||||
| Other assets |
4,245 | - | 105 | 4,350 | ||||||||||||
|
|
|
|
|
|
|
|
|
|||||||||
| Total Assets |
$ | 2,281,688 | $ | 325,445 | $ | 285,984 | $ | 2,893,117 | ||||||||
|
|
|
|
|
|
|
|
|
|||||||||
| Accrued interest payable |
$ | 2,103 | $ | 40 | $ | 832 | $ | 2,975 | ||||||||
| Asset-backed securities issued |
2,193,481 | 164,746 | 171,714 | 2,529,941 | ||||||||||||
|
|
|
|
|
|
|
|
|
|||||||||
| Total Liabilities |
$ | 2,195,584 | $ | 164,786 | $ | 172,546 | $ | 2,532,916 | ||||||||
|
|
|
|
|
|
|
|
|
|||||||||
| Number of VIEs |
24 | 1 | 1 | 26 | ||||||||||||
We consolidate the assets and liabilities of certain Sequoia securitization entities, as we did not meet the GAAP sale criteria at the time we transferred financial assets to these entities. Our involvement in consolidated Sequoia entities continues in the following ways: (i) we continue to hold subordinate investments in each entity, and for certain entities, more senior investments; (ii) we maintain certain discretionary rights associated with our sponsorship of, or our subordinate investments in, each entity; and (iii) we continue to hold a right to call the assets of certain entities (once they have been paid down below a specified threshold) at a price equal to, or in excess of, the current outstanding principal amount of the entity’s asset-backed securities issued. These factors have resulted in our continuing to consolidate the assets and liabilities of these Sequoia entities in accordance with GAAP.
F-24
REDWOOD TRUST, INC. AND SUBSIDIARIES
NOTES TO CONSOLIDATED FINANCIAL STATEMENTS
December 31, 2013
Note 4. Principles of Consolidation - (continued)
During 2012, we sold previously retained variable interests in certain Sequoia securitization entities originally issued between 2001 and 2007 and determined, upon completion of an accounting analysis, that we should deconsolidate certain entities and derecognize the associated assets and liabilities of these entities for financial reporting purposes. We derecognized $961 million of residential loans and other assets, net of $27 million of allowance for loan losses and $970 million of ABS issued and other liabilities, and after giving effect to all other accounting entries recognized a realized gain of $21 million, which was recorded on our consolidated statement of income for the year ended December 31, 2012. These gains were comprised of both recoveries of provisions for loan losses that exceeded our recorded investment in these entities as well as cash received from the sale of our investment interests. We maintained our intent to hold our economic interests in all remaining consolidated Sequoia entities at December 31, 2013.
We consolidate the assets and liabilities of the Residential Resecuritization entity as we did not meet the GAAP sale criteria at the time the financial assets were transferred to this entity based on our role in the entity’s inception and design. We transferred senior residential securities to Credit Suisse First Boston Mortgage Securities Corp., which subsequently sold them to CSMC 2011-9R, the Residential Resecuritization entity. In connection with this transaction, we acquired certain senior and subordinate securities that we continue to hold. We engaged in the Residential Resecuritization primarily for the purpose of obtaining permanent non-recourse financing on a portion of our senior residential securities portfolio. Our credit risk exposure is largely unchanged as a result of engaging in the transaction, as we remain economically exposed to the financed securities through our senior and subordinate investment in the Residential Resecuritization.
We consolidate the assets and liabilities of the Commercial Securitization entity, as we did not meet the GAAP sale criteria at the time the financial assets were transferred to this entity based on our role in the entity’s inception and design. We transferred subordinate commercial loans to RCMC 2012-CREL1, a securitization entity. In connection with this transaction, we acquired certain subordinate securities that we continue to hold. We engaged in the Commercial Securitization primarily for the purpose of obtaining permanent non-recourse financing on a portion of our commercial mezzanine portfolio. Our credit risk exposure is largely unchanged as a result of engaging in the transaction, as we remain economically exposed to the financed loans through our subordinate investment in the Commercial Securitization.
Prior to 2012, we consolidated the assets, liabilities, and noncontrolling interests of the Fund, as we determined that we were the primary beneficiary of this VIE. Our ongoing asset management responsibilities provided us with the power to direct the activities that most significantly impacted the Fund’s economic performance, and our general and limited partnership interests provided us with the obligation to absorb losses or the right to receive benefits that were significant. In the second quarter of 2011, the Fund sold all of its remaining investments. After all partners received final distributions in the fourth quarter of 2011, we deconsolidated the Fund and recognized a loss on deconsolidation of less than $1 million in our consolidated statements of income through realized gains on sales and calls, net.
Analysis of Unconsolidated VIEs with Continuing Involvement
During the years ended December 31, 2013 and 2012, we transferred residential loans to 12 and six Sequoia securitization entities sponsored by us, respectively, and accounted for these transfers as sales for financial reporting purposes, in accordance with ASC 860. We also determined we were not the primary beneficiary of these VIEs as we lacked the power to direct the activities that will have the most significant economic impact on the entities. For the transferred loans where we held the servicing rights prior to the transfer and continue to hold the servicing rights, we recorded MSRs on our consolidated balance sheets, and classified those MSRs as Level 3 assets. We also retained senior and subordinate securities in these securitizations that we classified as Level 3 assets.
The following table presents information related to the Sequoia securitization transactions that occurred during the years ended December 31, 2013 and 2012.
Securitization Activity Related to Unconsolidated VIEs Sponsored by Redwood
| Year Ended December 31, | ||||||||
| (In Thousands) |
2013 | 2012 | ||||||
| Principal balance of loans transferred |
$ | 5,578,298 | $ | 1,971,884 | ||||
| Trading securities retained, at fair value |
105,320 | 38,633 | ||||||
| AFS securities retained, at fair value |
301,072 | 110,390 | ||||||
| Gains on sale |
- | 17,931 | ||||||
| MSRs recognized |
42,921 | 7,329 | ||||||
F-25
REDWOOD TRUST, INC. AND SUBSIDIARIES
NOTES TO CONSOLIDATED FINANCIAL STATEMENTS
December 31, 2013
Note 4. Principles of Consolidation - (continued)
Our continuing involvement in these securitizations is limited to customary servicing obligations associated with retaining residential MSRs (which we retain a third-party servicer to perform) and the receipt of interest income associated with the securities we retained. The following table summarizes the cash flows between us and the 12 and six unconsolidated Sequoia VIEs sponsored by us for the years ended December 31, 2013 and 2012.
Cash Flows Related to Unconsolidated VIEs Sponsored by Redwood
| Year Ended December 31, | ||||||||
| (In Thousands) |
2013 | 2012 | ||||||
| Cash proceeds |
$ | 4,670,082 | $ | 1,882,413 | ||||
| MSR fees received |
9,128 | 807 | ||||||
| Funding of compensating interest |
(475) | (109) | ||||||
| Cash flows received on retained securities |
43,032 | 8,352 | ||||||
The following table presents the key weighted-average assumptions to measure MSRs at the date of securitization.
MSR Assumptions Related to Unconsolidated VIEs Sponsored by Redwood
| Issued During Year Ended December 31, | ||||||||
| At Date of Securitization |
2013 | 2012 | ||||||
| Prepayment speeds |
5 - 14 % | 5 - 22 % | ||||||
| Discount rates |
12 % | 11 % | ||||||
The following table presents additional information at December 31, 2013 and 2012, related to unconsolidated Sequoia securitizations sponsored by us during the years ended December 31, 2013 and 2012.
Unconsolidated VIEs Sponsored by Redwood at December 31, 2013 and 2012
| December 31, | ||||||||
| (In Thousands) |
2013 | 2012 | ||||||
| On-balance sheet assets, at fair value: |
||||||||
| Interest-only securities, classified as trading |
$ | 110,505 | $ | 10,409 | ||||
| Senior and subordinate securities, classified as AFS |
405,415 | 113,681 | ||||||
| Maximum loss exposure (1) |
515,920 | 124,090 | ||||||
| Principal balance of loans outstanding |
6,627,874 | 1,736,331 | ||||||
| (1) | Maximum loss exposure from our involvement with unconsolidated VIEs pertains to the carrying value of our securities retained from these VIEs and represents estimated losses that would be incurred under severe, hypothetical circumstances, such as if the value of our interests and any associated collateral declines to zero. This does not include, for example, any potential exposure to representation and warranty claims associated with our initial transfer of loans into a securitization. |
F-26
REDWOOD TRUST, INC. AND SUBSIDIARIES
NOTES TO CONSOLIDATED FINANCIAL STATEMENTS
December 31, 2013
Note 4. Principles of Consolidation - (continued)
The following table presents key economic assumptions for assets retained from unconsolidated VIEs and the sensitivity of their fair values to immediate adverse changes in those assumptions at December 31, 2013 and 2012.
Key Assumptions and Sensitivity Analysis for Unconsolidated VIEs Sponsored by Redwood
| December 31, 2013 (Dollars in Thousands) |
MSRs | Senior Interest-only Securities |
Subordinate Securities |
|||||||||
| Fair value at December 31, 2013 |
$ | 60,318 | $ | 110,505 | $ | 405,415 | ||||||
| Expected life (in years) (1) |
8 | 7 | 11 | |||||||||
| Prepayment speed assumption (annual CPR) (1) |
8 % | 10 % | 11 % | |||||||||
| Decrease in fair value from: |
||||||||||||
| 10% adverse change |
$ | 1,649 | $ | 5,773 | $ | 1,658 | ||||||
| 25% adverse change |
4,218 | 13,555 | 4,354 | |||||||||
| Discount rate assumption (1) |
11 % | 5 % | 6 % | |||||||||
| Decrease in fair value from: |
||||||||||||
| 100 basis point increase |
$ | 2,468 | $ | 5,632 | $ | 30,644 | ||||||
| 200 basis point increase |
4,828 | 10,757 | 57,836 | |||||||||
| Credit loss assumption (1) |
N/A | 0.23 % | 0.23 % | |||||||||
| Decrease in fair value from: |
||||||||||||
| 10% higher losses |
N/A | $ | 70 | $ | 1,369 | |||||||
| 25% higher losses |
N/A | 175 | 3,420 | |||||||||
| December 31, 2012 (Dollars in Thousands) |
MSRs | Senior Interest-only Securities |
Subordinate Securities |
|||||||||
| Fair value at December 31, 2012 |
$ | 5,315 | $ | 10,409 | $ | 113,681 | ||||||
| Expected life (in years) (1) |
3 | 3 | 10 | |||||||||
| Prepayment speed assumption (annual CPR) (1) |
33 % | 29 % | 24 % | |||||||||
| Decrease in fair value from: |
||||||||||||
| 10% adverse change |
$ | 351 | $ | 724 | $ | 858 | ||||||
| 25% adverse change |
812 | 1,674 | 1,909 | |||||||||
| Discount rate assumption (1) |
12 % | 17 % | 6 % | |||||||||
| Decrease in fair value from: |
||||||||||||
| 100 basis point increase |
$ | 121 | $ | 20 | $ | 901 | ||||||
| 200 basis point increase |
235 | 40 | 1,791 | |||||||||
| Credit loss assumption (1) |
N/A | 0.48 % | 0.47 % | |||||||||
| Decrease in fair value from: |
||||||||||||
| 10% higher losses |
N/A | $ | 5 | $ | 578 | |||||||
| 25% higher losses |
N/A | 12 | 1,446 | |||||||||
| (1) | Expected life, prepayment speed assumption, discount rate assumption, and credit loss assumption presented in the tables above represent weighted averages. |
F-27
REDWOOD TRUST, INC. AND SUBSIDIARIES
NOTES TO CONSOLIDATED FINANCIAL STATEMENTS
December 31, 2013
Note 4. Principles of Consolidation - (continued)
Continuing Involvement with VIEs with No Economic Interest
During 2012, we sold all of our remaining economic interests in Acacia entities and, pursuant to an accounting analysis, deconsolidated the Acacia entities and derecognized the associated assets and liabilities for financial reporting purposes. We maintain limited continuing involvement through our role as collateral manager for all but one of these Acacia entities. Our role as collateral manager has, under the terms of the applicable management agreements, been significantly curtailed or eliminated with respect to the Acacia entities, as all but one of these entities have experienced events of default. We will continue to receive the collateral management fees for these entities, which have decreased significantly and will continue to do so as the balances on which the fees are determined continue to decline.
Analysis of Third-Party Sponsored VIEs
Third-party VIEs are securitization entities for which we maintain an economic interest but do not sponsor. Our economic interest may include several securities from the same third-party VIE, and in those cases, the analysis is performed in consideration of all of our interests. The following table presents a summary of our interests in third-party VIEs at December 31, 2013, grouped by collateral type.
Third-Party Sponsored VIE Summary
| (Dollars in Thousands) |
December 31, 2013 | |||
| Residential real estate securities at Redwood |
||||
| Senior |
$ | 598,646 | ||
| Re-REMIC |
176,376 | |||
| Subordinate |
128,715 | |||
|
|
|
|||
| Total Investments in Third-Party Real Estate Securities |
$ | 903,737 | ||
|
|
|
|||
We determined that we are not the primary beneficiary of any third-party residential, commercial, or CDO entities, as we do not have the required power to direct the activities that most significantly impact the economic performance of these entities. Specifically, we do not service or manage these entities or otherwise hold decision making powers that are significant. As a result of this assessment, we do not consolidate any of the underlying assets and liabilities of these third-party VIEs – we only account for our specific interests in them.
Our assessments of whether we are required to consolidate a VIE may change in subsequent reporting periods based upon changing facts and circumstances pertaining to each VIE. Any related accounting changes could result in a material impact to our financial statements.
Note 5. Fair Value of Financial Instruments
For financial reporting purposes, we follow a fair value hierarchy established under GAAP that is used to determine the fair value of financial instruments. This hierarchy prioritizes relevant market inputs in order to determine an “exit price” at the measurement date, or the price at which an asset could be sold or a liability could be transferred in an orderly process that is not a forced liquidation or distressed sale. Level 1 inputs are observable inputs that reflect quoted prices for identical assets or liabilities in active markets. Level 2 inputs are observable inputs other than quoted prices for an asset or liability that are obtained through corroboration with observable market data. Level 3 inputs are unobservable inputs (e.g., our own data or assumptions) that are used when there is little, if any, relevant market activity for the asset or liability required to be measured at fair value.
In certain cases, inputs used to measure fair value fall into different levels of the fair value hierarchy. In such cases, the level at which the fair value measurement falls is determined based on the lowest level input that is significant to the fair value measurement. Our assessment of the significance of a particular input requires judgment and considers factors specific to the asset or liability being measured.
F-28
REDWOOD TRUST, INC. AND SUBSIDIARIES
NOTES TO CONSOLIDATED FINANCIAL STATEMENTS
December 31, 2013
Note 5. Fair Value of Financial Instruments - (continued)
The following table presents the carrying values and estimated fair values of assets and liabilities that are required to be recorded or disclosed at fair value at December 31, 2013 and 2012.
| December 31, 2013 | December 31, 2012 | |||||||||||||||
| (In Thousands) |
Carrying Value |
Fair Value |
Carrying Value |
Fair Value |
||||||||||||
| Assets |
||||||||||||||||
| Residential loans, held-for-sale |
||||||||||||||||
| At fair value |
$ | 402,602 | $ | 402,602 | $ | 553,576 | $ | 553,576 | ||||||||
| At lower of cost or fair value |
1,665 | 1,817 | 9,082 | 9,324 | ||||||||||||
| Residential loans, held-for-investment |
1,762,167 | 1,610,024 | 2,272,812 | 2,062,352 | ||||||||||||
| Commercial loans, held-for-sale |
||||||||||||||||
| At fair value |
89,111 | 89,111 | - | - | ||||||||||||
| At lower of cost or fair value |
- | - | 8,500 | 8,500 | ||||||||||||
| Commercial loans, held-for-investment |
343,344 | 348,305 | 304,510 | 309,547 | ||||||||||||
| Trading securities |
124,555 | 124,555 | 33,172 | 33,172 | ||||||||||||
| Available-for-sale securities |
1,558,306 | 1,558,306 | 1,075,581 | 1,075,581 | ||||||||||||
| MSRs |
64,824 | 64,824 | 5,315 | 5,315 | ||||||||||||
| Cash and cash equivalents |
173,201 | 173,201 | 81,080 | 81,080 | ||||||||||||
| Restricted cash |
398 | 398 | 383 | 383 | ||||||||||||
| Accrued interest receivable |
13,475 | 13,475 | 12,442 | 12,442 | ||||||||||||
| Derivative assets |
7,787 | 7,787 | 2,972 | 2,972 | ||||||||||||
| REO (1) |
3,661 | 4,084 | 4,245 | 5,540 | ||||||||||||
| Margin receivable (1) |
31,149 | 31,149 | 63,424 | 63,424 | ||||||||||||
| Other collateral posted (1) |
5,000 | 5,000 | - | - | ||||||||||||
| Liabilities |
||||||||||||||||
| Short-term debt |
$ | 862,763 | $ | 862,763 | $ | 551,918 | $ | 551,918 | ||||||||
| Accrued interest payable |
6,366 | 6,366 | 4,592 | 4,592 | ||||||||||||
| Derivative liabilities |
18,167 | 18,167 | 51,081 | 51,081 | ||||||||||||
| ABS issued |
1,942,962 | 1,746,906 | 2,529,941 | 2,372,971 | ||||||||||||
| Commercial borrowings |
49,467 | 49,467 | - | - | ||||||||||||
| Convertible notes |
287,500 | 299,719 | - | - | ||||||||||||
| Other long-term debt |
139,500 | 111,600 | 139,500 | 90,675 | ||||||||||||
| (1) | These assets are included in Other Assets on our consolidated balance sheets. |
We elected the fair value option for $105 million and $42 million of residential senior securities that we acquired during the years ended December 31, 2013 and 2012, respectively, and $4 million of residential subordinate securities that we acquired during the year ended December 31, 2013. We also elected the fair value option for $7.09 billion and $1.31 billion of residential loans we acquired during the years ended December 31, 2013 and 2012, respectively. We anticipate electing the fair value option for all future purchases of residential loans that we intend to sell to third parties or transfer to Sequoia securitizations. We also elected the fair value option for $505 million of commercial senior loans we acquired during the year ended December 31, 2013. We did not elect the fair value option for any commercial loans originated or acquired in 2012. We have historically elected the fair value option for all commercial loans, trading securities, and ABS issued at Acacia entities, as well as certain third-party residential securities and CDOs.
F-29
REDWOOD TRUST, INC. AND SUBSIDIARIES
NOTES TO CONSOLIDATED FINANCIAL STATEMENTS
December 31, 2013
Note 5. Fair Value of Financial Instruments - (continued)
The following table presents the assets and liabilities that are reported at fair value on our consolidated balance sheets on a recurring basis as well as the fair value hierarchy of the valuation inputs used to measure fair value.
Assets and Liabilities Measured at Fair Value on a Recurring Basis
| December 31, 2013 (In Thousands) |
Carrying Value |
Fair Value Measurements Using | ||||||||||||||
| Level 1 | Level 2 | Level 3 | ||||||||||||||
| Assets |
||||||||||||||||
| Residential loans, at fair value |
$ | 402,602 | $ | - | $ | 11,502 | $ | 391,100 | ||||||||
| Commercial loans, at fair value |
89,111 | - | - | 89,111 | ||||||||||||
| Trading securities |
124,555 | - | - | 124,555 | ||||||||||||
| Available-for-sale securities |
1,558,306 | - | - | 1,558,306 | ||||||||||||
| MSRs |
64,824 | - | - | 64,824 | ||||||||||||
| Derivative assets |
7,787 | 1,139 | 6,648 | - | ||||||||||||
| Liabilities |
||||||||||||||||
| Derivative liabilities |
18,167 | 1,189 | 16,599 | 379 | ||||||||||||
| December 31, 2012 (In Thousands) |
Carrying Value |
Fair Value Measurements Using | ||||||||||||||
| Level 1 | Level 2 | Level 3 | ||||||||||||||
| Assets |
||||||||||||||||
| Residential loans, at fair value |
$ | 553,576 | $ | - | $ | - | $ | 553,576 | ||||||||
| Commercial loans, at fair value |
- | - | - | - | ||||||||||||
| Trading securities |
33,172 | - | - | 33,172 | ||||||||||||
| Available-for-sale securities |
1,075,581 | - | - | 1,075,581 | ||||||||||||
| Derivative assets |
2,972 | - | 2,972 | - | ||||||||||||
| MSRs |
5,315 | - | - | 5,315 | ||||||||||||
| Liabilities |
||||||||||||||||
| Derivative liabilities |
51,081 | 607 | 50,474 | - | ||||||||||||
The following table presents additional information about Level 3 assets and liabilities measured at fair value on a recurring basis for the years ended December 31, 2013 and 2012.
Changes in Level 3 Assets and Liabilities Measured at Fair Value on a Recurring Basis
| Assets | Liabilities | |||||||||||||||||||||||
| (In Thousands) |
Residential Loans |
Commercial Loans |
Trading Securities |
AFS Securities |
MSRs | Loan Purchase Commitments |
||||||||||||||||||
| Beginning balance - December 31, 2012 |
$ | 553,576 | $ | - | $ | 33,172 | $ | 1,075,581 | $ | 5,315 | $ | - | ||||||||||||
| Principal paydowns |
(16,166) | (189) | (1,244) | (162,708) | - | - | ||||||||||||||||||
| (Losses) gains in net income, net |
(34,650) | 8,694 | 41,074 | 57,852 | 11,995 | 480 | ||||||||||||||||||
| Unrealized losses in OCI, net |
- | - | - | (21,924) | - | - | ||||||||||||||||||
| Acquisitions |
7,090,724 | 505,151 | 109,320 | 785,671 | 47,514 | - | ||||||||||||||||||
| Sales |
(7,201,472) | (424,545) | (57,767) | (176,166) | - | - | ||||||||||||||||||
| Other settlements, net |
(912) | - | - | - | - | (101) | ||||||||||||||||||
|
|
|
|
|
|
|
|
|
|
|
|
|
|||||||||||||
| Ending Balance - December 31, 2013 |
$ | 391,100 | $ | 89,111 | $ | 124,555 | $ | 1,558,306 | $ | 64,824 | $ | 379 | ||||||||||||
|
|
|
|
|
|
|
|
|
|
|
|
|
|||||||||||||
F-30
REDWOOD TRUST, INC. AND SUBSIDIARIES
NOTES TO CONSOLIDATED FINANCIAL STATEMENTS
December 31, 2013
Note 5. Fair Value of Financial Instruments - (continued)
| Assets | Liabilities | |||||||||||||||||||||||||||
| Residential | Commercial | Trading Securities |
AFS Securities |
MSRs | Derivative Liabilities |
ABS Issued- Acacia |
||||||||||||||||||||||
| (In Thousands) |
Loans | Loans | ||||||||||||||||||||||||||
| Beginning balance - December 31, 2011 |
$ | - | $ | 12,129 | $ | 253,142 | $ | 728,695 | $ | - | $ | 19,500 | $ | 209,381 | ||||||||||||||
| Transfer to Level 3 |
- | - | - | - | - | - | - | |||||||||||||||||||||
| Principal paydowns |
(2,837) | (138) | (72,720) | (145,727) | - | - | (75,812) | |||||||||||||||||||||
| Gains (losses) in net income, net |
37,814 | 241 | 86,255 | 55,722 | (2,014) | 5,167 | 81,759 | |||||||||||||||||||||
| Unrealized gains in OCI, net |
- | - | - | 132,675 | - | - | - | |||||||||||||||||||||
| Acquisitions |
1,313,421 | - | 42,097 | 465,646 | 7,329 | - | - | |||||||||||||||||||||
| Sales |
(794,456) | - | (25,916) | (161,570) | - | - | - | |||||||||||||||||||||
| Derecognized assets and liabilities |
- | (12,232) | (250,382) | - | - | (17,700) | (233,689) | |||||||||||||||||||||
| Other settlements, net |
(366) | - | 696 | 140 | - | (6,967) | 18,361 | |||||||||||||||||||||
|
|
|
|
|
|
|
|
|
|
|
|
|
|
|
|||||||||||||||
| Ending Balance - December 31, 2012 |
$ | 553,576 | $ | - | $ | 33,172 | $ | 1,075,581 | $ | 5,315 | $ | - | $ | - | ||||||||||||||
|
|
|
|
|
|
|
|
|
|
|
|
|
|
|
|||||||||||||||
The following table presents the portion of gains or losses included in our consolidated statements of income that were attributable to Level 3 assets and liabilities recorded at fair value on a recurring basis and held at December 31, 2013, 2012, and 2011. Gains or losses incurred on assets or liabilities sold, matured, called, or fully written down during the years ended December 31, 2013, 2012, and 2011 are not included in this presentation.
Portion of Net Gains (Losses) Attributable to Level 3 Assets and Liabilities Still Held at December 31, 2013, 2012, and 2011 Included in Net Income
| Included in Net Income Years Ended December 31, |
||||||||||||
| (In Thousands) |
2013 | 2012 | 2011 | |||||||||
| Assets |
||||||||||||
| Residential loans, at fair value |
$ | (290) | $ | 11,725 | $ | - | ||||||
| Commercial loans, at fair value |
1,501 | - | (68) | |||||||||
| Trading securities |
32,496 | (14,076) | (18,128) | |||||||||
| Available-for-sale securities |
(1,108) | (2,509) | (7,852) | |||||||||
| MSRs |
14,196 | (1,571) | - | |||||||||
| Liabilities |
||||||||||||
| Derivative liabilities |
- | - | 2,499 | |||||||||
| Loan purchase commitments |
(379) | - | - | |||||||||
| ABS issued - Acacia |
- | - | 27,313 | |||||||||
The following table presents information on assets recorded at fair value on a non-recurring basis at December 31, 2013 and 2012. This table does not include the carrying value and gains or losses associated with the asset types below that were not recorded at fair value on our balance sheet at December 31, 2013 and 2012.
Assets and Liabilities Measured at Fair Value on a Non-Recurring Basis
| Gain (Loss) for | ||||||||||||||||||||
| December 31, 2013 | Carrying | Fair Value Measurements Using | Year Ended | |||||||||||||||||
| (In Thousands) |
Value | Level 1 | Level 2 | Level 3 | December 31, 2013 | |||||||||||||||
| Assets |
||||||||||||||||||||
| Residential loans, at lower of cost or fair value |
$ | 1,145 | $ | - | $ | - | $ | 1,145 | $ | - | ||||||||||
| REO |
1,518 | - | - | 1,518 | (270) | |||||||||||||||
F-31
REDWOOD TRUST, INC. AND SUBSIDIARIES
NOTES TO CONSOLIDATED FINANCIAL STATEMENTS
December 31, 2013
Note 5. Fair Value of Financial Instruments - (continued)
| Gain (Loss) for | ||||||||||||||||||||
| December 31, 2012 | Carrying | Fair Value Measurements Using | Year Ended | |||||||||||||||||
| (In Thousands) |
Value | Level 1 | Level 2 | Level 3 | December 31, 2012 | |||||||||||||||
| Assets |
||||||||||||||||||||
| Residential loans, at lower of cost or fair value |
$ | 2,707 | $ | - | $ | - | $ | 2,169 | $ | (275) | ||||||||||
| REO |
1,666 | - | - | 580 | (197) | |||||||||||||||
The following table presents the components of market valuation adjustments, net, recorded in our consolidated statements of income for the years ended December 31, 2013, 2012, and 2011.
Market Valuation Adjustments, Net
| Year Ended December 31, | ||||||||||||
| (In Thousands) |
2013 | 2012 | 2011 | |||||||||
| Other |
||||||||||||
| Residential loans, at lower of cost or fair value |
$ | 38 | $ | 623 | $ | 380 | ||||||
| Commercial loans, at fair value |
- | 241 | 616 | |||||||||
| Trading securities |
(3,525) | 97,867 | (9,293) | |||||||||
| Impairments on AFS securities |
(1,833) | (2,509) | (9,472) | |||||||||
| REO |
(612) | (344) | (1,624) | |||||||||
| Other derivative instruments, net |
223 | (12,581) | (47,937) | |||||||||
| ABS issued - Acacia |
- | (81,758) | 27,313 | |||||||||
|
|
|
|
|
|
|
|||||||
| Total other |
(5,709) | 1,539 | (40,017) | |||||||||
|
|
|
|
|
|
|
|||||||
| MSRs |
11,995 | (2,014) | - | |||||||||
| Mortgage banking activities |
||||||||||||
| Residential loans, at fair value |
(12,263) | 37,762 | - | |||||||||
| Commercial loans, at fair value |
8,694 | - | - | |||||||||
| Trading securities |
42,451 | (11,702) | - | |||||||||
| Derivative instruments, net |
51,162 | (10,609) | - | |||||||||
| Loan purchase and forward sale commitments |
(399) | - | - | |||||||||
|
|
|
|
|
|
|
|||||||
| Total mortgage banking activities |
89,645 | 15,451 | - | |||||||||
|
|
|
|
|
|
|
|||||||
| Total Market Valuation Adjustments, Net |
$ | 95,931 | $ | 14,976 | $ | (40,017) | ||||||
|
|
|
|
|
|
|
|||||||
Valuation Policy
We maintain a policy that specifies the methodologies we use to value different types of financial instruments. Significant changes to the valuation methodologies are reviewed by members of senior management to confirm the changes are appropriate and reasonable. Valuations based on information from external sources are performed on an instrument-by-instrument basis with the resulting amounts analyzed individually against internal calculations as well as in the aggregate by product type classification. Initial valuations are performed by our portfolio management group using the valuation processes described below. A subset of our finance department then independently reviews all fair value estimates using available market, portfolio, and industry information to ensure they are reasonable. Finally, members of senior management review all fair value estimates, including an analysis of valuation changes from prior reporting periods.
Valuation Process
We estimate fair values for financial assets or liabilities based on available inputs observed in the marketplace as well as unobservable inputs. We primarily use two pricing valuation techniques: market comparable pricing and discounted cash flow analysis. Market comparable pricing is used to determine the estimated fair value of certain instruments by incorporating known inputs and performance metrics, such as observed prepayment rates, delinquencies, credit support, recent transaction prices, pending transactions, or prices of other similar instruments. Discounted cash flow analysis techniques generally consist of developing an
F-32
REDWOOD TRUST, INC. AND SUBSIDIARIES
NOTES TO CONSOLIDATED FINANCIAL STATEMENTS
December 31, 2013
Note 5. Fair Value of Financial Instruments - (continued)
estimate of future cash flows that are expected to occur over the life of an instrument and then discounting those cash flows at a rate of return that results in an estimate of fair value. After considering all available indications of the appropriate rate of return that market participants would require, we consider the reasonableness of the range indicated by the results to determine an estimate that is most representative of fair value. We also consider counterparty credit quality and risk as part of our fair value assessments.
The following table provides quantitative information about the significant unobservable inputs used in the valuation of our Level 3 assets and liabilities measured at fair value.
Fair Value Methodology for Level 3 Financial Instruments
| December 31, 2013 (Dollars in Thousands) |
Fair Value |
Unobservable Input |
Range | Weighted Average |
||||||||||
| Assets |
||||||||||||||
| Residential loans, at fair value: |
||||||||||||||
| Loans priced to securitization and whole loan market, uncommitted to sell |
$ | 117,150 | Discount rate | 4 -4 % | 4 % | |||||||||
| Prepayment rate | 10 -10 % | 10 % | ||||||||||||
| Default rate | 1 - 1 % | 1 % | ||||||||||||
| Loss severity | 22 -22 % | 22 % | ||||||||||||
| Credit support | 8 - 8 % | 8 % | ||||||||||||
| Whole loan spread to securitization | 50 bps - 50 bps | 50 bps | ||||||||||||
| Loans priced to whole loan market, committed to sell |
273,950 | Pool fallout assumption | 15 bps - 15 bps | 15 bps | ||||||||||
| Residential loans, at lower of cost or fair value |
1,145 | Loss severity | 15-28 % | 21 % | ||||||||||
| Commercial loans, held for sale |
89,111 | Credit Spread | 161 bps - 161 bps | 161 bps | ||||||||||
| Credit Support | 22 - 22 % | 22 % | ||||||||||||
| Trading and AFS securities |
1,682,861 | Discount rate | 5 - 13 % | 6 % | ||||||||||
| Prepayment speed | 1 - 38 % | 14 % | ||||||||||||
| Default rate | 0 - 35 % | 7 % | ||||||||||||
| Loss severity | 20 - 66 % | 33 % | ||||||||||||
| Credit support | 0 - 53 % | 6 % | ||||||||||||
| MSRs |
64,824 | Discount rate | 9 - 11 % | 11 % | ||||||||||
| Prepayment rate | 6 - 60 % | 8 % | ||||||||||||
| REO |
1,518 | Historical loss adjustment | - % | - % | ||||||||||
Determination of Fair Value
A description of the instruments measured at fair value as well as the general classification of such instruments pursuant to the Level 1, Level 2, and Level 3 valuation hierarchy is listed herein. We generally use both market comparable information and discounted cash flow modeling techniques to determine the fair value of our Level 3 assets and liabilities. Use of these techniques requires determination of relevant inputs and assumptions, some of which represent significant unobservable inputs as indicated in the preceding table. Accordingly, a significant increase or decrease in any of these inputs – such as anticipated credit losses, prepayment speeds, interest rates, or other valuation assumptions – in isolation, would likely result in a significantly lower or higher fair value measurement.
Residential loans
Estimated fair values for residential loans are determined based on either an exit price to securitization or the whole loan market. For loans valued based on an exit to securitization, significant inputs in the valuation analysis are predominantly Level 3 in nature, due to the limited availability of market quotes on newly issued Residential Mortgage-Backed Securities (“RMBS”) and related inputs. Relevant market indicators that are factored into the analyses include third-party RMBS sales, pricing points for secondary sales of RMBS we have issued in past periods, yields for RMBS issued by government sponsored enterprises, indexed swap yields, credit rating agency guidance on expected credit enhancement levels for newly issued RMBS transactions, interest rates, and prepayment speeds (Level 3).
F-33
REDWOOD TRUST, INC. AND SUBSIDIARIES
NOTES TO CONSOLIDATED FINANCIAL STATEMENTS
December 31, 2013
Note 5. Fair Value of Financial Instruments - (continued)
Estimated fair values for conforming loans are determined based upon quoted market prices (Level 2). Conforming loans are mortgage loans that conform to Agency guidelines. As necessary, these values are adjusted for servicing value and market conditions and liquidity.
For loans valued based on an exit to the whole loan market, significant inputs in the valuation analysis are predominantly Level 3 in nature. Relevant market indicators that are factored into the analyses include prices on recent sales of our own whole loans, indexed swap yields, interest rates, prepayment speeds, and loss severities (Level 3). These assets would generally decrease in value based upon an increase in the loss severity assumption and would generally increase in value if the loss severity assumption were to decrease.
Commercial loans
Estimated fair values for commercial mezzanine loans are determined by both market comparable pricing and discounted cash flow analysis valuation techniques (Level 3). Our discounted cash flow models utilize certain significant unobservable inputs including the underwritten net operating income and debt coverage ratio assumptions and actual performance relative to those underwritten metrics. A decrease in these unobservable inputs will reduce the estimated fair value of the commercial loans.
Estimated fair values for commercial senior mortgage loans are determined by an exit price to securitization. Certain significant inputs in the valuation analysis are Level 3 in nature. Relevant market indicators that are factored into the analyses include third-party Commercial Mortgage-Backed Securities (“CMBS”) sales, pricing points for secondary sales of CMBS, yields for synthetic instruments that use CMBS bonds as an underlying index, indexed swap yields, credit rating agency guidance on expected credit enhancement levels for newly issued CMBS transactions, and interest rates (Level 3). In certain cases, commercial senior mortgage loans are valued based on third-party offers for the securities for purchase into securitization (Level 2).
Real estate securities
Real estate securities include residential, commercial, and other asset-backed securities that are generally illiquid in nature and trade infrequently. Significant inputs in the valuation analysis are predominantly Level 3 in nature, due to the lack of readily available market quotes and related inputs. For real estate securities, we utilize both market comparable pricing and discounted cash flow analysis valuation techniques. Relevant market indicators that are factored into the analyses include bid/ask spreads, the amount and timing of credit losses, interest rates, and prepayment speeds. Estimated fair values are based on applying the market indicators to generate discounted cash flows (Level 3). These cash flow models use significant unobservable inputs such as a discount rate, prepayment rate, default rate, loss severity and credit support. The estimated fair value of our securities would generally decrease based upon an increase in serious delinquencies. Conversely, the estimated fair value of our securities would generally increase if the prepayment rate or credit support inputs were to increase.
As part of our securities valuation process, we request and consider indications of value from third-party securities dealers. For purposes of pricing our securities at December 31, 2013, we received dealer price indications on 80% of our securities, representing 93% of our carrying value. In the aggregate, our internal valuations of the securities for which we received dealer price indications were 2% lower than the aggregate dealer valuations. Once we receive the price indications from dealers, they are compared to other relevant market inputs, such as actual or comparable trades, and the results of our discounted cash flow analysis. In circumstances where relevant market inputs cannot be obtained, increased reliance on discounted cash flow analysis and management judgment are required to estimate fair value.
Derivative assets and liabilities
Our derivative instruments include interest rate agreements, TBAs, financial futures, and loan purchase and forward sale commitments. Fair values of derivative instruments are determined using quoted prices from active markets, when available, or from valuation models and are supported by valuations provided by dealers active in derivative markets. TBA and financial futures fair values are generally obtained using quoted prices from active markets (Level 1). Our derivative valuation models for interest rate agreements require a variety of inputs, including contractual terms, market prices, yield curves, credit curves, measures of volatility, prepayment rates, and correlations of certain inputs. Model inputs for interest rate agreements can generally be verified and model
F-34
REDWOOD TRUST, INC. AND SUBSIDIARIES
NOTES TO CONSOLIDATED FINANCIAL STATEMENTS
December 31, 2013
Note 5. Fair Value of Financial Instruments - (continued)
selection does not involve significant management judgment (Level 2). LPC fair values are estimated based on quoted Agency MBS prices, estimates of the fair value of the MSRs we expect to retain in the sale of the loans, and the probability that the mortgage loan will be purchased (Level 3). FSC fair values are obtained using quoted Agency prices. Model inputs can generally be verified and model selection does not involve significant management judgment (Level 2).
For other derivatives, valuations are based on various factors such as liquidity, bid/ask spreads, and credit considerations for which we rely on available market inputs. In the absence of such inputs, management’s best estimate is used (Level 3). At December 31, 2012, we had no Level 3 derivatives.
MSRs
MSRs include the rights to service jumbo and conforming residential mortgage loans. Significant inputs in the valuation analysis are predominantly Level 3, due to the nature of these instruments and the lack of readily available market quotes. These inputs include market discount rates, prepayment speeds of serviced loans, and the market cost of servicing. Changes in the fair value of MSRs occur primarily due to the collection/realization of expected cash flows, as well as changes in valuation inputs and assumptions. Estimated fair values are based on applying the inputs to generate the net present value of estimated MSR income, which is what we believe market participants would use to estimate fair value (Level 3). These discounted cash flow models utilize certain significant unobservable inputs including prepayment rate and discount rate assumptions. An increase in these unobservable inputs will reduce the estimated fair value of the MSRs. As part of our MSR valuation process, we received a valuation estimate from a third-party valuations group. In the aggregate, our internal valuation of the MSRs was less than 5% lower than the third-party valuation.
Cash and cash equivalents
Cash and cash equivalents include cash on hand and highly liquid investments with original maturities of three months or less. Fair values equal carrying values (Level 1).
Restricted cash
Restricted cash primarily includes interest-earning cash balances at consolidated Sequoia entities and at the Residential Resecuritization and Commercial Securitization entities for the purpose of distribution to investors and reinvestment. Due to the short-term nature of the restrictions, fair values approximate carrying values (Level 1).
Accrued interest receivable and payable
Accrued interest receivable and payable includes interest due on our assets and payable on our liabilities. Due to the short-term nature of when these interest payments will be received or paid, fair values approximate carrying values (Level 1).
REO
REO includes properties owned in satisfaction of foreclosed loans. Fair values are determined using available market quotes, appraisals, broker price opinions, comparable properties, or other indications of value (Level 3).
Margin receivable
Margin receivable reflects cash collateral we have posted with our various derivative and debt counterparties as required to satisfy margin requirements. Fair values approximate carrying values (Level 1).
Short-term debt
Short-term debt includes our credit facilities that mature within one year. Fair values approximate carrying values (Level 1).
ABS issued
ABS issued includes asset-backed securities issued through the Sequoia, Residential Resecuritization, and Commercial Securitization entities. These instruments are illiquid in nature and trade infrequently, if at all. For ABS issued, we utilize both market comparable pricing and discounted cash flow analysis valuation techniques. Significant inputs in the valuation analysis are
F-35
REDWOOD TRUST, INC. AND SUBSIDIARIES
NOTES TO CONSOLIDATED FINANCIAL STATEMENTS
December 31, 2013
Note 5. Fair Value of Financial Instruments - (continued)
predominantly Level 3, due to the nature of these instruments and the lack of readily available market quotes. Relevant market indicators factored into the analyses include bid/ask spreads, external spreads, collateral credit losses, interest rates, default rates, loss severities, and collateral prepayment speeds. Estimated fair values are based on applying the market indicators to generate discounted cash flows (Level 3). These liabilities would generally increase in value based upon a decrease in default rates and would generally decrease in value if the prepayment rate or credit support input were to decrease.
As part of our ABS issued valuation process, we also request and consider indications of value from third-party securities dealers. For purposes of pricing our ABS issued at December 31, 2013, we received dealer price indications on 42% of our ABS issued. In the aggregate, our internal valuations of the ABS issued for which we received dealer price indications were 3% higher than the aggregate dealer valuations. Once we receive the price indications from dealers, they are compared to other relevant market inputs, such as actual or comparable trades, and the results of our discounted cash flow analysis.
Commercial borrowings
Commercial borrowings include our commercial loan repurchase agreement that matures in more than one year. Fair values approximate carrying values (Level 1).
Convertible notes
Convertible notes include unsecured convertible senior notes. Fair values are determined using quoted prices in active markets (Level 1).
Other long-term debt
Other long-term debt includes trust preferred securities and subordinated notes. Estimated fair values are determined using discounted cash flow analysis valuation techniques. Significant inputs in the valuation analysis are predominantly Level 3, due to the nature of these instruments and the lack of readily available market quotes. Estimated fair values are based on applying the market indicators to generate discounted cash flows (Level 3).
Note 6. Residential Loans
We acquire residential loans from third-party originators. During the years ended December 31, 2013 and 2012, we purchased $7.01 billion and $2.29 billion (principal balance), respectively, of residential loans, for which we elected the fair value option. The following table summarizes the classifications and carrying value of the residential loans owned at Redwood and at consolidated Sequoia entities at December 31, 2013 and 2012.
| December 31, 2013 | ||||||||||||
| (In Thousands) |
Redwood | Sequoia | Total | |||||||||
| Held-for-sale |
||||||||||||
| Fair value - Conforming |
$ | 11,502 | $ | - | $ | 11,502 | ||||||
| Fair value - Jumbo |
391,100 | - | 391,100 | |||||||||
| Lower of cost or fair value |
1,665 | - | 1,665 | |||||||||
| Held-for-investment |
- | 1,762,167 | 1,762,167 | |||||||||
|
|
|
|
|
|
|
|||||||
| Total Residential Loans |
$ | 404,267 | $ | 1,762,167 | $ | 2,166,434 | ||||||
|
|
|
|
|
|
|
|||||||
| December 31, 2012 | ||||||||||||
| (In Thousands) |
Redwood | Sequoia | Total | |||||||||
| Held-for-sale |
||||||||||||
| Fair value - Conforming |
$ | - | $ | - | $ | - | ||||||
| Fair value - Jumbo |
553,576 | - | 553,576 | |||||||||
| Lower of cost or fair value |
9,082 | - | 9,082 | |||||||||
| Held-for-investment |
- | 2,272,812 | 2,272,812 | |||||||||
|
|
|
|
|
|
|
|||||||
| Total Residential Loans |
$ | 562,658 | $ | 2,272,812 | $ | 2,835,470 | ||||||
|
|
|
|
|
|
|
|||||||
F-36
REDWOOD TRUST, INC. AND SUBSIDIARIES
NOTES TO CONSOLIDATED FINANCIAL STATEMENTS
December 31, 2013
Note 6. Residential Loans - (continued)
Residential Loan Characteristics
The following table displays the geographic concentration of residential loans recorded on our consolidated balance sheets at December 31, 2013 and 2012.
| December 31, 2013 | December 31, 2012 | |||||||||||||||
| Geographic Concentration (by Principal) |
Held-for-Sale | Held-for- Investment |
Held-for-Sale | Held-for- Investment |
||||||||||||
| California |
44 % | 20 % | 36 % | 24 % | ||||||||||||
| Texas |
7 % | 5 % | 7 % | 5 % | ||||||||||||
| Washington |
6 % | - | 5 % | - | ||||||||||||
| Virginia |
6 % | - | - | - | ||||||||||||
| Massachusetts |
4 % | - | 18 % | - | ||||||||||||
| New York |
3 % | 9 % | - | 9 % | ||||||||||||
| Georgia |
1 % | 5 % | - | 5 % | ||||||||||||
| Florida |
- | 13 % | - | 12 % | ||||||||||||
| Other states (none greater than 5%) |
29 % | 48 % | 34 % | 45 % | ||||||||||||
|
|
|
|
|
|
|
|
|
|||||||||
| Total |
100 % | 100 % | 100 % | 100 % | ||||||||||||
|
|
|
|
|
|
|
|
|
|||||||||
F-37
REDWOOD TRUST, INC. AND SUBSIDIARIES
NOTES TO CONSOLIDATED FINANCIAL STATEMENTS
December 31, 2013
Note 6. Residential Loans - (continued)
The following table displays the loan product type and accompanying loan characteristics of residential loans recorded on our consolidated balance sheets at December 31, 2013 and 2012.
| December 31, 2013 | ||||||||||||||||||||||||
| (In Thousands) | ||||||||||||||||||||||||
| Number | Interest | Maturity | Total | 30-89 | 90+ | |||||||||||||||||||
| Loan Balance |
of Loans | Rate(1) | Date | Principal | Days DQ | Days DQ | ||||||||||||||||||
| Held-for-Investment: |
||||||||||||||||||||||||
| ARM loans: |
||||||||||||||||||||||||
| $0 to $250 |
3,917 | 0.25% to 6.45% | 12/2012 - 11/2035 | $ | 449,458 | $ | 16,038 | $ | 16,856 | |||||||||||||||
| $251 to $500 |
1,231 | -0.13% to 5.63% | 07/2013 - 05/2036 | 428,503 | 14,111 | 15,775 | ||||||||||||||||||
| $501 to $750 |
395 | 0.50% to 4.66% | 08/2013 - 09/2035 | 240,407 | 8,951 | 14,527 | ||||||||||||||||||
| $751 to $1,000 |
191 | 0.25% to 2.25% | 09/2022 - 07/2035 | 170,454 | 3,108 | 7,886 | ||||||||||||||||||
| over $1,000 |
169 | -0.13% to 2.38% | 02/2019 - 05/2036 | 269,153 | 5,309 | 23,340 | ||||||||||||||||||
|
|
|
|
|
|
|
|
|
|||||||||||||||||
| 5,903 | 1,557,975 | 47,517 | 78,384 | |||||||||||||||||||||
|
|
|
|
|
|
|
|
|
|||||||||||||||||
| Hybrid ARM loans: |
||||||||||||||||||||||||
| $0 to $250 |
2 | 2.63% to 4.25% | 10/2033 - 07/2039 | 428 | - | - | ||||||||||||||||||
| $251 to $500 |
34 | 2.63% to 5.15% | 07/2033 - 07/2040 | 13,491 | 335 | 350 | ||||||||||||||||||
| $501 to $750 |
26 | 2.63% to 4.75% | 07/2033 - 09/2040 | 16,376 | 597 | - | ||||||||||||||||||
| $751 to $1,000 |
20 | 2.63% to 4.88% | 07/2033 - 12/2040 | 16,592 | - | - | ||||||||||||||||||
| over $1,000 |
10 | 2.63% to 4.95% | 09/2033 - 11/2040 | 15,662 | - | - | ||||||||||||||||||
|
|
|
|
|
|
|
|
|
|||||||||||||||||
| 92 | 62,549 | 932 | 350 | |||||||||||||||||||||
|
|
|
|
|
|
|
|
|
|||||||||||||||||
| Fixed loans: |
||||||||||||||||||||||||
| $0 to $250 |
9 | 3.70% to 4.90% | 04/2039 - 02/2041 | 1,529 | - | - | ||||||||||||||||||
| $251 to $500 |
40 | 3.45% to 5.63% | 02/2039 - 07/2041 | 16,929 | - | - | ||||||||||||||||||
| $501 to $750 |
86 | 3.65% to 5.25% | 02/2039 - 08/2041 | 52,642 | - | - | ||||||||||||||||||
| $751 to $1,000 |
47 | 4.20% to 5.25% | 08/2040 - 08/2041 | 41,225 | - | - | ||||||||||||||||||
| over $1,000 |
29 | 4.00% to 5.38% | 09/2040 - 06/2041 | 37,954 | - | - | ||||||||||||||||||
|
|
|
|
|
|
|
|
|
|||||||||||||||||
| 211 | 150,279 | - | - | |||||||||||||||||||||
|
|
|
|
|
|
|
|
|
|||||||||||||||||
| Total Held-for-Investment |
6,206 | $ | 1,770,803 | $ | 48,449 | $ | 78,734 | |||||||||||||||||
|
|
|
|
|
|
|
|
|
|||||||||||||||||
| Held-for-Sale: |
||||||||||||||||||||||||
| ARM loans |
9 | 1.88% to 2.50% | 11/2032 - 10/2033 | $ | 1,490 | $ | 166 | $ | 352 | |||||||||||||||
| Hybrid ARM loans |
114 | 2.38% to 4.63% | 06/2037 - 01/2044 | 91,976 | - | - | ||||||||||||||||||
| Fixed loans |
424 | 3.13% to 5.63% | 06/2037 - 01/2044 | 307,407 | - | - | ||||||||||||||||||
|
|
|
|
|
|
|
|
|
|||||||||||||||||
| Total Held-for-Sale |
547 | $ | 400,873 | $ | 166 | $ | 352 | |||||||||||||||||
|
|
|
|
|
|
|
|
|
|||||||||||||||||
F-38
REDWOOD TRUST, INC. AND SUBSIDIARIES
NOTES TO CONSOLIDATED FINANCIAL STATEMENTS
December 31, 2013
Note 6. Residential Loans - (continued)
| December 31, 2012 | ||||||||||||||||||||||||
| (In Thousands) | ||||||||||||||||||||||||
| Loan Balance |
Number of Loans |
Interest Rate(1) |
Maturity Date |
Total Principal |
30-89 Days DQ |
90+ Days DQ |
||||||||||||||||||
| Held-for-Investment: |
||||||||||||||||||||||||
| ARM loans: |
||||||||||||||||||||||||
| $0 to $250 |
4,605 | 0.37% to 6.00% | 12/2012 - 11/2035 | $ | 517,122 | $ | 13,003 | $ | 17,104 | |||||||||||||||
| $251 to $500 |
1,441 | 0% to 4.38% | 02/2013 - 05/2036 | 504,476 | 12,175 | 15,339 | ||||||||||||||||||
| $501 to $750 |
473 | 0.38% to 4.66% | 08/2013 - 09/2035 | 287,647 | 7,718 | 10,958 | ||||||||||||||||||
| $751 to $1,000 |
243 | 0.38% to 2.75% | 12/2013 - 07/2035 | 216,994 | 5,895 | 5,010 | ||||||||||||||||||
| over $1,000 |
214 | 0% to 2.75% | 09/2013 - 05/2036 | 340,725 | 8,417 | 13,774 | ||||||||||||||||||
|
|
|
|
|
|
|
|
|
|||||||||||||||||
| 6,976 | 1,866,964 | 47,208 | 62,185 | |||||||||||||||||||||
|
|
|
|
|
|
|
|
|
|||||||||||||||||
| Hybrid ARM loans: |
||||||||||||||||||||||||
| $0 to $250 |
9 | 3.70% to 5.00% | 04/2039 - 05/2041 | 1,482 | - | - | ||||||||||||||||||
| $251 to $500 |
56 | 3.00% to 5.63% | 02/2039 - 07/2041 | 23,254 | - | - | ||||||||||||||||||
| $501 to $750 |
152 | 3.45% to 5.50% | 02/2039 - 08/2041 | 94,074 | - | - | ||||||||||||||||||
| $751 to $1,000 |
100 | 4.20% to 5.50% | 07/2039 - 08/2041 | 87,340 | - | - | ||||||||||||||||||
| over $1,000 |
68 | 4.00% to 5.38% | 08/2040 - 07/2041 | 86,762 | - | - | ||||||||||||||||||
|
|
|
|
|
|
|
|
|
|||||||||||||||||
| 385 | 292,912 | - | - | |||||||||||||||||||||
|
|
|
|
|
|
|
|
|
|||||||||||||||||
| Fixed loans: |
||||||||||||||||||||||||
| $0 to $250 |
4 | 2.63% to 2.63% | 08/2033 - 01/2035 | 642 | - | - | ||||||||||||||||||
| $251 to $500 |
45 | 2.63% to 5.15% | 07/2033 - 12/2039 | 18,137 | - | 373 | ||||||||||||||||||
| $501 to $750 |
46 | 2.63% to 5.30% | 07/2033 - 10/2040 | 29,088 | - | - | ||||||||||||||||||
| $751 to $1,000 |
39 | 2.63% to 5.63% | 07/2033 - 12/2040 | 33,346 | - | - | ||||||||||||||||||
| over $1,000 |
26 | 2.63% to 5.15% | 08/2033 - 01/2041 | 36,980 | - | - | ||||||||||||||||||
|
|
|
|
|
|
|
|
|
|||||||||||||||||
| 160 | 118,193 | - | 373 | |||||||||||||||||||||
|
|
|
|
|
|
|
|
|
|||||||||||||||||
| Total Held-for-Investment |
7,521 | $ | 2,278,069 | $ | 47,208 | $ | 62,558 | |||||||||||||||||
|
|
|
|
|
|
|
|
|
|||||||||||||||||
| Held-for-Sale: |
||||||||||||||||||||||||
| ARM loans |
9 | 2.25% to 2.25% | 11/2032 - 10/2033 | $ | 1,552 | $ | - | $ | 563 | |||||||||||||||
| Hybrid ARM loans |
674 | 3.00% to 5.50% | 01/2042 - 01/2043 | 524,814 | - | - | ||||||||||||||||||
| Fixed loans |
19 | 2.88% to 4.38% | 06/2037 - 11/2042 | 16,449 | - | - | ||||||||||||||||||
|
|
|
|
|
|
|
|
|
|||||||||||||||||
| Total Held-for-Sale |
702 | $ | 542,815 | $ | - | $ | 563 | |||||||||||||||||
|
|
|
|
|
|
|
|
|
|||||||||||||||||
| (1) | Rate is net of servicing fee for consolidated loans for which we do not own the MSR. For borrowers whose current rate is less than the applicable servicing fee, the rate shown in the table above is zero. |
Residential Loans Held-for-Sale
Residential Loans at Fair Value
At December 31, 2013 and 2012, there were 537 and 685 residential loans at fair value, respectively, with an aggregate outstanding principal balance of $399 million and $533 million, respectively, and an aggregate fair value of $403 million and $554 million, respectively. During the years ended December 31, 2013 and 2012, we recorded negative $12 million and positive $38 million of valuation adjustments, respectively, on residential loans for which we elected the fair value option through mortgage banking activities, net, a component of our consolidated statements of income.
F-39
REDWOOD TRUST, INC. AND SUBSIDIARIES
NOTES TO CONSOLIDATED FINANCIAL STATEMENTS
December 31, 2013
Note 6. Residential Loans - (continued)
Residential Loans at Lower of Cost or Fair Value
At December 31, 2013, there were 10 residential loans at lower of cost or fair value with $2 million in outstanding principal balance and a carrying value of $2 million. At December 31, 2012, there were 17 residential loans at lower of cost or fair value with $10 million in outstanding principal balance and a carrying value of $9 million. During the years ended December 31, 2013 and 2012, we recorded valuation adjustments for residential loans held-for-sale of positive $38 thousand and positive $623 thousand, respectively.
Residential Loans Held-for-Investment
The following table details the carrying value for residential loans held-for-investment at December 31, 2013 and 2012. These loans are owned at Sequoia securitization entities that we consolidate for financial reporting purposes.
| (In Thousands) |
December 31, 2013 | December 31, 2012 | ||||||
| Principal balance |
$ | 1,770,803 | $ | 2,278,069 | ||||
| Unamortized premium, net |
16,791 | 23,247 | ||||||
|
|
|
|
|
|||||
| Recorded investment |
1,787,594 | 2,301,316 | ||||||
| Allowance for loan losses |
(25,427) | (28,504) | ||||||
|
|
|
|
|
|||||
| Carrying Value |
$ | 1,762,167 | $ | 2,272,812 | ||||
|
|
|
|
|
|||||
Of the $1.80 billion of principal balance and $17 million of unamortized premium on loans held-for-investment at December 31, 2013, $731 million of principal balance and $11 million of unamortized premium relate to residential loans acquired prior to July 1, 2004. During 2013, 20% of these residential loans prepaid and we amortized 32% of the premium based upon the accounting elections we apply. For residential loans acquired after July 1, 2004, the principal balance was $1.00 billion and the unamortized premium was $6 million. During 2013, 24% of these loans prepaid and we amortized 19% of the premium.
Of the $2.28 billion of principal balance and $23 million of unamortized premium on loans held-for-investment at December 31, 2012, $912 million of principal balance and $16 million of unamortized premium relate to residential loans acquired prior to July 1, 2004. For residential loans acquired after July 1, 2004, the principal balance was $1.37 billion and the unamortized premium was $8 million.
Credit Characteristics of Residential Loans Held-for-Investment
As a percentage of our recorded investment, 98% of residential loans held-for-investment at December 31, 2013, were first lien, predominately prime-quality loans at the time of origination. The remaining 2% of loans were second lien, home equity lines of credit. The weighted average original LTV ratio for our residential loans held-for-investment outstanding at December 31, 2013, was 66%. The weighted average FICO score for the borrowers of these loans was 733 at the time the loans were originated.
We consider the year of origination of our residential loans held-for-investment to be a general indicator of credit performance as loans originated in specific years have often possessed similar product and credit characteristics. The following table displays our recorded investment in residential loans held-for-investment at December 31, 2013 and 2012, organized by year of origination.
| (In Thousands) |
December 31, 2013 | December 31, 2012 | ||||||
| 2003 & Earlier |
$ | 881,364 | $ | 1,131,200 | ||||
| 2004 |
513,458 | 569,379 | ||||||
| 2005 |
62,675 | 71,792 | ||||||
| 2006 |
149,776 | 164,333 | ||||||
| 2007 |
- | - | ||||||
| 2008 |
- | - | ||||||
| 2009 |
25,860 | 58,628 | ||||||
| 2010 |
92,728 | 197,964 | ||||||
| 2011 |
61,733 | 108,020 | ||||||
|
|
|
|
|
|||||
| Total Recorded Investment |
$ | 1,787,594 | $ | 2,301,316 | ||||
|
|
|
|
|
|||||
F-40
REDWOOD TRUST, INC. AND SUBSIDIARIES
NOTES TO CONSOLIDATED FINANCIAL STATEMENTS
December 31, 2013
Note 6. Residential Loans - (continued)
Allowance for Loan Losses on Residential Loans
For residential loans held-for-investment, we establish and maintain an allowance for loan losses. The allowance includes a component for pools of residential loans owned at Sequoia securitization entities that we collectively evaluated for impairment, and a component for loans individually evaluated for impairment that includes restructured residential loans at Sequoia entities that have been determined to be troubled debt restructurings.
Activity in the Allowance for Loan Losses on Residential Loans
The following table summarizes the activity in the allowance for loan losses for the years ended December 31, 2013, 2012, and 2011.
| Year Ended December 31, | ||||||||||||
| (In Thousands) |
2013 | 2012 | 2011 | |||||||||
| Balance at beginning of period |
$ | 28,504 | $ | 66,881 | $ | 62,432 | ||||||
| Charge-offs, net |
(4,525) | (11,903) | (11,095) | |||||||||
| Provision for (reversal of) provision for loan losses |
1,448 | 171 | 15,544 | |||||||||
| Deconsolidation adjustment |
- | (26,645) | - | |||||||||
|
|
|
|
|
|
|
|||||||
| Balance at End of Period |
$ | 25,427 | $ | 28,504 | $ | 66,881 | ||||||
|
|
|
|
|
|
|
|||||||
During the year ended December 31, 2013 there were $5 million of charge-offs of residential loans that reduced our allowance for loan losses. These charge-offs arose from $14 million of defaulted loan principal. During the years ended December 31, 2012 and 2011, there were $12 million and $11 million of charge-offs of residential loans, respectively. These charge-offs arose from $33 million and $34 million of defaulted loan principal, respectively.
Residential Loans Collectively Evaluated for Impairment
We establish the collective component of the allowance for residential loan losses based primarily on the characteristics of the loan pools underlying the securitization entities that own the loans, including loan product types, credit characteristics, and origination years. The collective analysis is further divided into two segments. The first segment reflects our estimate of losses on delinquent loans within each loan pool. These loss estimates are determined by applying the loss factors described in Note 3 to the delinquent loans, including our expectations of the timing of defaults and the loss severities we expect once defaults occur. The second segment relates to our estimate of losses incurred on nondelinquent loans within each loan pool. This estimate is based on losses we expect to realize over a 23 month loss confirmation period, which is based on our historical loss experience as well as consideration of the loss factors described in Note 3.
The following table summarizes the balances for loans collectively evaluated for impairment at December 31, 2013 and 2012.
| (In Thousands) |
December 31, 2013 | December 31, 2012 | ||||||
| Principal balance |
$ | 1,762,165 | $ | 2,272,104 | ||||
| Recorded investment |
1,779,161 | 2,295,471 | ||||||
| Related allowance |
24,762 | 27,891 | ||||||
The following table summarizes the recorded investment and past due status of residential loans collectively evaluated for impairment at December 31, 2013 and 2012.
| (In Thousands) |
30-59 Days Past Due |
60-89 Days Past Due |
90+ Days Past Due |
Current | Total Loans | |||||||||||||||
| December 31, 2013 |
$ | 34,187 | $ | 13,248 | $ | 79,010 | $ | 1,652,716 | $ | 1,779,161 | ||||||||||
| December 31, 2012 |
29,345 | 17,593 | 62,937 | 2,185,596 | 2,295,471 | |||||||||||||||
F-41
REDWOOD TRUST, INC. AND SUBSIDIARIES
NOTES TO CONSOLIDATED FINANCIAL STATEMENTS
December 31, 2013
Note 6. Residential Loans - (continued)
Residential Loans Individually Evaluated for Impairment
As part of the loss mitigation efforts undertaken by servicers of residential loans owned at Sequoia securitization entities, a number of loan modifications have been completed to help make mortgage loans more affordable for qualifying borrowers and potentially reduce a future impairment. For the years ended December 31, 2013, 2012, and 2011, all of the loan modifications determined to be TDRs were either: (i) conversions of a floating rate mortgage loan into a fixed rate mortgage loan; (ii) reductions in the contractual interest rates of a mortgage loan paired with capitalization of accrued interest; or (iii) principal forgiveness paired with interest rate reductions.
The following table presents the details of the loan modifications determined to be TDRs for the years ended December 31, 2013, 2012, and 2011.
| Year Ended December 31, | ||||||||||||
| (Dollars in Thousands) |
2013 | 2012 | 2011 | |||||||||
| TDRs |
||||||||||||
| Number of modifications |
12 | 15 | 18 | |||||||||
| Pre-modification outstanding recorded investment |
$ | 2,939 | $ | 6,603 | $ | 7,932 | ||||||
| Post-modification outstanding recorded investment |
2,838 | 6,540 | 8,449 | |||||||||
| Loan modification effect on net interest income after provision and other MVA |
(863) | (1,448) | (1,649) | |||||||||
| TDRs that Subsequently Defaulted |
||||||||||||
| Number of modifications |
7 | 10 | 3 | |||||||||
| Recorded investment |
$ | 17,174 | $ | 5,078 | $ | 1,436 | ||||||
If we determine that a restructured loan is a TDR, we remove it from the general loan pools used for determining the allowance for residential loan losses and assess it for impairment on an individual basis. This assessment is based primarily on whether an adverse change in the expected future cash flows resulted from the restructuring. The average recorded investment of loans individually evaluated for impairment for the years ended December 31, 2013, 2012, and 2011, was $7 million, $14 million, and $12 million, respectively. For the years ended December 31, 2013, 2012 and 2011, we recorded interest income of $123 thousand, $297 thousand and $348 thousand, respectively, on individually impaired loans.
The following table summarizes the balances for loans individually evaluated for impairment, all of which had an allowance, at December 31, 2013 and 2012.
| (In Thousands) |
December 31, 2013 | December 31, 2012 | ||||||
| Principal balance |
$ | 8,638 | $ | 5,965 | ||||
| Recorded investment |
8,433 | 5,845 | ||||||
| Related allowance |
665 | 613 | ||||||
The following table summarizes the recorded investment and past due status of residential loans individually evaluated for impairment at December 31, 2013 and 2012.
| (In Thousands) |
30-59 Days Past Due |
60-89 Days Past Due |
90+ Days Past Due |
Current | Total Loans | |||||||||||||||
| December 31, 2013 |
$ | 1,560 | $ | - | $ | 567 | $ | 6,306 | $ | 8,433 | ||||||||||
| December 31, 2012 |
160 | 645 | - | 5,040 | 5,845 | |||||||||||||||
F-42
REDWOOD TRUST, INC. AND SUBSIDIARIES
NOTES TO CONSOLIDATED FINANCIAL STATEMENTS
December 31, 2013
Note 7. Commercial Loans
We invest in commercial loans that we originate as well as loans that we acquire from third-party originators. The following table summarizes the classifications and carrying value of commercial loans at December 31, 2013 and 2012.
| (In Thousands) |
December 31, 2013 | December 31, 2012 | ||||||
| Held-for-sale |
||||||||
| Fair value |
$ | 89,111 | $ | - | ||||
| Lower of cost or fair value |
- | 8,500 | ||||||
| Held-for-investment |
343,344 | 304,510 | ||||||
|
|
|
|
|
|||||
| Total Commercial Loans |
$ | 432,455 | $ | 313,010 | ||||
|
|
|
|
|
|||||
Of the held-for-investment commercial loans shown above at December 31, 2013 and 2012, $258 million and $284 million, respectively, were financed through the Commercial Securitization entity, as discussed in Note 4.
Commercial Loan Characteristics
The following table displays the geographic concentration of commercial loans recorded on our consolidated balance sheets at December 31, 2013 and 2012.
| December 31, 2013 | December 31, 2012 | |||||||||||||||
| Geographic Concentration (by Principal) |
Held-for-Sale | Held-for- Investment |
Held-for-Sale | Held-for- Investment |
||||||||||||
| New York |
39 % | 19 % | - | 22 % | ||||||||||||
| North Carolina |
28 % | - | - | - | ||||||||||||
| New Jersey |
13 % | - | - | - | ||||||||||||
| Ohio |
8 % | - | - | - | ||||||||||||
| Indiana |
6 % | - | - | - | ||||||||||||
| Illinois |
6 % | 6 % | - | 11 % | ||||||||||||
| Florida |
- | 10 % | 100 % | 10 % | ||||||||||||
| Michigan |
- | 8 % | - | 6 % | ||||||||||||
| Texas |
- | 7 % | - | 5 % | ||||||||||||
| California |
- | 21 % | - | 20 % | ||||||||||||
| Other states (none greater than 5%) |
- | 29 % | - | 26 % | ||||||||||||
|
|
|
|
|
|
|
|
|
|||||||||
| Total |
100 % | 100 % | 100 % | 100 % | ||||||||||||
|
|
|
|
|
|
|
|
|
|||||||||
F-43
REDWOOD TRUST, INC. AND SUBSIDIARIES
NOTES TO CONSOLIDATED FINANCIAL STATEMENTS
December 31, 2013
Note 7. Commercial Loans - (continued)
The following table displays the loan product type and accompanying loan characteristics of commercial loans recorded on our consolidated balance sheets at December 31, 2013 and 2012.
| December 31, 2013 | ||||||||||||||||||||||||
| (In Thousands) | ||||||||||||||||||||||||
| Loan Balance |
Number of Loans |
Interest Rate |
Maturity Date |
Total Principal |
30-89 Days DQ |
90+ Days DQ |
||||||||||||||||||
| Held-for-Investment: |
||||||||||||||||||||||||
| Fixed-rate loans: |
||||||||||||||||||||||||
| $0 to $5,000 |
24 | 9.75% to 12.50% | 8/2016 - 1/2024 | $ | 70,597 | $ | - | $ | - | |||||||||||||||
| $5,001 to $10,000 |
15 | 4.43% to 12.25% | 4/2015 - 6/2023 | 112,887 | - | - | ||||||||||||||||||
| $10,001 to $15,000 |
3 | 9.50% to 10.00% | 6/2015 - 6/2021 | 35,463 | - | - | ||||||||||||||||||
| $15,001 to $20,000 |
2 | 10.50% to 11.00% | 6/2016 - 6/2022 | 37,700 | - | - | ||||||||||||||||||
| $20,001 to $25,000 |
1 | 9.50% | 12/2014 | 21,500 | - | - | ||||||||||||||||||
| $25,001 to $30,000 |
1 | 10.00% | 10/2016 | 25,839 | - | - | ||||||||||||||||||
|
|
|
|
|
|
|
|
|
|||||||||||||||||
| 46 | 303,986 | - | - | |||||||||||||||||||||
|
|
|
|
|
|
|
|
|
|||||||||||||||||
| ARM loans: |
||||||||||||||||||||||||
| $5,001 to $10,000 |
2 | 10.80% to 12.00% | 2/2015 - 10/2016 | 15,497 | - | - | ||||||||||||||||||
| $10,001 to $15,000 |
1 | 11.20% | 11/2014 | 14,598 | - | - | ||||||||||||||||||
| $15,001 to $20,000 |
1 | 11.99% | 8/2014 | 19,250 | - | - | ||||||||||||||||||
|
|
|
|
|
|
|
|
|
|||||||||||||||||
| 4 | 49,345 | - | - | |||||||||||||||||||||
|
|
|
|
|
|
|
|
|
|||||||||||||||||
| Total Held-for-Investment |
50 | $ | 353,331 | $ | - | $ | - | |||||||||||||||||
|
|
|
|
|
|
|
|
|
|||||||||||||||||
| Held-for-Sale |
||||||||||||||||||||||||
| Fixed-rate loans: |
7 | 4.79% to 5.52% | 12/2023-1/2024 | $ | 87,650 | $ | - | $ | - | |||||||||||||||
| December 31, 2012 | ||||||||||||||||||||||||
| (In Thousands) | ||||||||||||||||||||||||
| Loan Balance |
Number of Loans |
Interest Rate |
Maturity Date |
Total Principal |
30-89 Days DQ |
90+ Days DQ |
||||||||||||||||||
| Held-for-Investment: |
||||||||||||||||||||||||
| Fixed-rate loans: |
||||||||||||||||||||||||
| $0 to $5,000 |
11 | 5.44% to 12.00% | 11/2014 - 1/2023 | $ | 38,722 | $ | - | $ | - | |||||||||||||||
| $5,001 to $10,000 |
13 | 4.28% to 11.00% | 4/2015 - 1/2023 | 101,451 | - | - | ||||||||||||||||||
| $10,001 to $15,000 |
4 | 9.50% to 11.00% | 11/2013 - 6/2021 | 47,642 | - | - | ||||||||||||||||||
| $15,001 to $20,000 |
2 | 10.50% to 11.00% | 6/2016 - 6/2022 | 37,700 | - | - | ||||||||||||||||||
| $20,001 to $25,000 |
1 | 9.50% | 12/2014 - 12/2014 | 21,500 | - | - | ||||||||||||||||||
| $25,001 to $30,000 |
1 | 10.00% | 10/2016 - 10/2016 | 26,037 | - | - | ||||||||||||||||||
|
|
|
|
|
|
|
|
|
|||||||||||||||||
| 32 | 273,052 | - | - | |||||||||||||||||||||
|
|
|
|
|
|
|
|
|
|||||||||||||||||
| ARM loans: |
||||||||||||||||||||||||
| $5,001 to $10,000 |
1 | 12.00% | 10/2016 | 5,500 | - | - | ||||||||||||||||||
| $10,001 to $15,000 |
1 | 11.20% | 11/2013 | 14,598 | - | - | ||||||||||||||||||
| $15,001 to $20,000 |
1 | 11.99% | 8/2014 | 19,250 | - | - | ||||||||||||||||||
|
|
|
|
|
|
|
|
|
|||||||||||||||||
| 3 | 39,348 | - | - | |||||||||||||||||||||
|
|
|
|
|
|
|
|
|
|||||||||||||||||
| Total Held-for-Investment |
35 | $ | 312,400 | $ | - | $ | - | |||||||||||||||||
|
|
|
|
|
|
|
|
|
|||||||||||||||||
| Held-for-Sale |
||||||||||||||||||||||||
| Fixed-rate loans: |
1 | 4.28% | 1/2023 | $ | 8,500 | $ | - | $ | - | |||||||||||||||
F-44
REDWOOD TRUST, INC. AND SUBSIDIARIES
NOTES TO CONSOLIDATED FINANCIAL STATEMENTS
December 31, 2013
Note 7. Commercial Loans - (continued)
Commercial Loans Held-for-Sale
Commercial loans held-for-sale include loans we originate and intend to sell to third parties.
Commercial Loans at Fair Value
At December 31, 2013, there were seven senior commercial loans at fair value, with an aggregate outstanding principal balance of $88 million and an aggregate fair value of $89 million. During the year ended December 31, 2013, we acquired $659 million (principal balance) of senior commercial loans for which we elected the fair value option and sold $597 million to third-parties. During the year ended December 31, 2013, we recorded $9 million of positive valuation adjustments on commercial loans for which we elected the fair value option through mortgage banking activities, net, a component of our consolidated income statement.
Prior to December 31, 2012, commercial loans at fair value included loans owned at the consolidated Acacia securitization entities. As we deconsolidated the Acacia entities in the fourth quarter of 2012, there are no commercial loans at fair value at December 31, 2012. During both the years ended December 31, 2012 and 2011, we recorded less than $1 million of positive valuation adjustments on commercial loans other market valuation adjustments, a component of our consolidated income statement.
Commercial Loans at Lower of Cost or Fair Value
At December 31, 2013, there were no commercial loans held at the lower of cost or fair value. At December 31, 2012, there was one senior commercial loan held-for-sale with $9 million in outstanding principal balance and a lower of cost or fair value of $9 million. During the year ended December 31, 2012, we acquired or originated $24 billion (principal balance) of senior commercial loans, which we held at the lower of cost or fair value, and sold $15 million to third-parties. During both the years ended December 31, 2013 and 2012, we did not record a valuation adjustment on commercial loans held-for-sale.
Commercial Loans Held-for-Investment
Commercial loans held-for-investment include loans we originate and preferred equity investments we make or, in either case, acquire from third parties. Through December 31, 2013, these loans have typically been mezzanine loans that are secured by a borrower’s ownership interest in a single purpose entity that owns commercial property, rather than a lien on the commercial property. The preferred equity investments are typically preferred equity interests in a single purpose entity that owns commercial property and are included within, and referred to herein, as commercial loans held-for-investment due to the fact that their risks and payment characteristics are nearly equivalent to commercial mezzanine loans.
The following table provides additional information for our commercial loans held-for-investment at December 31, 2013 and 2012.
| (In Thousands) |
December 31, 2013 | December 31, 2012 | ||||||
| Principal balance |
$ | 353,331 | $ | 312,400 | ||||
| Unamortized discount, net |
(2,614) | (3,806) | ||||||
|
|
|
|
|
|||||
| Recorded investment |
350,717 | 308,594 | ||||||
| Allowance for loan losses |
(7,373) | (4,084) | ||||||
|
|
|
|
|
|||||
| Carrying Value |
$ | 343,344 | $ | 304,510 | ||||
|
|
|
|
|
|||||
At December 31, 2013, there were 50 commercial loans held-for-investment with an outstanding principal balance of $353 million and a carrying value of $343 million. Of the $351 million of recorded investment in commercial loans held-for-investment at December 31, 2013, 19% was originated in 2013, 43% was originated in 2012, 34% was originated in 2011, and 4% was originated in 2010. During the year ended December 31, 2013, we originated or acquired $66 million of commercial loans held-for-investment and received prepayments of $24 million. In connection with the loan prepayments, we received $3 million of yield maintenance fees during the year ended December 31, 2013.
F-45
REDWOOD TRUST, INC. AND SUBSIDIARIES
NOTES TO CONSOLIDATED FINANCIAL STATEMENTS
December 31, 2013
Note 7. Commercial Loans - (continued)
At December 31, 2012, there were 35 commercial loans held-for-investment with an outstanding principal balance of $312 million and a carrying value of $305 million. Of the $309 million of recorded investment in commercial loans held-for-investment at December 31, 2012, 53% was originated in 2012, 38% was originated in 2011, 9% was originated in 2010, and less than 1% was acquired in 2004. During the year ended December 31, 2012, we originated or acquired $156 million of commercial loans held-for-investment and received prepayments of $6 million. In connection with the loan prepayments, we received less than $1 million of yield maintenance fees during the year ended December 31, 2012.
Allowance for Loan Losses on Commercial Loans
For commercial loans classified as held-for-investment, we establish and maintain an allowance for loan losses. The allowance includes a component for loans collectively evaluated for impairment and a component for loans individually evaluated for impairment.
Our methodology for assessing the adequacy of the allowance for loan losses includes a formal review of each commercial loan in the portfolio and the assignment of an internal impairment status. Based on the assigned impairment status, a loan is categorized as “Pass,” “Watch List,” or “Workout.” The following table presents the principal balance of commercial loans held-for-investment by risk category.
| (In Thousands) |
December 31, 2013 | December 31, 2012 | ||||||
| Pass |
$ | 309,792 | $ | 312,400 | ||||
| Watch list |
43,539 | - | ||||||
| Workout |
- | - | ||||||
|
|
|
|
|
|||||
| Total Commercial Loans Held-for-Investment |
$ | 353,331 | $ | 312,400 | ||||
|
|
|
|
|
|||||
Activity in the Allowance for Loan Losses on Commercial Loans
The following table summarizes the activity in the allowance for commercial loan losses for the years ended December 31, 2013, 2012, and 2011.
| Year Ended December 31, | ||||||||||||
| (In Thousands) |
2013 | 2012 | 2011 | |||||||||
| Balance at beginning of period |
$ | 4,084 | $ | 608 | $ | - | ||||||
| Charge-offs, net |
- | - | - | |||||||||
| Provision for loan losses |
3,289 | 3,476 | 608 | |||||||||
|
|
|
|
|
|
|
|||||||
| Balance at End of Period |
$ | 7,373 | $ | 4,084 | $ | 608 | ||||||
|
|
|
|
|
|
|
|||||||
Commercial Loans Collectively Evaluated for Impairment
At December 31, 2013 and 2012, all of our commercial loans collectively evaluated for impairment were current. The following table summarizes the balances for loans collectively evaluated for impairment at December 31, 2013 and 2012.
| (In Thousands) |
December 31, 2013 | December 31, 2012 | ||||||
| Principal balance |
$ | 353,331 | $ | 312,400 | ||||
| Recorded investment |
350,717 | 308,594 | ||||||
| Related allowance |
7,373 | 4,084 | ||||||
F-46
REDWOOD TRUST, INC. AND SUBSIDIARIES
NOTES TO CONSOLIDATED FINANCIAL STATEMENTS
December 31, 2013
Note 7. Commercial Loans - (continued)
Commercial Loans Individually Evaluated for Impairment
We did not have any loans individually evaluated for impairment for either of the years ended December 31, 2013 or 2012.
Note 8. Real Estate Securities
We invest in mortgage-backed securities. The following table presents the fair values of our real estate securities by collateral type at December 31, 2013 and 2012.
| (In Thousands) |
December 31, 2013 | December 31, 2012 | ||||||
| Residential |
$ | 1,682,861 | $ | 1,094,684 | ||||
| Commercial |
- | 14,069 | ||||||
|
|
|
|
|
|||||
| Total Real Estate Securities |
$ | 1,682,861 | $ | 1,108,753 | ||||
|
|
|
|
|
|||||
Our residential securities herein are presented in accordance with their general position within a securitization structure based on their rights to cash flows. Senior securities are those interests in a securitization that generally have the first right to cash flows and are last in line to absorb losses. Re-REMIC securities, as presented herein, were created through the resecuritization of certain senior interests to provide additional credit support to those interests. These re-REMIC securities are therefore subordinate to the remaining senior interest, but senior to any subordinate tranches of the securitization from which they were created. Subordinate securities are all interests below senior and re-REMIC interests.
Trading Securities
We elected the fair value option for certain securities at Redwood and, previously, the Acacia entities, and classify them as trading securities. In the fourth quarter of 2012, we deconsolidated the Acacia entities and derecognized the associated assets and liabilities, including the trading securities owned by the Acacia entities. At December 31, 2013, our trading securities included $120 million of interest-only securities, for which there is no principal balance, and $5 million of residential subordinate securities. The unpaid principal balance of residential subordinate securities classified as trading was $15 million and $12 million at December 31, 2013 and 2012, respectively. The following table presents trading securities by collateral type and ownership entity at December 31, 2013 and 2012.
| (In Thousands) |
December 31, 2013 | December 31, 2012 | ||||||
| Senior Securities |
||||||||
| Residential prime |
$ | 110,505 | $ | 10,409 | ||||
| Residential non-prime |
9,070 | 22,134 | ||||||
|
|
|
|
|
|||||
| Total Senior Securities |
119,575 | 32,543 | ||||||
| Subordinate Securities |
||||||||
| Residential prime |
4,980 | 468 | ||||||
| Residential non-prime |
- | 161 | ||||||
|
|
|
|
|
|||||
| Total Subordinate Securities |
4,980 | 629 | ||||||
|
|
|
|
|
|||||
| Total Trading Securities |
$ | 124,555 | $ | 33,172 | ||||
|
|
|
|
|
|||||
F-47
REDWOOD TRUST, INC. AND SUBSIDIARIES
NOTES TO CONSOLIDATED FINANCIAL STATEMENTS
December 31, 2013
Note 8. Real Estate Securities - (continued)
AFS Securities
The following table presents the fair value of our available-for-sale securities held at Redwood by collateral type at December 31, 2013 and 2012.
| (In Thousands) |
December 31, 2013 | December 31, 2012 | ||||||
| Senior Securities |
||||||||
| Residential prime |
$ | 662,306 | $ | 466,523 | ||||
| Residential non-prime |
193,386 | 245,266 | ||||||
|
|
|
|
|
|||||
| Total Senior Securities |
855,693 | 711,789 | ||||||
| Re-REMIC Securities |
176,376 | 163,035 | ||||||
| Subordinate Securities |
||||||||
| Residential prime |
526,095 | 184,528 | ||||||
| Residential non-prime |
143 | 2,160 | ||||||
| Commercial |
- | 14,069 | ||||||
|
|
|
|
|
|||||
| Total Subordinate Securities |
526,238 | 200,757 | ||||||
|
|
|
|
|
|||||
| Total AFS Securities |
$ | 1,558,306 | $ | 1,075,581 | ||||
|
|
|
|
|
|||||
The senior securities shown above at December 31, 2013 and 2012, included $131 million and $172 million, respectively, of prime securities, and $132 million and $152 million, respectively, of non-prime securities that were financed through the Residential Resecuritization entity, as discussed in Note 4.
We often purchase AFS securities at a discount to their outstanding principal balances. To the extent we purchase an AFS security that has a likelihood of incurring a loss, we do not amortize into income the portion of the purchase discount that we do not expect to collect due to the inherent credit risk of the security. We may also expense a portion of our investment in the security to the extent we believe that principal losses will exceed the purchase discount. We designate any amount of unpaid principal balance that we do not expect to receive and thus do not expect to earn or recover as a credit reserve on the security. Any remaining net unamortized discounts or premiums on the security are amortized into income over time using the interest method.
At December 31, 2013, there were $765 thousand of AFS residential securities with contractual maturities less than five years, $2 million of AFS residential securities with contractual maturities greater than five years but less than ten years, and the remainder of our real estate securities had contractual maturities greater than ten years.
During the first quarter of 2013, we sold all of our commercial AFS securities, resulting in a realized gain of $12 million. The following table presents the components of carrying value (which equals estimated fair value) of residential AFS securities at December 31, 2013 and 2012.
Carrying Value of Residential AFS Securities
| December 31, 2013 | Senior | |||||||||||||||||||
| (In Thousands) |
Prime | Non-prime | Re-REMIC | Subordinate | Total | |||||||||||||||
| Principal balance |
$ | 670,051 | $ | 218,603 | $ | 214,046 | $ | 706,292 | $ | 1,808,992 | ||||||||||
| Credit reserve |
(10,144) | (13,840) | (30,429) | (62,457) | (116,870) | |||||||||||||||
| Unamortized discount, net |
(44,133) | (36,882) | (80,188) | (137,266) | (298,469) | |||||||||||||||
|
|
|
|
|
|
|
|
|
|
|
|||||||||||
| Amortized cost |
615,774 | 167,881 | 103,429 | 506,569 | 1,393,653 | |||||||||||||||
| Gross unrealized gains |
47,980 | 25,654 | 72,947 | 41,205 | 187,786 | |||||||||||||||
| Gross unrealized losses |
(1,448) | (149) | - | (21,536) | (23,133) | |||||||||||||||
|
|
|
|
|
|
|
|
|
|
|
|||||||||||
| Carrying Value |
$ | 662,306 | $ | 193,386 | $ | 176,376 | $ | 526,238 | $ | 1,558,306 | ||||||||||
|
|
|
|
|
|
|
|
|
|
|
|||||||||||
F-48
REDWOOD TRUST, INC. AND SUBSIDIARIES
NOTES TO CONSOLIDATED FINANCIAL STATEMENTS
December 31, 2013
Note 8. Real Estate Securities - (continued)
| December 31, 2012 | Senior | |||||||||||||||||||
| (In Thousands) |
Prime | Non-prime | Re-REMIC | Subordinate | Total | |||||||||||||||
| Principal balance |
$ | 485,033 | $ | 278,229 | $ | 215,863 | $ | 298,276 | $ | 1,277,401 | ||||||||||
| Credit reserve |
(26,100) | (18,104) | (47,235) | (95,593) | (187,032) | |||||||||||||||
| Unamortized discount, net |
(53,601) | (42,842) | (69,310) | (37,668) | (203,421) | |||||||||||||||
|
|
|
|
|
|
|
|
|
|
|
|||||||||||
| Amortized cost |
405,332 | 217,283 | 99,318 | 165,015 | 886,948 | |||||||||||||||
| Gross unrealized gains |
61,265 | 28,669 | 63,717 | 23,278 | 176,929 | |||||||||||||||
| Gross unrealized losses |
(74) | (686) | - | (1,605) | (2,365) | |||||||||||||||
|
|
|
|
|
|
|
|
|
|
|
|||||||||||
| Carrying Value |
$ | 466,523 | $ | 245,266 | $ | 163,035 | $ | 186,688 | $ | 1,061,512 | ||||||||||
|
|
|
|
|
|
|
|
|
|
|
|||||||||||
The following table presents the changes for years ended December 31, 2013 and 2012, of the unamortized discount and designated credit reserves on residential AFS securities.
Changes in Unamortized Discount and Designated Credit Reserves on Residential AFS Securities
| Year Ended December 31, 2013 | Year Ended December 31, 2012 | |||||||||||||||
| (In Thousands) |
Credit Reserve |
Unamortized Discount, Net |
Credit Reserve |
Unamortized Discount, Net |
||||||||||||
| Beginning balance |
$ | 187,032 | $ | 203,421 | $ | 242,261 | $ | 235,833 | ||||||||
| Amortization of net discount |
- | (34,943) | - | (30,775) | ||||||||||||
| Realized credit losses |
(21,971) | - | (45,309) | - | ||||||||||||
| Acquisitions |
13,604 | 92,124 | 15,084 | 54,787 | ||||||||||||
| Sales, calls, other |
(19,868) | (5,894) | (26,749) | (56,456) | ||||||||||||
| Impairments |
1,834 | - | 1,777 | - | ||||||||||||
| Transfers to (release of) credit reserves, net |
(43,761) | 43,761 | (32) | 32 | ||||||||||||
|
|
|
|
|
|
|
|
|
|||||||||
| Ending Balance |
$ | 116,870 | $ | 298,469 | $ | 187,032 | $ | 203,421 | ||||||||
|
|
|
|
|
|
|
|
|
|||||||||
Residential AFS Securities with Unrealized Losses
The following table presents the components comprising the total carrying value of residential AFS securities that were in a gross unrealized loss position at December 31, 2013 and 2012.
| Less Than 12 Consecutive Months | 12 Consecutive Months or Longer | |||||||||||||||||||||||
| (In Thousands) |
Amortized Cost |
Unrealized Losses |
Fair Value |
Amortized Cost |
Unrealized Losses |
Fair Value |
||||||||||||||||||
| December 31, 2013 |
$ | 607,030 | $ | (21,195) | $ | 585,835 | $ | 19,828 | $ | (1,938) | $ | 17,890 | ||||||||||||
| December 31, 2012 |
22,803 | (293) | 22,510 | 26,729 | (2,072) | 24,657 | ||||||||||||||||||
At December 31, 2013, after giving effect to purchases, sales, and extinguishments due to credit losses, our consolidated balance sheet included 303 AFS securities, of which 76 were in an unrealized loss position and five were in a continuous unrealized loss position for twelve consecutive months or longer. At December 31, 2012, our consolidated balance sheet included 284 AFS securities, of which 22 were in an unrealized loss position and 14 were in a continuous unrealized loss position for 12 consecutive months or longer.
Evaluating AFS Securities for Other-than-Temporary Impairments
Gross unrealized losses on our AFS securities were $23 million at December 31, 2013. We evaluate all securities in an unrealized loss position to determine if the impairment is temporary or other-than-temporary (resulting in an OTTI). At December 31, 2013, we did not intend to sell any of our AFS securities that were in an unrealized loss position, and it is more likely than not that we will not be required to sell these securities before recovery of their amortized cost basis, which may be at their maturity. We review our AFS securities that are in an unrealized loss position to identify those securities with losses that are other-than-temporary based on an
F-49
REDWOOD TRUST, INC. AND SUBSIDIARIES
NOTES TO CONSOLIDATED FINANCIAL STATEMENTS
December 31, 2013
Note 8. Real Estate Securities - (continued)
assessment of changes in expected cash flows for such securities, which considers recent security performance and expected future performance of the underlying collateral.
During 2013, we recognized OTTI losses of $5 million related to our AFS securities. AFS securities on which OTTI is recognized have experienced, or are expected to experience, credit-related adverse cash flow changes. In determining our estimate of cash flows for AFS securities we considered factors such as structural credit enhancement, past and expected future performance of underlying mortgage loans, including timing of expected future cash flows, which are informed by prepayment rates, default rates, loss severities, delinquency rates, percentage of non-performing loans, FICO scores at loan origination, year of origination, loan-to-value ratios, and geographic concentrations, as well as general market assessments. Changes in our evaluation of these factors impacted the cash flows expected to be collected at the OTTI assessment date and were used to determine if there were credit-related adverse cash flows and if so, the amount of credit related losses. Significant judgment is used in both our analysis of the expected cash flows for our AFS securities and any determination of the credit loss component of OTTI.
The table below summarizes the significant valuation assumptions we used for our AFS securities at December 31, 2013.
Significant Assumptions
| Range for Securities | ||||||||
| December 31, 2013 |
Prime | Non-prime | ||||||
| Prepayment rates |
7 - 25 % | 5 -5 % | ||||||
| Loss severity |
20 - 51 % | 41 - 41 % | ||||||
| Projected losses |
0 - 25 % | 12 - 12 % | ||||||
The following table details the activity related to the credit loss component of OTTI (i.e., OTTI recognized through earnings) for AFS securities held at December 31, 2013, 2012, and 2011, for which a portion of an OTTI was recognized in other comprehensive income.
Activity of the Credit Component of Other-than-Temporary Impairments
| Year Ended December 31, | ||||||||||||
| (In Thousands) |
2013 | 2012 | 2011 | |||||||||
| Balance at beginning of period |
$ | 50,852 | $ | 78,126 | $ | 121,016 | ||||||
| Additions |
||||||||||||
| Initial credit impairments |
137 | 325 | 1,428 | |||||||||
| Subsequent credit impairments |
- | 552 | 4,557 | |||||||||
| Reductions |
||||||||||||
| Securities sold, or expected to sell |
(5,811) | (10,024) | (12,317) | |||||||||
| Securities with no outstanding principal at period end |
(8,029) | (18,127) | (36,558) | |||||||||
|
|
|
|
|
|
|
|||||||
| Balance at End of Period |
$ | 37,149 | $ | 50,852 | $ | 78,126 | ||||||
|
|
|
|
|
|
|
|||||||
F-50
REDWOOD TRUST, INC. AND SUBSIDIARIES
NOTES TO CONSOLIDATED FINANCIAL STATEMENTS
December 31, 2013
Note 8. Real Estate Securities - (continued)
Gross Realized Gains and Losses on AFS Securities
Gains and losses from the sale of AFS securities are recorded as realized gains, net, in our consolidated statements of income. The following table presents the gross realized gains on sales and calls of AFS securities for the years ended December 31, 2013, 2012, and 2011.
| Year Ended December 31, | ||||||||||||
| (In Thousands) |
2013 | 2012 | 2011 | |||||||||
| Gross realized gains - sales |
$ | 24,613 | $ | 33,909 | $ | 12,665 | ||||||
| Gross realized gains - calls |
366 | 142 | 1,365 | |||||||||
| Gross realized losses - sales |
(214) | (1,600) | (3,523) | |||||||||
| Gross realized losses - calls |
- | - | (223) | |||||||||
|
|
|
|
|
|
|
|||||||
| Total Realized Gains on Sales and Calls |
$ | 24,765 | $ | 32,451 | $ | 10,284 | ||||||
|
|
|
|
|
|
|
|||||||
Note 9. Mortgage Servicing Rights
During the years ended December 31, 2013 and 2012, we retained the servicing rights associated with an aggregate $4.8 billion and $1.09 billion (principal balance), respectively, of residential loans we transferred to Sequoia securitization entities, and accounted for the transfers as sales in accordance with GAAP. As a result of these sales, during the years ended December 31, 2013 and 2012, we recorded MSRs of $43 million and $7 million, respectively, at a taxable REIT subsidiary of ours. During the year ended December 31, 2013, we also recorded MSRs of $1 million associated with $124 million of loans sold to third parties. In addition, during the year ended December 31, 2013, we purchased $3 million of MSRs associated with $307 million of conforming loan principal balance and recorded MSRs of $52 thousand related to $5 million of conforming loans sold to the Agencies. No MSRs associated with conforming loans were purchased or recorded during the year ended December 31, 2012. At December 31, 2013, the principal balance of the loans associated with our MSRs was $5.79 billion. At December 31, 2013, we also owned MSRs that provided us with the rights to service $364 million (principal balance) of consolidated residential loans purchased from third-party originators.
We contract with a licensed sub-servicer to perform all servicing functions for loans associated with our MSRs. The following table presents activity for MSRs for the years ended December 31, 2013 and 2012.
MSR Activity
| Year Ended December 31, | ||||||||
| (In Thousands) |
2013 | 2012 | ||||||
| Balance at beginning of period |
$ | 5,315 | $ | - | ||||
| Additions |
47,514 | 7,329 | ||||||
| Changes in fair value due to: |
||||||||
| Changes in assumptions (1) |
15,719 | (1,648) | ||||||
| Other changes (2) |
(3,724) | (366) | ||||||
|
|
|
|
|
|||||
| Balance at End of Period |
$ | 64,824 | $ | 5,315 | ||||
|
|
|
|
|
|||||
| (1) | Primarily reflects changes in prepayment assumptions due to changes in interest rates and discount rates. |
| (2) | Represents changes due to realization of expected cash flows. |
F-51
REDWOOD TRUST, INC. AND SUBSIDIARIES
NOTES TO CONSOLIDATED FINANCIAL STATEMENTS
December 31, 2013
Note 9. Mortgage Servicing Rights - (continued)
MSR Income
The following table presents the income from MSRs, net.
| Year Ended December 31, | ||||||||
| (In Thousands) |
2013 | 2012 | ||||||
| Servicing income, net: |
||||||||
| Income |
9,174 | 799 | ||||||
| Late charges |
65 | 8 | ||||||
| Cost of sub-servicer |
(925) | (184) | ||||||
|
|
|
|
|
|||||
| Net servicing income |
8,314 | 623 | ||||||
| Market valuation adjustments |
11,995 | (2,014) | ||||||
|
|
|
|
|
|||||
| Income from MSRs, Net |
$ | 20,309 | $ | (1,391) | ||||
|
|
|
|
|
|||||
Note 10. Derivative Financial Instruments
The following table presents the fair value and notional amount of derivative financial instruments held by us at December 31, 2013 and 2012. In the fourth quarter of 2012, we deconsolidated the Acacia entities and derecognized the associated assets and liabilities, including the derivative assets and liabilities owned by the Acacia entities. The derivatives held at Acacia entities are not assets or legal obligations of Redwood.
| December 31, 2013 | December 31, 2012 | |||||||||||||||
| (In Thousands) |
Fair Value |
Notional Amount |
Fair Value |
Notional Amount |
||||||||||||
| Assets - Risk Management Derivatives |
||||||||||||||||
| Interest rate swaps |
$ | 5,972 | $ | 268,000 | $ | 739 | $ | 147,000 | ||||||||
| TBAs |
1,138 | 241,000 | - | - | ||||||||||||
| Futures |
- | - | - | - | ||||||||||||
| Swaptions |
595 | 340,000 | 2,233 | 575,000 | ||||||||||||
| Loan purchase commitments |
- | 360 | - | - | ||||||||||||
| Loan forward sale commitments |
81 | 10,000 | - | - | ||||||||||||
|
|
|
|
|
|
|
|
|
|||||||||
| Total Assets |
$ | 7,786 | $ | 859,360 | $ | 2,972 | $ | 722,000 | ||||||||
|
|
|
|
|
|
|
|
|
|||||||||
| Liabilities - Cash Flow Hedges |
||||||||||||||||
| Interest rate swaps |
$ | (16,519) | $ | 139,500 | $ | (48,581) | $ | 139,500 | ||||||||
| Liabilities - Risk Management Derivatives |
||||||||||||||||
| Interest rate swaps |
(80) | 50,500 | (1,893) | 357,500 | ||||||||||||
| TBAs |
(661) | 235,000 | - | - | ||||||||||||
| Futures |
(528) | 162,000 | (607) | 234,000 | ||||||||||||
| Loan purchase commitments |
(379) | 42,562 | - | - | ||||||||||||
|
|
|
|
|
|
|
|
|
|||||||||
| Total Liabilities |
$ | (18,167) | $ | 629,562 | $ | (51,081) | $ | 731,000 | ||||||||
|
|
|
|
|
|
|
|
|
|||||||||
| Total Derivative Financial Instruments, Net |
$ | (10,381) | $ | 1,488,922 | $ | (48,109) | $ | 1,453,000 | ||||||||
|
|
|
|
|
|
|
|
|
|||||||||
Risk Management Derivatives
To offset, to varying degrees, risks associated with certain assets and liabilities on our consolidated balance sheets, we may enter into derivative contracts.
Certain Risks Related to Unsecuritized Residential and Commercial Loans at Redwood
In order to manage certain risks associated with residential and commercial loans we own or plan to acquire, at December 31, 2013, we were party to interest rate agreements with an aggregate notional amount of $648 million, TBA contracts sold with an
F-52
REDWOOD TRUST, INC. AND SUBSIDIARIES
NOTES TO CONSOLIDATED FINANCIAL STATEMENTS
December 31, 2013
Note 10. Derivative Financial Instruments - (continued)
aggregate notional amount of $476 million and financial futures contracts with an aggregate notional amount of $162 million. Net market valuation adjustments on risk management derivatives related to unsecuritized loans we own or plan to acquire were $51 million, negative $12 million, and negative $22 million for the years ended December 31, 2013, 2012, and 2011, respectively.
Certain Risks Related to Liabilities at Acacia Entities
Net valuation adjustments on interest rate agreements at Acacia were negative $11 million and negative $25 million for the years ended December 31, 2012 and 2011, respectively, and are reported through our consolidated statements of income in other market valuation adjustments, net.
Loan Purchase and Forward Sale Commitments
LPCs and FSCs that qualify as derivatives are recorded at their estimated fair values. Net valuation adjustments on LPCs and FSCs were less than negative $1 million for the year ended December 31, 2013, and are reported through our consolidated statements of income in mortgage banking activities, net.
Derivatives Designated as Cash Flow Hedges
To hedge the variability in interest expense related to our long-term debt and certain adjustable-rate securitization entity liabilities that are included in our consolidated balance sheets for financial reporting purposes, we designated interest rate swaps as cash flow hedges during 2010 and 2011 with an aggregate notional balance of $165 million. During the first half of 2012, we unwound swaps with an aggregate notional balance of $26 million that had been designated against certain adjustable-rate securitization entity liabilities.
For the years December 31, 2013, 2012, and 2011, these cash flow hedges increased in value by $32 million, $4 million, and decreased in value by $42 million, respectively, which was recorded in accumulated other comprehensive income, a component of equity. For interest rate agreements currently or previously designated as cash flow hedges, our total unrealized loss reported in accumulated other comprehensive income was $16 million and $48 million at December 31, 2013 and 2012, respectively. For the years ended December 31, 2013, 2012, and 2011, we reclassified less than $1 million, $15 million and $4 million, respectively, of unrealized losses on derivatives to interest expense. Concurrent with the derecognition of Acacia assets and liabilities in 2012, we accelerated our amortization of net unrealized losses on interest rate agreements and recognized interest expense of $11 million. Accumulated other comprehensive loss of less than $1 million will be amortized into interest expense, a component of our consolidated statements of income, over the remaining life of the hedged liabilities.
The following table illustrates the impact on interest expense of our interest rate agreements accounted for as cash flow hedges for the years ended December 31, 2013, 2012, and 2011.
Impact on Interest Expense of Our Interest Rate Agreements Accounted for as Cash Flow Hedges
| Year Ended December 31, | ||||||||||||
| (In Thousands) |
2013 | 2012 | 2011 | |||||||||
| Net interest expense on cash interest rate agreements |
$ | (5,889) | $ | (5,805) | $ | (6,392) | ||||||
| Realized expense due to ineffective portion of cash flow hedges |
- | (34) | (4) | |||||||||
| Realized net losses reclassified from other comprehensive income |
(281) | (14,820) | (4,243) | |||||||||
|
|
|
|
|
|
|
|||||||
| Total Interest Expense |
$ | (6,170) | $ | (20,659) | $ | (10,639) | ||||||
|
|
|
|
|
|
|
|||||||
Derivative Counterparty Credit Risk
We incur credit risk to the extent that counterparties to our derivative financial instruments do not perform their obligations under specified contractual agreements. If a derivative counterparty does not perform, we may not receive the proceeds to which we may be entitled under these agreements. Each of our derivative counterparties must maintain compliance with International Swaps and Derivatives Association (“ISDA”) agreements (or receive a waiver of non-compliance after a specific assessment) in order to conduct
F-53
REDWOOD TRUST, INC. AND SUBSIDIARIES
NOTES TO CONSOLIDATED FINANCIAL STATEMENTS
December 31, 2013
Note 10. Derivative Financial Instruments - (continued)
derivative transactions with us. Additionally, we review derivative counterparty credit standings, and in the case of a deterioration of creditworthiness, appropriate remedial action is taken. To further mitigate counterparty risk, we exit derivatives contracts with counterparties that (i) do not maintain compliance with (or obtain a waiver from) the terms of their ISDA agreements with us; or (ii) do not maintain their status as a primary government dealer or affiliate by the U.S. Department of Treasury or do not meet internally established guidelines regarding credit worthiness. Our ISDA agreements currently require full bilateral collateralization of unrealized loss exposures with our derivative counterparties. Through a margin posting process, our positions are revalued with counterparties each business day and cash margin is generally transferred to either us or our derivative counterparties as collateral based upon the directional changes in fair value of the positions. We also attempt to transact with several different counterparties in order to reduce our specific counterparty exposure. We consider counterparty risk as part of our fair value assessments of all derivative financial instruments. At December 31, 2013, we assessed this risk as remote and did not record a specific valuation adjustment.
At December 31, 2013, we had outstanding derivative agreements with five counterparties and were in compliance with ISDA agreements governing our open derivative positions.
Note 11. Other Assets and Accrued Expense and Other Liabilities
Other Assets
Other assets at December 31, 2013 and 2012 are summarized in the following table.
| (In Thousands) |
December 31, 2013 | December 31, 2012 | ||||||
| Margin receivable |
$ | 31,149 | $ | 63,424 | ||||
| Investment receivable |
8,923 | 153 | ||||||
| Other pledged collateral |
5,000 | - | ||||||
| REO |
3,661 | 4,245 | ||||||
| Prepaid expenses |
1,850 | 1,684 | ||||||
| Fixed assets and leasehold improvements |
1,232 | 494 | ||||||
| Income tax receivables |
170 | 4,762 | ||||||
| Other |
1,655 | 618 | ||||||
|
|
|
|
|
|||||
| Total Other Assets |
$ | 53,640 | $ | 75,380 | ||||
|
|
|
|
|
|||||
Margin receivable resulted from margin calls from our swap, master repurchase agreements, and warehouse facilities counterparties that required us to post collateral.
The carrying value of REO at December 31, 2013, was $4 million, which includes the net effect of $5 million related to transfers into REO during 2013, offset by $5 million of REO liquidations, and less than $1 million of negative market valuation adjustments. At December 31, 2013 and 2012, there were 20 and 24 REO properties, respectively, recorded on our consolidated balance sheets, all of which were owned at consolidated Sequoia entities.
At December 31, 2012, income tax receivable consisted of a federal carry back claim from RWT Holdings, Inc., a taxable REIT subsidiary, related to previous tax years. We received this amount in full during the year ended December 31, 2013.
F-54
REDWOOD TRUST, INC. AND SUBSIDIARIES
NOTES TO CONSOLIDATED FINANCIAL STATEMENTS
December 31, 2013
Note 11. Other Assets and Accrued Expense and Other Liabilities - (continued)
Accrued Expenses and Other Liabilities
Accrued expenses and other liabilities at December 31, 2013 and 2012 are summarized in the following table.
| (In Thousands) |
December 31, 2013 | December 31, 2012 | ||||||
| Accrued compensation |
$ | 22,160 | $ | 20,162 | ||||
| Legal reserve |
12,000 | - | ||||||
| Derivative margin payable |
4,700 | 1,980 | ||||||
| Accrued operating expenses |
4,291 | 855 | ||||||
| Residential repurchase reserve |
1,771 | - | ||||||
| Income tax payable |
1,337 | 793 | ||||||
| Other |
2,445 | 3,112 | ||||||
|
|
|
|
|
|||||
| Total Other Liabilities |
$ | 48,704 | $ | 26,902 | ||||
|
|
|
|
|
|||||
See Note 15 for additional information on the legal and residential repurchase reserves.
Note 12. Short-Term Debt
We enter into repurchase agreements, bank warehouse agreements, and other forms of collateralized (and generally uncommitted) short-term borrowings with several banks and major investment banking firms. At December 31, 2013, we had outstanding agreements with 13 bank counterparties and we were in compliance with all of the related covenants. The table below summarizes the facilities that are available to us and the balances of short-term debt at December 31, 2013 and 2012, by the type of collateral securing the debt.
Short-Term Debt
| December 31, 2013 | ||||||||||||||||
| (Dollars in Thousands) |
Number
of Facilities |
Outstanding | Limit | Maturity | ||||||||||||
| Collateral Type |
||||||||||||||||
| Residential loans |
5 | $ | 184,789 | $ | 1,400,000 | 1/2014 -12/2014 | ||||||||||
| Commercial loans |
1 | - | 100,000 | 4/2014 | ||||||||||||
| Real estate securities |
7 | 677,974 | - | 1/2014 -2/2014 | ||||||||||||
|
|
|
|
|
|||||||||||||
| Total |
13 | $ | 862,763 | |||||||||||||
|
|
|
|
|
|||||||||||||
| December 31, 2012 | ||||||||||||||||
| (Dollars in Thousands) |
Number of Facilities |
Outstanding | Limit | Maturity | ||||||||||||
| Collateral Type |
||||||||||||||||
| Residential loans |
4 | $ | 179,982 | $ | 800,000 | 1/2013 - 11/2013 | ||||||||||
| Real estate securities |
7 | 371,936 | - | 1/2013 - 3/2013 | ||||||||||||
|
|
|
|
|
|||||||||||||
| Total |
11 | $ | 551,918 | |||||||||||||
|
|
|
|
|
|||||||||||||
Borrowings under these facilities are generally charged interest based on a specified margin over the one-month LIBOR interest rate. At December 31, 2013, all of these borrowings were under uncommitted facilities and were due within 364 days (or less) of the borrowing date. The fair value of residential loans and real estate securities pledged as collateral was $205 million and $839 million, respectively, at December 31, 2013. For the years ended December 31, 2013 and 2012, the average balance of short-term debt was $989 million and $487 million, respectively. At December 31, 2013 and 2012, accrued interest payable on short-term debt was less than $1 million.
F-55
REDWOOD TRUST, INC. AND SUBSIDIARIES
NOTES TO CONSOLIDATED FINANCIAL STATEMENTS
December 31, 2013
Note 12. Short-Term Debt - (continued)
We also maintain a $10 million committed line of credit with one financial institution, which is secured by our pledge of certain mortgage-backed securities we own. At both December 31, 2013 and 2012, we had no outstanding borrowings on this facility.
Characteristics of Short-Term Debt
The table below summarizes short-term debt by weighted average interest rates and by collateral type at December 31, 2013 and 2012.
| December 31, 2013 | December 31, 2012 | |||||||||||||||||||||||
| (Dollars in Thousands) |
Amount Borrowed |
Weighted Average Interest Rate |
Weighted Average Days Until Maturity |
Amount Borrowed |
Weighted Average Interest Rate |
Weighted Average Days Until Maturity |
||||||||||||||||||
| Collateral Type |
||||||||||||||||||||||||
| Residential loan collateral |
$ | 184,789 | 1.71% | 228 | $ | 179,982 | 1.76% | 212 | ||||||||||||||||
| Commercial loan collateral |
- | - | - | - | - | - | ||||||||||||||||||
| Real estate securities collateral |
677,974 | 1.34% | 15 | 371,936 | 1.83% | 23 | ||||||||||||||||||
|
|
|
|
|
|||||||||||||||||||||
| Total Short-Term Debt |
$ | 862,763 | 1.42% | 61 | $ | 551,918 | 1.81% | 84 | ||||||||||||||||
|
|
|
|
|
|||||||||||||||||||||
Remaining Maturities of Short-Term Debt
The following table presents the remaining maturities of short-term debt at December 31, 2013 and 2012.
| (In Thousands) |
December 31, 2013 | December 31, 2012 | ||||||
| Within 30 days |
$ | 659,262 | $ | 362,279 | ||||
| 31 to 90 days |
54,434 | 48,848 | ||||||
| Over 90 days |
149,067 | 140,791 | ||||||
|
|
|
|
|
|||||
| Total Short-Term Debt |
$ | 862,763 | $ | 551,918 | ||||
|
|
|
|
|
|||||
Note 13. Asset-Backed Securities Issued
Through our Sequoia securitization program, we sponsor securitization transactions in which ABS backed by residential mortgage loans are issued by Sequoia entities. ABS were also issued by securitization entities in the Residential Resecuritization and the Commercial Securitization. Each securitization entity is independent of Redwood and of each other and the assets and liabilities are not owned by and are not legal obligations of Redwood. Our exposure to these entities is primarily through the financial interests we have retained, although we are exposed to certain financial risks associated with our role as a sponsor, manager, or depositor of these entities.
As a general matter, ABS have been issued by these securitization entities to fund the acquisition of assets from us or from third parties. The ABS issued by these entities consist of various classes of securities that pay interest on a monthly or quarterly basis. Substantially all ABS issued pay variable rates of interest, which are indexed to one-, three-, or six-month LIBOR. Some ABS issued pay fixed rates of interest or pay hybrid rates, which are fixed rates that subsequently adjust to variable rates. ABS issued also includes some interest-only classes with coupons set at a fixed rate or a fixed spread to a benchmark rate, or set at a spread to the interest rates earned on the assets less the interest rates paid on the liabilities of a securitization entity.
F-56
REDWOOD TRUST, INC. AND SUBSIDIARIES
NOTES TO CONSOLIDATED FINANCIAL STATEMENTS
December 31, 2013
Note 13. Asset-Backed Securities Issued - (continued)
The carrying values of ABS issued by consolidated securitization entities we sponsored at December 31, 2013 and 2012, along with other selected information, are summarized in the following table.
Asset-Backed Securities Issued
| December 31, 2013 | ||||||||||||||||
| (Dollars in Thousands) |
Sequoia | Residential Resecuritization |
Commercial Securitization |
Total | ||||||||||||
| Certificates with principal balance |
$ | 1,708,324 | $ | 94,934 | $ | 153,693 | $ | 1,956,951 | ||||||||
| Interest-only certificates |
3,400 | - | - | 3,400 | ||||||||||||
| Unamortized premium |
- | - | - | - | ||||||||||||
| Unamortized discount |
(17,389) | - | - | (17,389) | ||||||||||||
|
|
|
|
|
|
|
|
|
|||||||||
| Total ABS Issued |
$ | 1,694,335 | $ | 94,934 | $ | 153,693 | $ | 1,942,962 | ||||||||
|
|
|
|
|
|
|
|
|
|||||||||
| Range of weighted average interest rates, by series |
0.24% to 4.23% | 2.21% | 5.62% | |||||||||||||
| Stated maturities |
2014 - 2047 | 2046 | 2018 | |||||||||||||
| Number of series |
24 | 1 | 1 | |||||||||||||
| December 31, 2012 | ||||||||||||||||
| (Dollars in Thousands) |
Sequoia | Residential Resecuritization |
Commercial Securitization |
Total | ||||||||||||
| Certificates with principal balance |
$ | 2,207,851 | $ | 164,746 | $ | 171,714 | $ | 2,544,311 | ||||||||
| Interest-only certificates |
7,769 | - | - | 7,769 | ||||||||||||
| Unamortized premium |
921 | - | - | 921 | ||||||||||||
| Unamortized discount |
(23,060) | - | - | (23,060) | ||||||||||||
|
|
|
|
|
|
|
|
|
|||||||||
| Total ABS Issued |
$ | 2,193,481 | $ | 164,746 | $ | 171,714 | $ | 2,529,941 | ||||||||
|
|
|
|
|
|
|
|
|
|||||||||
| Range of weighted average interest rates, by series |
0.41% to 4.16% | 2.21% | 5.62% | |||||||||||||
| Stated maturities |
2014 - 2047 | 2046 | 2018 | |||||||||||||
| Number of series |
24 | 1 | 1 | |||||||||||||
The actual maturity of each class of ABS issued is primarily determined by the rate of principal prepayments on the assets of the issuing entity. Each series is also subject to redemption prior to the stated maturity according to the terms of the respective governing documents of each ABS issuing entity. As a result, the actual maturity of ABS issued may occur earlier than its stated maturity. At December 31, 2013, $1.91 billion of ABS issued ($1.93 billion principal balance) had contractual maturities beyond five years and $25 million of ABS issued ($25 million principal balance) had contractual maturities of one to five years. Amortization of Sequoia, Commercial Securitization, and Residential Resecuritization deferred ABS issuance costs was $3 million for both of the years ended December 31, 2013 and 2012.
The following table summarizes the accrued interest payable on ABS issued at December 31, 2013 and 2012. Interest due on Sequoia, Residential Resecuritization, and Commercial Securitization ABS issued is payable monthly.
Accrued Interest Payable on Asset-Backed Securities Issued
| (In Thousands) |
December 31, 2013 | December 31, 2012 | ||||||
| Sequoia |
$ | 1,218 | $ | 2,103 | ||||
| Residential Resecuritization |
11 | 40 | ||||||
| Commercial Securitization |
720 | 832 | ||||||
|
|
|
|
|
|||||
| Total Accrued Interest Payable on ABS Issued |
$ | 1,949 | $ | 2,975 | ||||
|
|
|
|
|
|||||
F-57
REDWOOD TRUST, INC. AND SUBSIDIARIES
NOTES TO CONSOLIDATED FINANCIAL STATEMENTS
December 31, 2013
Note 13. Asset-Backed Securities Issued - (continued)
The following table summarizes the carrying value components of the collateral for ABS issued and outstanding at December 31, 2013 and 2012.
Collateral for Asset-Backed Securities Issued
| December 31, 2013 | ||||||||||||||||
| (In Thousands) |
Sequoia | Residential Resecuritization |
Commercial Securitization |
Total | ||||||||||||
| Residential loans |
$ | 1,762,167 | $ | - | $ | - | $ | 1,762,167 | ||||||||
| Commercial loans |
- | - | 257,741 | 257,741 | ||||||||||||
| Real estate securities |
- | 263,204 | - | 263,204 | ||||||||||||
| Restricted cash |
152 | - | 137 | 289 | ||||||||||||
| Accrued interest receivable |
2,714 | 627 | 1,975 | 5,316 | ||||||||||||
| REO |
3,661 | - | - | 3,661 | ||||||||||||
|
|
|
|
|
|
|
|
|
|||||||||
| Total Collateral for ABS Issued |
$ | 1,768,694 | $ | 263,831 | $ | 259,853 | $ | 2,292,378 | ||||||||
|
|
|
|
|
|
|
|
|
|||||||||
| December 31, 2012 | ||||||||||||||||
| (In Thousands) |
Sequoia | Residential Resecuritization |
Commercial Securitization |
Total | ||||||||||||
| Residential loans |
$ | 2,272,812 | $ | - | $ | - | $ | 2,272,812 | ||||||||
| Commercial loans |
- | - | 283,610 | 283,610 | ||||||||||||
| Real estate securities |
- | 324,606 | - | 324,606 | ||||||||||||
| Restricted cash |
147 | - | 137 | 284 | ||||||||||||
| Accrued interest receivable |
4,484 | 839 | 2,132 | 7,455 | ||||||||||||
| REO |
4,245 | - | - | 4,245 | ||||||||||||
|
|
|
|
|
|
|
|
|
|||||||||
| Total Collateral for ABS Issued |
$ | 2,281,688 | $ | 325,445 | $ | 285,879 | $ | 2,893,012 | ||||||||
|
|
|
|
|
|
|
|
|
|||||||||
Note 14. Long-Term Debt
Commercial Borrowings
At December 31, 2013, we had one commercial loan repurchase facility with an outstanding balance of $49 million and a total borrowing limit of $150 million, with a remaining maturity of 21 months. Borrowings under this facility are generally charged interest based on a specified margin over the one-month LIBOR interest rate. For the year ended December 31, 2013, the average balance of this commercial borrowing was $26 million. The fair value of commercial loans pledged as collateral was $79 million at December 31, 2013. The interest expense yield on this borrowing was 6.27%, for the year ended December 31, 2013. There was no balance on this warehouse facility at December 31, 2012.
At December 31, 2013, we were in compliance with all of the covenants related to our commercial loan repurchase facility.
Convertible Notes
In March 2013, we issued $287.5 million principal amount of 4.625% convertible senior notes due 2018. These convertible notes require semi-annual interest distributions at a fixed coupon rate of 4.625% until maturity or conversion, which will be no later than April 15, 2018. After deducting the underwriting discount and offering costs, we received approximately $279 million of net proceeds. Including amortization of deferred securities issuance costs, the interest expense yield on our convertibles notes was 5.49% for the year ended December 31, 2013. At December 31, 2013, the accrued interest payable balance on this debt was $3 million.
At December 31, 2013, our convertible senior notes were convertible at the option of the holder at a conversion rate of 41.1320 common shares per $1,000 principal amount of convertible senior notes (equivalent to a conversion price of $24.31 per common share). Upon conversion of these convertible senior notes by a holder, the holder will receive shares of our common stock.
F-58
REDWOOD TRUST, INC. AND SUBSIDIARIES
NOTES TO CONSOLIDATED FINANCIAL STATEMENTS
December 31, 2013
Note 14. Long-Term Debt - (continued)
Trust Preferred Securities and Subordinated Notes
In 2006, we issued $100 million of trust preferred securities through Redwood Capital Trust I, a Delaware statutory trust, in a private placement transaction. These trust preferred securities require quarterly distributions at a floating coupon rate equal to three-month LIBOR plus 2.25% until the notes are redeemed, which will be no later than January 30, 2037. The interest expense yield on our trust preferred securities was 2.64% and 2.84% for the years ended December 31, 2013 and 2012, respectively. Including hedging costs and amortization of deferred securities issuance costs, the interest expense yield on our trust preferred securities was 6.90% and 6.89% for the years ended December 31, 2013 and 2012, respectively. The earliest optional redemption date without penalty was January 30, 2012. In December 2010, we repurchased $500 thousand principal amount of these trust preferred securities.
In 2007, we issued an additional $50 million of subordinated notes. These subordinated notes require quarterly distributions at a floating interest rate equal to three-month LIBOR plus 2.25% until the notes are redeemed, which will be no later than July 30, 2037. The interest expense yield on our subordinated notes was 2.64% and 2.84% for the years ended December 31, 2013 and 2012, respectively. Including hedging costs and amortization of deferred securities issuance costs, the interest expense yield on our subordinated notes was 6.90% and 6.89% for the years ended December 31, 2013 and 2012, respectively. The earliest optional redemption date without a penalty was July 30, 2012. In July 2009, we repurchased $10 million principal amount of this subordinated debt.
At both December 31, 2013 and 2012, the accrued interest payable balance on long-term debt was less than $1 million. Under the terms of this long-term debt, we covenant, among other things, to use our best efforts to continue to qualify as a REIT. If an event of default were to occur in respect of this long-term debt, we would generally be restricted under its terms (subject to certain exceptions) from making dividend distributions to stockholders, from repurchasing common stock or repurchasing or redeeming any other then-outstanding equity securities, and from making any other payments in respect of any equity interests in us or in respect of any then-outstanding debt that is pari passu or subordinate to this long-term debt.
Note 15. Commitments and Contingencies
Lease Commitments
At December 31, 2013, we were obligated under four non-cancelable operating leases with expiration dates through 2021 for $11 million. During 2013, a new lease, including an amendment to expand the original premises, for our Denver-based operations became effective. We do not have a 2013 rent obligation for this lease due to an abatement period through the first quarter of 2014. The total rent obligation through 2021 is $4 million. Operating lease expense was $2 million, $1 million, and $2 million for the years ended December 31, 2013, 2012, and 2011, respectively.
The following table presents our future lease commitments at December 31, 2013.
Future Lease Commitments by Year
| (In Thousands) |
December 31, 2013 | |||
| 2014 |
$ | 2,250 | ||
| 2015 |
2,302 | |||
| 2016 |
2,056 | |||
| 2017 |
2,111 | |||
| 2018 |
1,209 | |||
| 2019 and thereafter |
1,199 | |||
|
|
|
|||
| Total |
$ | 11,127 | ||
|
|
|
|||
Leasehold improvements for our offices are amortized into expense over the lease term. There were $68 thousand of unamortized leasehold improvements at December 31, 2013. For the years ended December 31, 2013 and 2012, we recognized a negligible amount of leasehold amortization expense.
F-59
REDWOOD TRUST, INC. AND SUBSIDIARIES
NOTES TO CONSOLIDATED FINANCIAL STATEMENTS
December 31, 2013
Note 15. Commitments and Contingencies - (continued)
Loss Contingencies — Residential Repurchase Reserve
We maintain a repurchase reserve for potential obligations arising from representation and warranty violations related the residential loans we have sold to securitization trusts or third parties. We do not originate residential loans and we believe the initial risk of loss due to loan repurchases (i.e., due to a breach of representations and warranties) would generally be a contingency to the companies from whom we acquired the loans. However, in some cases, for example, where loans were acquired from companies that have since become insolvent, repurchase claims may result in our being liable for a repurchase obligation.
During the year ended December 31, 2013, we recorded a $1.8 million repurchase reserve associated with our residential loans. This liability is in “Accrued expenses and other liabilities” in our consolidated balance sheet and the provision for repurchase losses is included in mortgage banking activities, net in our consolidated statements of income. We did not receive any repurchase requests for either of the years ended December 31, 2013 or 2012 and we did not repurchase any loans during those years.
Loss Contingencies — Litigation
On or about December 23, 2009, the Federal Home Loan Bank of Seattle (the “FHLB-Seattle”) filed a complaint in the Superior Court for the State of Washington (case number 09-2-46348-4 SEA) against Redwood Trust, Inc., our subsidiary, Sequoia Residential Funding, Inc. (“SRF”), Morgan Stanley & Co., and Morgan Stanley Capital I, Inc. (collectively, the “FHLB-Seattle Defendants”) alleging that the FHLB-Seattle Defendants made false or misleading statements in offering materials for a mortgage pass-through certificate (the “Seattle Certificate”) issued in the Sequoia Mortgage Trust 2005-4 securitization transaction (the “2005-4 RMBS”) and purchased by the FHLB-Seattle. Specifically, the complaint alleges that the alleged misstatements concern the (1) loan-to-value ratio of mortgage loans and the appraisals of the properties that secured loans supporting the 2005-4 RMBS, (2) occupancy status of the properties, (3) standards used to underwrite the loans, and (4) ratings assigned to the Seattle Certificate. The FHLB-Seattle alleges claims under the Securities Act of Washington (Section 21.20.005, et seq.) and seeks to rescind the purchase of the Seattle Certificate and to collect interest on the original purchase price at the statutory interest rate of 8% per annum from the date of original purchase (net of interest received) as well as attorneys’ fees and costs. The Seattle Certificate was issued with an original principal amount of approximately $133 million, and, as of December 31, 2013, the FHLB-Seattle has received approximately $114.4 million of principal and $11.0 million of interest payments in respect of the Seattle Certificate. The claims were subsequently dismissed for lack of personal jurisdiction as to Redwood Trust and SRF. Redwood agreed to indemnify the underwriters of the 2005-4 RMBS for certain losses and expenses they might incur as a result of claims made against them relating to this RMBS, including, without limitation, certain legal expenses. The FHLB-Seattle’s claims against the underwriters of this RMBS were not dismissed and remain pending. Regardless of the outcome of this litigation, Redwood could incur a loss as a result of these indemnities.
On or about July 15, 2010, The Charles Schwab Corporation (“Schwab”) filed a complaint in the Superior Court for the State of California in San Francisco (case number CGC-10-501610) against SRF and 26 other defendants (collectively, the “Schwab Defendants”) alleging that the Schwab Defendants made false or misleading statements in offering materials for various residential mortgage-backed securities sold or issued by the Schwab Defendants. With respect to SRF, Schwab alleges that SRF made false or misleading statements in offering materials for a mortgage pass-through certificate (the “Schwab Certificate”) issued in the 2005-4 RMBS and purchased by Schwab. Specifically, the complaint alleges that the misstatements for the 2005-4 RMBS concern the (1) loan-to-value ratio of mortgage loans and the appraisals of the properties that secured loans supporting the 2005-4 RMBS, (2) occupancy status of the properties, (3) standards used to underwrite the loans, and (4) ratings assigned to the Schwab Certificate. Schwab alleges a claim for negligent misrepresentation under California state law and seeks unspecified damages and attorneys’ fees and costs. The Schwab Certificate was issued with an original principal amount of approximately $14.8 million, and, as of December 31, 2013, Schwab has received approximately $12.7 million of principal and $1.3 million of interest payments in respect of the Schwab Certificate. SRF has denied Schwab’s allegations. We intend to defend the action vigorously. Redwood agreed to indemnify the underwriters of the 2005-4 RMBS, which underwriters are also named defendants in this action, for certain losses and expenses they might incur as a result of claims made against them relating to this RMBS, including, without limitation, certain legal expenses. Regardless of the outcome of this litigation, Redwood could incur a loss as a result of these indemnities.
On or about October 15, 2010, the Federal Home Loan Bank of Chicago (“FHLB-Chicago”) filed a complaint in the Circuit Court of Cook County, Illinois (case number 10-CH-45033) against SRF and more than 45 other named defendants (collectively, the “FHLB-Chicago Defendants”) alleging that the FHLB-Chicago Defendants made false or misleading statements in offering materials
F-60
REDWOOD TRUST, INC. AND SUBSIDIARIES
NOTES TO CONSOLIDATED FINANCIAL STATEMENTS
December 31, 2013
Note 15. Commitments and Contingencies - (continued)
for various RMBS sold or issued by the FHLB-Chicago Defendants or entities controlled by them. FHLB-Chicago subsequently amended the complaint to name Redwood Trust, Inc. and another one of our subsidiaries, RWT Holdings, Inc., as defendants. With respect to Redwood Trust, Inc., RWT Holdings, Inc., and SRF, the FHLB-Chicago alleges that SRF, Redwood Trust, Inc., and RWT Holdings, Inc. made false or misleading statements in the offering materials for two mortgage pass-through certificates (the “Chicago Certificates”) issued in the Sequoia Mortgage Trust 2006-1 securitization transaction (the “2006-1 RMBS”) and purchased by the FHLB-Chicago. The complaint alleges that the alleged misstatements concern, among other things, the (1) loan-to-value ratio of mortgage loans and the appraisals of the properties that secured loans supporting the 2006-1 RMBS, (2) occupancy status of the properties, (3) standards used to underwrite the loans, (4) ratings assigned to the Chicago Certificates, and (5) due diligence performed on these mortgage loans. The FHLB-Chicago alleges claims under Illinois Securities Law (815 ILCS Sections 5/12(F)-(H)) and North Carolina Securities Law (N.C.G.S.A. §78A-8(2) & §78A-56(a)) as well as a claim for negligent misrepresentation under Illinois common law. On some of the causes of action, the FHLB-Chicago seeks to rescind the purchase of the Chicago Certificates and to collect interest on the original purchase prices at the statutory interest rate of 10% per annum from the dates of original purchase (net of interest received). On one cause of action, the FHLB-Chicago seeks unspecified damages. The FHLB-Chicago also seeks attorneys’ fees and costs. The first of the Chicago Certificates was issued with an original principal amount of approximately $105 million and, as of December 31, 2013, the FHLB Chicago has received approximately $72.3 million of principal and $24.2 million of interest payments in respect of this Chicago Certificate. The second of the Chicago Certificates was issued with an original principal amount of approximately $379 million and, as of December 31, 2013, the FHLB Chicago has received approximately $258.6 million of principal and $81.5 million of interest payments in respect of this Chicago Certificate. SRF, Redwood Trust, Inc., and RWT Holdings, Inc. have denied FHLB-Chicago’s allegations. This case is in early stages of discovery, and no trial date has been set. We intend to defend the action vigorously. Redwood agreed to indemnify the underwriters of the 2006-1 RMBS, which underwriters are also named defendants in this action, for certain losses and expenses they might incur as a result of claims made against them relating to this RMBS, including, without limitation, certain legal expenses. Regardless of the outcome of this litigation, Redwood could incur a loss as a result of these indemnities.
In accordance with GAAP, we review the need for any loss contingency reserves and establish reserves when, in the opinion of management, it is probable that a matter would result in a liability and the amount of loss, if any, can be reasonably estimated. Additionally, we record receivables for insurance recoveries relating to litigation-related losses and expenses if and when such amounts are covered by insurance and recovery of such losses or expenses are due. At December 31, 2013, the aggregate amount of loss contingency reserves established in respect of the three above-referenced litigation matters was $12.0 million. We review our litigation matters each quarter to assess these loss contingency reserves and make adjustments in these reserves, upwards or downwards, as appropriate, in accordance with GAAP based on our review.
Although we intend to continue to defend vigorously the actions to which we are a party, in the ordinary course of any litigation matter, including certain of the above-referenced matters, we have engaged and may continue to engage in formal or informal settlement communications with the plaintiffs. Settlement communications we have engaged in relating to certain of the above-referenced litigation matters are one of the factors that have resulted in our determination to establish the loss contingency reserves described above. We cannot be certain that any of these matters will be resolved through a settlement prior to trial and we cannot be certain that the resolution of these matters, whether through trial or settlement, will not have a material adverse effect on our financial condition or results of operations in any future period.
Future developments (including resolution of substantive pre-trial motions relating to these matters, receipt of additional information and documents relating to these matters (such as through pre-trial discovery), new or additional settlement communications with plaintiffs relating to these matters, or resolutions of similar claims against other defendants in these matters) could result in our concluding in the future to establish additional loss contingency reserves or to disclose an estimate of reasonably possible losses in excess of our established reserves with respect to these matters. Our actual losses with respect to the above-referenced litigation matters may be materially higher than the aggregate amount of loss contingency reserves we have established in respect of these litigation matters, including in the event that any of these matters proceeds to trial and the plaintiff prevails. Other factors that could result in our concluding to establish additional loss contingency reserves or estimate additional reasonably possible losses, or could result in our actual losses with respect to the above-referenced litigation matters being materially higher than the aggregate amount of loss contingency reserves we have established in respect of these litigation matters include that: there are significant factual and legal issues to be resolved; information obtained or rulings made during the lawsuits could affect the methodology for calculation of the available remedies; and we may have additional obligations pursuant to indemnity agreements, representations and warranties, and other contractual provisions with other parties relating to these litigation matters that could increase our potential losses.
F-61
REDWOOD TRUST, INC. AND SUBSIDIARIES
NOTES TO CONSOLIDATED FINANCIAL STATEMENTS
December 31, 2013
Note 16. Equity
The following table provides a summary of changes to accumulated other comprehensive income by component for the year ended December 31, 2013.
Changes in Accumulated Other Comprehensive Income by Component
| Year Ended December 31, 2013 (In Thousands) |
Net unrealized gains on available-for-sale securities |
Net unrealized losses on interest rate agreements accounted for as cash flow hedges |
||||||
| Balance at beginning of period |
$ | 186,580 | $ | (48,248) | ||||
| Other comprehensive (loss) income before reclassifications |
(1,918) | 32,079 | ||||||
| Amounts reclassified from other accumulated comprehensive income |
(20,008) | 281 | ||||||
|
|
|
|
|
|||||
| Net current-period other comprehensive (loss) income |
(21,926) | 32,360 | ||||||
|
|
|
|
|
|||||
| Balance at End of Period |
$ | 164,654 | $ | (15,888) | ||||
|
|
|
|
|
|||||
The following table provides a summary of reclassifications out of accumulated other comprehensive income for the year ended December 31, 2013.
Reclassifications Out of Accumulated Other Comprehensive Income
| (In Thousands) |
Affected Line Item in the |
Amount Reclassified from Accumulated Other Comprehensive Income for the Year Ended December 31, 2013 |
||||
| Net realized gains (losses) on AFS securities |
||||||
| Other than temporary impairment |
Other market valuations, net |
$ | 499 | |||
| Gain on sale of AFS securities |
Realized gains, net |
19,509 | ||||
|
|
|
|||||
| $ | 20,008 | |||||
|
|
|
|||||
| Net realized gains on interest rate agreements designated as cash flow hedges |
||||||
| Amortization of deferred loss |
Interest expense |
$ | (281) | |||
|
|
|
|||||
| $ | (281) | |||||
|
|
|
|||||
F-62
REDWOOD TRUST, INC. AND SUBSIDIARIES
NOTES TO CONSOLIDATED FINANCIAL STATEMENTS
December 31, 2013
Note 16. Equity - (continued)
Earnings Per Common Share
The following table provides the basic and diluted earnings per common share computations for the years ended December 31, 2013, 2012, and 2011.
Basic and Diluted Earnings Per Common Share
| Year Ended December 31, | ||||||||||||
| (In Thousands, Except Share Data) |
2013 | 2012 | 2011 | |||||||||
| Basic Earnings Per Common Share: |
||||||||||||
| Net income attributable to Redwood |
$ | 173,246 | $ | 131,769 | $ | 26,343 | ||||||
| Less: Dividends and undistributed earnings allocated to participating securities |
(4,899) | (3,886) | (2,246) | |||||||||
|
|
|
|
|
|
|
|||||||
| Net income allocated to common shareholders |
$ | 168,347 | $ | 127,883 | $ | 24,097 | ||||||
|
|
|
|
|
|
|
|||||||
| Basic weighted average common shares outstanding |
81,985,897 | 79,529,950 | 78,299,510 | |||||||||
| Basic Earnings Per Common Share |
$ | 2.05 | $ | 1.61 | $ | 0.31 | ||||||
| Diluted Earnings Per Common Share: |
||||||||||||
| Net income attributable to Redwood |
$ | 173,246 | $ | 131,769 | $ | 26,343 | ||||||
| Less: Dividends and undistributed earnings allocated to participating securities |
(3,726) | (3,212) | (2,246) | |||||||||
| Add back: Interest expense on convertible notes |
12,641 | - | - | |||||||||
|
|
|
|
|
|
|
|||||||
| Net income allocated to common shareholders |
$ | 182,161 | $ | 128,557 | $ | 24,097 | ||||||
|
|
|
|
|
|
|
|||||||
| Weighted average common shares outstanding |
81,985,897 | 79,529,950 | 78,299,510 | |||||||||
| Net effect of dilutive equity awards |
1,957,081 | 1,143,732 | - | |||||||||
| Net effect of assumed convertible notes conversion to common shares |
9,751,946 | - | - | |||||||||
|
|
|
|
|
|
|
|||||||
| Diluted weighted average common shares outstanding |
93,694,924 | 80,673,682 | 78,299,510 | |||||||||
|
|
|
|
|
|
|
|||||||
| Diluted Earnings Per Common Share |
$ | 1.94 | $ | 1.59 | $ | 0.31 | ||||||
For the years ended December 31, 2013 and 2012, there were 1,957,081 and 1,143,732 of dilutive equity awards, respectively, determined under the two-class method. We included participating securities in the calculation of diluted earnings per common share as we determined that the two-class method was more dilutive than the alternative treasury stock method. Dividends and undistributed earnings allocated to participating securities under the basic and diluted earnings per share calculations require specific shares to be included that may differ in certain circumstances. For the year ended December 31, 2013, 9,751,946 common shares related to the assumed conversion of the convertible notes were included in the calculation of diluted earnings per share.
For the years ended December 31, 2013, 2012, and 2011, the number of outstanding equity awards that were antidilutive totaled 224,241, 609,201, and 1,510,322, respectively, under the two-class method. There were no other participating securities during these periods.
Stock Repurchases
We announced a stock repurchase authorization in November 2007 for the repurchase of up to 5,000,000 common shares. This plan replaced all previous share repurchase plans and has no expiration date. During the year ended December 31, 2013, there were no shares acquired under the plan. At December 31, 2013, there remained 4,005,985 shares available for repurchase under this plan.
F-63
REDWOOD TRUST, INC. AND SUBSIDIARIES
NOTES TO CONSOLIDATED FINANCIAL STATEMENTS
December 31, 2013
Note 17. Equity Compensation Plans
At December 31, 2013 and 2012, 1,683,956 and 666,610 shares of common stock, respectively, were available for grant under Redwood’s Incentive Plan. The unamortized compensation cost under the Incentive Plan and the Employee Stock Purchase Plan totaled $21 million at December 31, 2013, as shown in the following table.
| Year Ended December 31, 2013 | ||||||||||||||||||||||||
| (In Thousands) |
Stock Options |
Restricted Stock |
Deferred Stock Units |
Performance Stock Units |
Employee Stock Purchase Plan |
Total | ||||||||||||||||||
| Unrecognized compensation cost at beginning of period |
$ | - | $ | 1,822 | $ | 13,378 | $ | 6,484 | $ | - | $ | 21,684 | ||||||||||||
| Equity grants |
- | 1,046 | 7,132 | 3,175 | 217 | 11,570 | ||||||||||||||||||
| Equity grant forfeitures |
- | (350) | (1,221) | (876) | - | (2,447) | ||||||||||||||||||
| Equity compensation expense |
- | (649) | (6,245) | (2,966) | (217) | (10,077) | ||||||||||||||||||
|
|
|
|
|
|
|
|
|
|
|
|
|
|||||||||||||
| Unrecognized Compensation Cost at End of Period |
$ | - | $ | 1,869 | $ | 13,044 | $ | 5,817 | $ | - | $ | 20,730 | ||||||||||||
|
|
|
|
|
|
|
|
|
|
|
|
|
|||||||||||||
At December 31, 2013, the weighted average amortization period remaining for all of our equity awards was less than two years.
Stock Options
The following table summarizes the activity related to stock options for the years ended December 31, 2013, 2012, and 2011.
Stock Options Activity
| Year Ended December 31, | ||||||||||||||||||||||||
| 2013 | 2012 | 2011 | ||||||||||||||||||||||
| Shares | Weighted Average Exercise Price |
Shares | Weighted Average Exercise Price |
Shares | Weighted Average Exercise Price |
|||||||||||||||||||
| Outstanding at beginning of period |
287,516 | $ | 54.18 | 380,779 | $ | 53.91 | 459,115 | $ | 53.13 | |||||||||||||||
| Granted |
- | - | - | - | - | - | ||||||||||||||||||
| Exercised |
- | - | - | - | - | - | ||||||||||||||||||
| Forfeited |
(3,016) | 50.15 | (4,500) | 49.73 | - | - | ||||||||||||||||||
| Expired |
(204,965) | 53.15 | (88,763) | 53.23 | (78,336) | 49.37 | ||||||||||||||||||
|
|
|
|
|
|
|
|||||||||||||||||||
| Outstanding at End of Period |
79,535 | $ | 57.00 | 287,516 | $ | 54.18 | 380,779 | $ | 53.91 | |||||||||||||||
|
|
|
|
|
|
|
|||||||||||||||||||
| Exercisable at End of Period |
79,535 | $ | 57.00 | 287,516 | $ | 54.18 | 380,779 | $ | 53.91 | |||||||||||||||
At December 31, 2013 and 2012, there were 79,535 and 287,516 fully vested stock options outstanding, respectively. As of December 31, 2011 all outstanding stock options were fully vested. There was no aggregate intrinsic value for the options outstanding and exercisable at December 31, 2013. For the years ended December 31, 2013, 2012 and 2011, there were no stock options exercised.
F-64
REDWOOD TRUST, INC. AND SUBSIDIARIES
NOTES TO CONSOLIDATED FINANCIAL STATEMENTS
December 31, 2013
Note 17. Equity Compensation Plans - (continued)
The following table summarizes information about outstanding and exercisable stock options at December 31, 2013.
Outstanding Stock Options as of December 31, 2013
| Options Outstanding and Exercisable | ||||||||||||
| Range of Exercise Prices |
Number Outstanding |
Weighted-Average Remaining Contractual Life |
Weighted-Average Exercise Price |
|||||||||
| $0 to $40 |
- | - | $ | - | ||||||||
| $40 to $50 |
10,000 | 0.35 | 48.48 | |||||||||
| $50 to $60 |
69,535 | 0.80 | 58.23 | |||||||||
|
|
|
|||||||||||
| $0 to $60 |
79,535 | 0.74 | $ | 57.00 | ||||||||
|
|
|
|||||||||||
Restricted Stock
The following table summarizes the activity related to restricted stock for the years ended December 31, 2013, 2012, and 2011.
Restricted Stock Activity
| Year Ended December 31, | ||||||||||||||||||||||||
| 2013 | 2012 | 2011 | ||||||||||||||||||||||
| Shares | Weighted Average Grant Date Fair Market Value |
Shares | Weighted Average Grant Date Fair Market Value |
Shares | Weighted Average Grant Date Fair Market Value |
|||||||||||||||||||
| Outstanding at beginning of period |
190,088 | $ | 13.12 | 184,409 | $ | 12.87 | 119,071 | $ | 15.68 | |||||||||||||||
| Granted |
52,103 | 18.71 | 43,111 | 16.47 | 85,218 | 10.62 | ||||||||||||||||||
| Vested |
(48,615) | 12.63 | (32,812) | 16.17 | (18,948) | 20.15 | ||||||||||||||||||
| Forfeited |
(26,635) | 13.14 | (4,620) | 12.57 | (932) | 18.44 | ||||||||||||||||||
|
|
|
|
|
|
|
|||||||||||||||||||
| Outstanding at End of Period |
166,941 | $ | 15.01 | 190,088 | $ | 13.12 | 184,409 | $ | 12.87 | |||||||||||||||
|
|
|
|
|
|
|
|||||||||||||||||||
There were 52,103 restricted stock awards granted during the year ended December 31, 2013. For each of the years ended December 31, 2013, 2012, and 2011, the expenses recorded for restricted stock awards were less than $1 million. As of December 31, 2013, there was $2 million of unrecognized compensation cost related to unvested restricted stock. This cost will be recognized over a weighted average period of two years. Restrictions on shares of restricted stock outstanding lapse through 2018.
F-65
REDWOOD TRUST, INC. AND SUBSIDIARIES
NOTES TO CONSOLIDATED FINANCIAL STATEMENTS
December 31, 2013
Note 17. Equity Compensation Plans - (continued)
Deferred Stock Units
The following table summarizes the activity related to DSUs for the years ended December 31, 2013, 2012, and 2011.
Deferred Stock Units Activity
| Year Ended December 31, | ||||||||||||||||||||||||
| 2013 | 2012 | 2011 | ||||||||||||||||||||||
|
|
Units | Weighted Average Grant Date Fair Market Value |
Units | Weighted Average Grant Date Fair Market Value |
Units | Weighted Average Grant Date Fair Market Value |
||||||||||||||||||
| Outstanding at beginning of period |
2,361,285 | $ | 14.46 | 2,476,171 | $ | 15.23 | 2,351,804 | $ | 18.60 | |||||||||||||||
| Granted |
552,250 | 19.31 | 503,174 | 15.17 | 598,542 | 11.05 | ||||||||||||||||||
| Distributions |
(558,008) | 15.51 | (520,909) | 19.10 | (456,638) | 27.14 | ||||||||||||||||||
| Forfeitures |
(89,054) | 11.18 | (97,151) | 12.98 | (17,537) | 14.43 | ||||||||||||||||||
|
|
|
|
|
|
|
|||||||||||||||||||
| Balance at End of Period (1) |
2,266,473 | $ | 15.41 | 2,361,285 | $ | 14.46 | 2,476,171 | $ | 15.23 | |||||||||||||||
|
|
|
|
|
|
|
|||||||||||||||||||
| (1) | PSU activity, including the number of PSUs outstanding, granted, distributed, and forfeited is not included in this table and is described below under the heading “Performance Stock Units”. |
We generally grant DSUs annually, in the fourth quarter, as part of our compensation process. In addition, DSUs are granted from time-to-time in connection with hiring and promotions and in lieu of the payment in cash of a portion of annual bonus earned. As of December 31, 2013, 2012, and 2011, the number of outstanding DSUs that were unvested was 1,003,053, 1,241,532, and 1,407,888, respectively. The weighted average grant-date fair value of these unvested DSUs was $15.55, $13.41, and $13.21, as of December 31, 2013, 2012, and 2011, respectively. Unvested DSUs at December 31, 2013 will vest through 2017.
Expenses related to DSUs were $6 million, $7 million, and $7 million for the years ended December 31, 2013, 2012, and 2011, respectively. As of December 31, 2013, there was $13 million of unrecognized compensation cost related to unvested DSUs. This cost will be recognized over a weighted average period of less than two years. As of December 31, 2013, 2012, and 2011, the number of outstanding DSUs that had vested was 1,263,420, 1,119,753, and 1,068,283, respectively.
Performance Stock Units
During 2013, 2012, and 2011, 223,749, 291,023, and 348,725 target number of PSUs were granted, respectively, with per unit grant date fair values of $14.19, $12.37, and $9.83, respectively. PSUs cliff vest, if at all, on the third anniversary of their grant date, with performance-based vesting contingent on total stockholder return over the three-year vesting period. For PSUs, the number of underlying shares of our common stock that vest at the end of the three-year vesting period will generally range from 0% to 200% of the target number of PSUs granted, with the target number of PSUs granted being adjusted to reflect the value of any dividends paid on our common stock during the vesting period. During the years ended December 31, 2013 and 2012, there were 75,362 and 45,764 target number of PSUs forfeited due to employee departures, respectively. As of December 31, 2013, the target number of PSUs that were unvested was 779,871.
The grant date fair values of PSUs were determined through Monte-Carlo simulations using the following assumptions: our common stock closing price on the day prior to the grant date, the average closing price of our common stock price for the 40 trading days prior to the grant date for the 2013 and 2012 grants (20 trading days prior to the grant date for 2011 grants), and the range of performance-based vesting based on total stockholder return over three years from the grant date. For the 2013 PSU grant, an implied volatility assumption of 27% (based on historical volatility), a risk free rate of 0.62% (the three-year Treasury rate on the grant date), and a 0% dividend yield (the mathematical equivalent to reinvesting the dividends over the three-year performance period as is consistent with the terms of the PSUs), were used. For the 2012 PSU grant, an implied volatility assumption of 25% (based on historical volatility), a risk free rate of 0.32% (the three-year Treasury rate on the grant date), and a 0% dividend yield (the mathematical equivalent to reinvesting the dividends over the three-year performance period as is consistent with the terms of the
F-66
REDWOOD TRUST, INC. AND SUBSIDIARIES
NOTES TO CONSOLIDATED FINANCIAL STATEMENTS
December 31, 2013
Note 17. Equity Compensation Plans - (continued)
PSUs), were used. For the 2011 PSU grant, an implied volatility assumption of 40% (based on historical volatility), a risk free rate of 0.41% (the three-year Treasury rate on the grant date), and a 0% dividend yield were used.
Expenses related to PSUs were $3 million, $2 million, and $1 million for the years ended December 31, 2013, 2012, and 2011, respectively. As of December 31, 2013, there was $6 million of unrecognized compensation cost related to unvested PSUs.
With respect to PSUs granted in 2010, the three-year performance period ended during the fourth quarter of 2013, resulting in the vesting of 351,640 shares of our underlying common stock. The distribution of these underlying shares of common stock will occur after December 31, 2013, in accordance with the terms of the PSUs and our Executive Deferred Compensation Plan.
Employee Stock Purchase Plan
The ESPP allows a maximum of 450,000 shares of common stock to be purchased in aggregate for all employees. As of December 31, 2013, 2012, and 2011, 243,020, 207,031, and 152,212, shares have been purchased, respectively, and there remained a negligible amount of uninvested employee contributions in the ESPP at December 31, 2013.
The following table summarizes the activity related to the ESPP for the years ended December 31, 2013, 2012, and 2011.
Employee Stock Purchase Plan Activity
| Year Ended December 31, | ||||||||||||
| (In Thousands) |
2013 | 2012 | 2011 | |||||||||
| Balance at beginning of period |
$ | 3 | $ | 8 | $ | - | ||||||
| Employee purchases |
518 | 474 | 332 | |||||||||
| Cost of common stock issued |
(518) | (479) | (324) | |||||||||
|
|
|
|
|
|
|
|||||||
| Balance at End of Period |
$ | 3 | $ | 3 | $ | 8 | ||||||
|
|
|
|
|
|
|
|||||||
Executive Deferred Compensation Plan
The following table summarizes the activity related to the EDCP for the years ended December 31, 2013, 2012, and 2011.
EDCP Cash Accounts Activity
| Year Ended December 31, | ||||||||||||
| (In Thousands) |
2013 | 2012 | 2011 | |||||||||
| Balance at beginning of period |
$ | 1,516 | $ | 1,494 | $ | 1,210 | ||||||
| New deferrals |
656 | 839 | 505 | |||||||||
| Accrued interest |
58 | 44 | 59 | |||||||||
| Withdrawals |
(348) | (861) | (280) | |||||||||
|
|
|
|
|
|
|
|||||||
| Balance at End of Period |
$ | 1,882 | $ | 1,516 | $ | 1,494 | ||||||
|
|
|
|
|
|
|
|||||||
Deferrals of less than $1 million were made to the cash accounts of the EDCP for each of the years ended December 31, 2013, 2012, and 2011.
F-67
REDWOOD TRUST, INC. AND SUBSIDIARIES
NOTES TO CONSOLIDATED FINANCIAL STATEMENTS
December 31, 2013
Note 18. Mortgage Banking Activities
The following table presents the components of mortgage banking activities, net, recorded in our consolidated income statement for the years ended December 31, 2013 and 2012.
Components of Mortgage Banking Activities, Net
| Year Ended December 31, | ||||||||
| (In Thousands) |
2013 | 2012 | ||||||
| Changes in fair value of: |
||||||||
| Residential loans, at fair value |
$ | (12,263) | $ | 37,762 | ||||
| Commercial loans, at fair value |
8,694 | - | ||||||
| Sequoia IO securities |
42,451 | (11,702) | ||||||
| Risk management derivatives (1) |
51,162 | (10,609) | ||||||
| Loan purchase and forward sale commitments |
(399) | - | ||||||
|
|
|
|
|
|||||
| Net market valuation adjustments |
89,645 | 15,451 | ||||||
| Net gains on residential loan sales |
- | 19,713 | ||||||
| Net gains on commercial loan originations |
40 | - | ||||||
| Net gains on commercial loan sales |
10,991 | 1,155 | ||||||
|
|
|
|
|
|||||
| Mortgage Banking Activities, Net |
$ | 100,676 | $ | 36,319 | ||||
|
|
|
|
|
|||||
| (1) | Represents market valuations of derivatives that are used to manage risks associated with our accumulation of residential loans. |
Note 19. Operating Expenses
Components of our operating expenses for the years ended December 31, 2013, 2012, and 2011, are presented in the following table.
Operating Expenses
| Year Ended December 31, | ||||||||||||
| (In Thousands) |
2013 | 2012 | 2011 | |||||||||
| Fixed compensation expense |
$ | 23,248 | $ | 17,880 | $ | 15,371 | ||||||
| Variable compensation expense |
18,366 | 16,720 | 2,890 | |||||||||
| Equity compensation expense |
10,077 | 9,784 | 9,067 | |||||||||
| Severance expense |
3,879 | 215 | 71 | |||||||||
|
|
|
|
|
|
|
|||||||
| Total compensation expense |
55,570 | 44,599 | 27,399 | |||||||||
| Systems and consulting |
9,886 | 5,339 | 7,592 | |||||||||
| Accounting and legal |
6,263 | 5,197 | 4,177 | |||||||||
| Office costs |
3,503 | 3,628 | 3,933 | |||||||||
| Corporate costs |
2,721 | 2,758 | 2,958 | |||||||||
| Other operating expenses |
6,846 | 3,838 | 1,682 | |||||||||
|
|
|
|
|
|
|
|||||||
| Total Operating Expenses |
$ | 84,789 | $ | 65,359 | $ | 47,741 | ||||||
|
|
|
|
|
|
|
|||||||
F-68
REDWOOD TRUST, INC. AND SUBSIDIARIES
NOTES TO CONSOLIDATED FINANCIAL STATEMENTS
December 31, 2013
Note 20. Taxes
Components of our net deferred tax assets at December 31, 2013 and 2012 are presented in the following table.
Deferred Tax Assets (Liabilities)
| (In Thousands) |
December 31, 2013 | December 31, 2012 | ||||||
| Deferred tax assets |
||||||||
| Net operating loss carryforward – state |
$ | 90,138 | 118,886 | |||||
| Net capital loss carryforward – state |
34,189 | 8,774 | ||||||
| Net operating loss carryforward – federal |
10,254 | 12,130 | ||||||
| Net capital loss carryforward – federal |
6,905 | 10,869 | ||||||
| Interest rate agreements |
- | 1,163 | ||||||
| Allowances and accruals |
5,667 | - | ||||||
| Other |
170 | 245 | ||||||
|
|
|
|
|
|||||
| Total deferred tax assets |
147,323 | 152,067 | ||||||
| Deferred Tax Liabilities |
||||||||
| Real estate assets |
(34,935) | (1,867) | ||||||
| Interest rate agreements |
(535) | - | ||||||
| Tax effect of unrealized gains – OCI |
- | (2,445) | ||||||
|
|
|
|
|
|||||
| Total deferred tax liabilites |
(35,470) | (4,312) | ||||||
| Valuation allowance |
(119,169) | (147,755) | ||||||
|
|
|
|
|
|||||
| Total Deferred Tax Liabilities, net of Valuation Allowance |
$ | (7,316) | $ | - | ||||
|
|
|
|
|
|||||
The deferred tax assets and liabilities reported above, with the exception of the state net operating loss and capital loss carryforwards, relate solely to our TRS. For state purposes, the REIT files a unitary combined return with its TRS. Because the REIT may have state taxable income apportioned to it from the activity of its TRS, we report the entire combined unitary state net operating loss and capital loss carryforwards as deferred tax assets, including the carryforwards allocated to the REIT.
Realization of our deferred tax assets at December 31, 2013, is dependent on many factors, including generating sufficient taxable income prior to the expiration of NOL carryforwards and generating sufficient capital gains in future periods prior to the expiration of capital loss carryforwards. We determine the extent to which realization of the deferred assets is not assured and establish a valuation allowance accordingly. Our deferred tax asset valuation allowance decreased during 2013, as compared to 2012, due to our current expectation of generating sufficient taxable income and capital gains at our taxable REIT subsidiaries in future periods to utilize our federal deferred tax assets. We remain uncertain about our ability to generate sufficient taxable income or capital gains in future periods needed to utilize our state deferred tax assets and continue to provide a full valuation allowance against these amounts. Our estimate of net deferred tax assets could change in future periods to the extent that actual or revised estimates of future taxable income during the carryforward periods change from current expectations. We assessed our tax positions for all open tax years (i.e., Federal, 2010 to 2013, and State, 2009 to 2013) and, at December 31, 2013 and 2012, concluded that we had no uncertain tax positions that resulted in material unrecognized tax benefits.
F-69
REDWOOD TRUST, INC. AND SUBSIDIARIES
NOTES TO CONSOLIDATED FINANCIAL STATEMENTS
December 31, 2013
Note 20. Taxes - (continued)
The following table summarizes the provision for income taxes for the years ended December 31, 2013, 2012, and 2011.
Provision for Income Taxes
| Year Ended December 31, | ||||||||||||
| (In Thousands) |
2013 | 2012 | 2011 | |||||||||
| Current provision for income taxes |
||||||||||||
| Federal |
$ | 3,490 | $ | 944 | $ | 19 | ||||||
| State |
142 | 347 | 23 | |||||||||
|
|
|
|
|
|
|
|||||||
| Total current provision for income taxes |
3,632 | 1,291 | 42 | |||||||||
| Deferred provision for income taxes |
||||||||||||
| Federal |
7,316 | - | - | |||||||||
|
|
|
|
|
|
|
|||||||
| Total Provision for Income Taxes |
$ | 10,948 | $ | 1,291 | $ | 42 | ||||||
|
|
|
|
|
|
|
|||||||
Our dividend distribution requirements will remain at zero until we generate taxable income in excess of our NOL carryforward at the REIT. At December 31, 2013, our federal NOL carryforward at the REIT was $70 million, which will expire in 2029. In order to utilize NOLs at the REIT, taxable income must exceed dividend distributions. At December 31, 2013, our taxable REIT subsidiaries had federal NOLs of $30 million, which will expire between 2030 and 2032. Redwood and its taxable subsidiaries accumulated an estimated state NOL of $1.3 billion at December 31, 2013. These NOLs expire beginning in 2029. If certain substantial changes in the Company’s ownership occur, there could be an annual limitation on the amount of the carryforwards that can be utilized.
The following is a reconciliation of the statutory federal and state rates to the effective rates, for the years ended December 31, 2013 and 2012.
Reconciliation of Statutory Tax Rate to Effective Tax Rate
| December 31, 2013 | December 31, 2012 | |||||||
| Federal statutory rate |
34.0 % | 34.0 % | ||||||
| State statutory rate, net of Federal tax effect |
7.2 % | 7.2 % | ||||||
| Differences in taxable loss from GAAP income |
(1.9) % | 1.0 % | ||||||
| Change in valuation allowance |
(16.4)% | (22.1)% | ||||||
| Dividends paid deduction |
(17.0) % | (19.1) % | ||||||
|
|
|
|
|
|||||
| Effective Tax Rate |
5.9 % | 1.0 % | ||||||
|
|
|
|
|
|||||
We believe that we have met all requirements for qualification as a REIT for federal income tax purposes. Many requirements for qualification as a REIT are complex and require analysis of particular facts and circumstances. Often there is only limited judicial or administrative interpretive guidance and as such there can be no assurance that the Internal Revenue Service or courts would agree with our various tax positions. If we did not meet the requirements for statutory relief, we could be subject to a 100% prohibited transaction tax for certain transactions, be required to distribute additional dividends, or be subject to federal income tax at regular corporate rates. We could also potentially lose our REIT status. Any of these outcomes could have a material adverse impact on our consolidated financial statements.
Note 21. Segment Information
Redwood operates in three segments: residential mortgage banking, residential investments, and commercial mortgage banking and investments. These business segments have been identified based on our organizational and management structure. Our segments are based on an internally-aligned segment structure, which is how our results are monitored and performance is assessed. In 2011, our activities were almost exclusively within the residential investments segment. Accordingly, segment information is presented beginning with the 2012 fiscal year. The accounting policies of the reportable segments are the same as those described in Note 3—Summary of Significant Accounting Policies.
Our residential mortgage banking segment primarily consists of operating a mortgage loan conduit that acquires residential loans from third-party originators for subsequent sale through securitization or as whole loans. Jumbo loans we acquire are typically sold
F-70
REDWOOD TRUST, INC. AND SUBSIDIARIES
NOTES TO CONSOLIDATED FINANCIAL STATEMENTS
December 31, 2013
Note 21. Segment Information - (continued)
through private-label securitization through our Sequoia securitization program or to institutions that acquire pools of whole loans. Conforming loans we acquire are generally sold to the Agencies. Our residential loan acquisitions are usually made on a flow basis, after origination by banks or mortgage companies, and are periodically augmented by bulk acquisitions. Our acquisition and accumulation of residential loans is generally funded with equity and short-term debt. This segment also includes various derivative financial instruments and IO securities retained from our Sequoia securitizations that we utilize to manage certain risks associated with residential loans we acquire. Our residential mortgage banking segment’s main source of revenue is mortgage banking income, which includes valuation increases (or gains) on the loans we acquire for sale or securitization as well as valuation changes in associated derivatives and IO securities that are used in part to manage risks associated with our mortgage banking activities. Additionally, this segment may generate interest income on loans held for future sale or securitization and interest income from IO securities. Interest expense on short-term debt used to fund the purchase of residential loans, direct operating expenses and tax expenses associated with these activities are also included in the residential mortgage banking segment.
Our residential investments segment includes a portfolio of investments in residential mortgage-backed securities retained from our Sequoia securitizations, as well as residential mortgage-backed securities issued by third parties. This segment also includes MSRs associated with residential loans securitized through our Sequoia program and MSRs purchased from third parties. The residential investment segment’s main sources of revenue are interest income from investment portfolio securities, as well as the realized gains recognized upon sales of these securities and income from MSRs. Also included in this segment is interest expense on the short-term debt and ABS used to partially finance certain of these securities, as well as direct operating expenses and tax provisions associated with these activities.
Our commercial mortgage banking and investments segment consists of our commercial mortgage banking operations as well as our portfolio of held-for-investment commercial real estate loans. We operate as a commercial real estate lender by originating mortgage loans and providing other forms of commercial real estate financing. This may include senior or subordinate mortgage loans, mezzanine loans, and other forms of financing, such as preferred equity interests in special purpose entities that own commercial real estate. We typically sell the senior loans we originate to third parties for securitization and the mezzanine and subordinate loans we originate are generally held for investment. This segment also includes derivative financial instruments we utilize to manage certain risks associated with our commercial loan origination activity. Our commercial mortgage banking and investments segment’s main sources of revenue are interest income from our commercial loan investments as well as income from mortgage banking activities, which includes valuation increases (or gains) on the senior commercial loans we originate for sale as well as valuation changes in associated derivatives that are used to manage risks associated with our mortgage banking activities. Interest expense from our Commercial Securitization and from short-term debt used to fund the purchase of commercial loans as well as operating expenses and the tax provisions associated with these activities are also included in the commercial mortgage banking segment.
Segment contribution represents the measure of profit that management uses to assess the performance of its business segments and make resource allocation and operating decisions. Certain expenses not directly assigned or allocated to one of the three primary segments, as well as activity from certain legacy Sequoia and Acacia entities consolidated for GAAP financial reporting purposes, are included in the Corporate/Other column as reconciling items to our consolidated financial statements. These unallocated expenses primarily include interest expense associated with certain long-term debt, indirect operating expenses, and other expense.
F-71
REDWOOD TRUST, INC. AND SUBSIDIARIES
NOTES TO CONSOLIDATED FINANCIAL STATEMENTS
December 31, 2013
Note 21. Segment Information - (continued)
The following table presents financial information by segment as of and for the years ended December 31, 2013 and 2012.
Business Segment Financial Information
| Year Ended December 31, 2013 | ||||||||||||||||||||
| (In Thousands) |
Residential Mortgage Banking |
Residential Investments |
Commercial Mortgage Banking and Investments |
Corporate/ Other |
Total | |||||||||||||||
| Interest income |
$ | 52,517 | $ | 96,399 | $ | 43,420 | $ | 33,820 | $ | 226,156 | ||||||||||
| Interest expense |
(10,167) | (10,067) | (12,677) | (48,060) | (80,971) | |||||||||||||||
|
|
|
|
|
|
|
|
|
|
|
|||||||||||
| Net interest income (loss) |
42,350 | 86,332 | 30,743 | (14,240) | 145,185 | |||||||||||||||
| Provision for loan losses |
- | - | (3,288) | (1,449) | (4,737) | |||||||||||||||
| Mortgage banking activities, net |
77,575 | - | 23,101 | - | 100,676 | |||||||||||||||
| MSR income, net |
- | 20,309 | - | - | 20,309 | |||||||||||||||
| Other market valuation adjustments, net |
38 | (5,134) | - | (613) | (5,709) | |||||||||||||||
| Realized gains, net |
- | 24,765 | 210 | 284 | 25,259 | |||||||||||||||
| Direct operating expenses |
(21,062) | (4,035) | (9,579) | (50,113) | (84,789) | |||||||||||||||
| Other expense |
- | - | - | (12,000) | (12,000) | |||||||||||||||
| Provision for income taxes |
(5,947) | (3,027) | (3,827) | 1,853 | (10,948) | |||||||||||||||
|
|
|
|
|
|
|
|
|
|||||||||||||
| Segment Contribution |
$ | 92,954 | $ | 119,210 | $ | 37,360 | $ | (76,278) | ||||||||||||
|
|
|
|
|
|
|
|
|
|
|
|||||||||||
| Net Income |
$ | 173,246 | ||||||||||||||||||
|
|
|
|||||||||||||||||||
| Supplemental Disclosures |
||||||||||||||||||||
| Residential loans |
$ | 404,267 | $ | - | $ | - | $ | 1,762,167 | $ | 2,166,434 | ||||||||||
| Commercial loans |
- | - | 432,455 | - | 432,455 | |||||||||||||||
| Real estate securities |
110,505 | 1,572,356 | - | - | 1,682,861 | |||||||||||||||
| Mortgage servicing rights |
- | 64,824 | - | - | 64,824 | |||||||||||||||
| Total assets |
531,092 | 1,655,209 | 439,139 | 1,983,088 | 4,608,528 | |||||||||||||||
| Non-cash amortization expense |
- | 34,578 | (798) | (7,338) | 26,442 | |||||||||||||||
F-72
REDWOOD TRUST, INC. AND SUBSIDIARIES
NOTES TO CONSOLIDATED FINANCIAL STATEMENTS
December 31, 2013
Note 21. Segment Information - (continued)
| Year Ended December 31, 2012 | ||||||||||||||||||||
| (In Thousands) |
Residential Mortgage Banking |
Residential Investments |
Commercial Mortgage Banking and Investments |
Corporate/ Other |
Total | |||||||||||||||
| Interest income |
$ | 19,714 | $ | 93,266 | $ | 26,048 | $ | 92,356 | $ | 231,384 | ||||||||||
| Interest expense |
(3,179) | (11,065) | (1,123) | (105,338) | (120,705) | |||||||||||||||
|
|
|
|
|
|
|
|
|
|
|
|||||||||||
| Net interest income (loss) |
16,535 | 82,201 | 24,925 | (12,982) | 110,679 | |||||||||||||||
| Provision for loan losses |
- | - | (3,477) | (171) | (3,648) | |||||||||||||||
| Mortgage banking activities, net |
35,170 | - | 1,149 | - | 36,319 | |||||||||||||||
| MSR income, net |
- | (1,391) | - | - | (1,391) | |||||||||||||||
| Other market valuation adjustments, net |
623 | (5,228) | - | 6,144 | 1,539 | |||||||||||||||
| Realized gains, net |
- | 32,451 | - | 22,470 | 54,921 | |||||||||||||||
| Direct operating expenses |
(12,940) | (5,711) | (11,085) | (35,623) | (65,359) | |||||||||||||||
| Provision for income taxes |
- | - | (13) | (1,278) | (1,291) | |||||||||||||||
|
|
|
|
|
|
|
|
|
|||||||||||||
| Segment Contribution |
$ | 39,388 | $ | 102,322 | $ | 11,499 | $ | (21,440) | ||||||||||||
|
|
|
|
|
|
|
|
|
|
|
|||||||||||
| Net Income |
$ | 131,769 | ||||||||||||||||||
|
|
|
|||||||||||||||||||
| Supplemental Disclosures |
||||||||||||||||||||
| Residential loans |
$ | 562,658 | $ | - | $ | - | $ | 2,272,812 | $ | 2,835,470 | ||||||||||
| Commercial loans |
- | - | 313,010 | - | 313,010 | |||||||||||||||
| Real estate securities |
10,409 | 1,098,344 | - | - | 1,108,753 | |||||||||||||||
| Mortgage servicing rights |
5,315 | - | - | - | 5,315 | |||||||||||||||
| Total assets |
583,117 | 1,112,948 | 320,670 | 2,427,363 | 4,444,098 | |||||||||||||||
| Non-cash amortization expense |
- | 30,576 | 556 | (3,472) | 24,660 | |||||||||||||||
The following table presents the components of Corporate/Other for the years ended December 31, 2013 and 2012.
| Year Ended December 31, 2013 | Year Ended December 31, 2012 | |||||||||||||||||||||||
| (In Thousands) |
Legacy Consolidated VIEs |
Other | Total | Legacy Consolidated VIEs |
Other | Total | ||||||||||||||||||
| Interest income |
$ | 33,663 | $ | 157 | $ | 33,820 | $ | 92,296 | $ | 60 | $ | 92,356 | ||||||||||||
| Interest expense |
(25,876) | (22,184) | (48,060) | (95,807) | (9,531) | (105,338) | ||||||||||||||||||
|
|
|
|
|
|
|
|
|
|
|
|
|
|||||||||||||
| Net interest income (loss) |
7,787 | (22,027) | (14,240) | (3,511) | (9,471) | (12,982) | ||||||||||||||||||
| Provision for loan losses |
(1,449) | - | (1,449) | (171) | - | (171) | ||||||||||||||||||
| Mortgage banking activities, net |
- | - | - | - | - | - | ||||||||||||||||||
| MSR income, net |
- | - | - | - | - | - | ||||||||||||||||||
| Other market valuation adjustments, net |
(613) | - | (613) | 6,144 | - | 6,144 | ||||||||||||||||||
| Realized gains, net |
284 | - | 284 | 22,470 | - | 22,470 | ||||||||||||||||||
| Direct operating expenses |
(231) | (49,882) | (50,113) | (148) | (35,475) | (35,623) | ||||||||||||||||||
| Other expense |
- | (12,000) | (12,000) | - | - | - | ||||||||||||||||||
| Provision for income taxes |
- | 1,853 | 1,853 | - | (1,278) | (1,278) | ||||||||||||||||||
|
|
|
|
|
|
|
|
|
|
|
|
|
|||||||||||||
| Total |
$ | 5,778 | $ | (82,056) | $ | (76,278) | $ | 24,784 | $ | (46,224) | $ | (21,440) | ||||||||||||
|
|
|
|
|
|
|
|
|
|
|
|
|
|||||||||||||
| Supplemental Disclosures |
||||||||||||||||||||||||
| Residential loans |
$ | 1,762,167 | $ | - | $ | 1,762,167 | $ | 2,272,812 | $ | - | $ | 2,272,812 | ||||||||||||
| Total assets |
1,770,089 | 212,999 | 1,983,088 | 2,284,567 | 142,796 | 2,427,363 | ||||||||||||||||||
| Non-cash amortization expense |
(5,769) | (1,569) | (7,338) | (3,426) | (46) | (3,472) | ||||||||||||||||||
F-73
REDWOOD TRUST, INC. AND SUBSIDIARIES
NOTES TO CONSOLIDATED FINANCIAL STATEMENTS
December 31, 2013
Note 22. Recent Developments
At December 31, 2013, we had identified for purchase $546 million of non-conforming residential mortgage loans that were in various stages of the origination process with third-party originators. Some of these loans may not ultimately close and, therefore, would not be available for purchase. Since December 31, 2013, and through February 22, 2014, $344 million of these loans closed and were purchased by us. We expect the purchase of an additional amount of these loans to occur during the first quarter of 2014, subject to loan availability and delivery.
Note 23. Quarterly Financial Data — Unaudited
| (In Thousands, Except Per Share Data) | Three Months Ended | |||||||||||||||
| December 31, | September 30, | June 30, | March 31, | |||||||||||||
| 2013 |
||||||||||||||||
| Operating results: |
||||||||||||||||
| Interest income |
$ | 57,492 | $ | 57,420 | $ | 57,719 | $ | 53,525 | ||||||||
| Interest expense |
(19,528) | (21,725) | (21,416) | (18,302) | ||||||||||||
| Net interest income |
37,964 | 35,695 | 36,303 | 35,223 | ||||||||||||
| Net income |
25,134 | 21,929 | 65,573 | 60,160 | ||||||||||||
| Per share data: |
||||||||||||||||
| Net income – basic |
$ | 0.30 | $ | 0.26 | $ | 0.78 | $ | 0.72 | ||||||||
| Net income – diluted |
0.29 | 0.25 | 0.71 | 0.69 | ||||||||||||
| Regular dividends declared per common share |
0.28 | 0.28 | 0.28 | 0.28 | ||||||||||||
| 2012 |
||||||||||||||||
| Operating results: |
||||||||||||||||
| Interest income |
$ | 53,397 | $ | 59,723 | $ | 59,523 | $ | 58,740 | ||||||||
| Interest expense |
(32,971) | (28,285) | (28,881) | (30,655) | ||||||||||||
| Net interest income |
20,426 | 31,438 | 30,642 | 28,085 | ||||||||||||
| Net income |
42,078 | 39,701 | 19,527 | 30,463 | ||||||||||||
| Per share data: |
||||||||||||||||
| Net income – basic |
$ | 0.50 | $ | 0.48 | $ | 0.24 | $ | 0.38 | ||||||||
| Net income – diluted |
0.50 | 0.48 | 0.24 | 0.37 | ||||||||||||
| Regular dividends declared per common share |
0.25 | 0.25 | 0.25 | 0.25 | ||||||||||||
F-74