R E D W O O D T R U S T . C O M Q1 2024 Redwood Review April 30, 2024 Exhibit 99.3

2 This presentation contains forward-looking statements, including statements regarding our 2024 forward outlook, current illustrative returns related to capital deployment opportunities, estimates of upside and potential earnings in our investment portfolio from embedded discounts to par value on securities, statements regarding our joint ventures with Oaktree and CPP Investments, including the estimated levered purchase capacity of our joint venture with CPP Investments of up to $4 billion of CoreVest originated bridge and term loans and estimates of incremental annual EAD of $0.15 per share to be generated from JV management fees, our estimate of the contribution of cost-savings measures taken during Q1’24 of $0.02 of incremental annual EAD, and our estimate of implied residential consumer loan acquisition volume opportunity based on market share. Forward-looking statements involve numerous risks and uncertainties. Our actual results may differ from our beliefs, expectations, estimates, and projections and, consequently, you should not rely on these forward- looking statements as predictions of future events. Forward-looking statements are not historical in nature and can be identified by words such as “anticipate,” “estimate,” “will,” “should,” “expect,” “believe,” “intend,” “seek,” “plan” and similar expressions or their negative forms, or by references to strategy, plans, opportunities, or intentions. These forward-looking statements are subject to risks and uncertainties, including, among other things, those described in the Company’s Annual Report on Form 10-K for the year ended December 31, 2023 and any subsequent Quarterly Reports on Form 10-Q under the caption “Risk Factors.” Other risks, uncertainties, and factors that could cause actual results to differ materially from those projected may be described from time to time in reports the Company files with the Securities and Exchange Commission, including Current Reports on Form 8-K. Additionally, this presentation contains estimates and information concerning our industry, including market size and growth rates of the markets in which we participate, that are based on industry publications and reports. This information involves many assumptions and limitations, and you are cautioned not to give undue weight to these estimates. We have not independently verified the accuracy or completeness of the data contained in these industry publications and reports. The industry in which we operate is subject to a high degree of uncertainty and risk due to a variety of factors, including those referred to above, that could cause results to differ materially from those expressed in these publications and reports. Cautionary Statement; Forward-Looking Statements
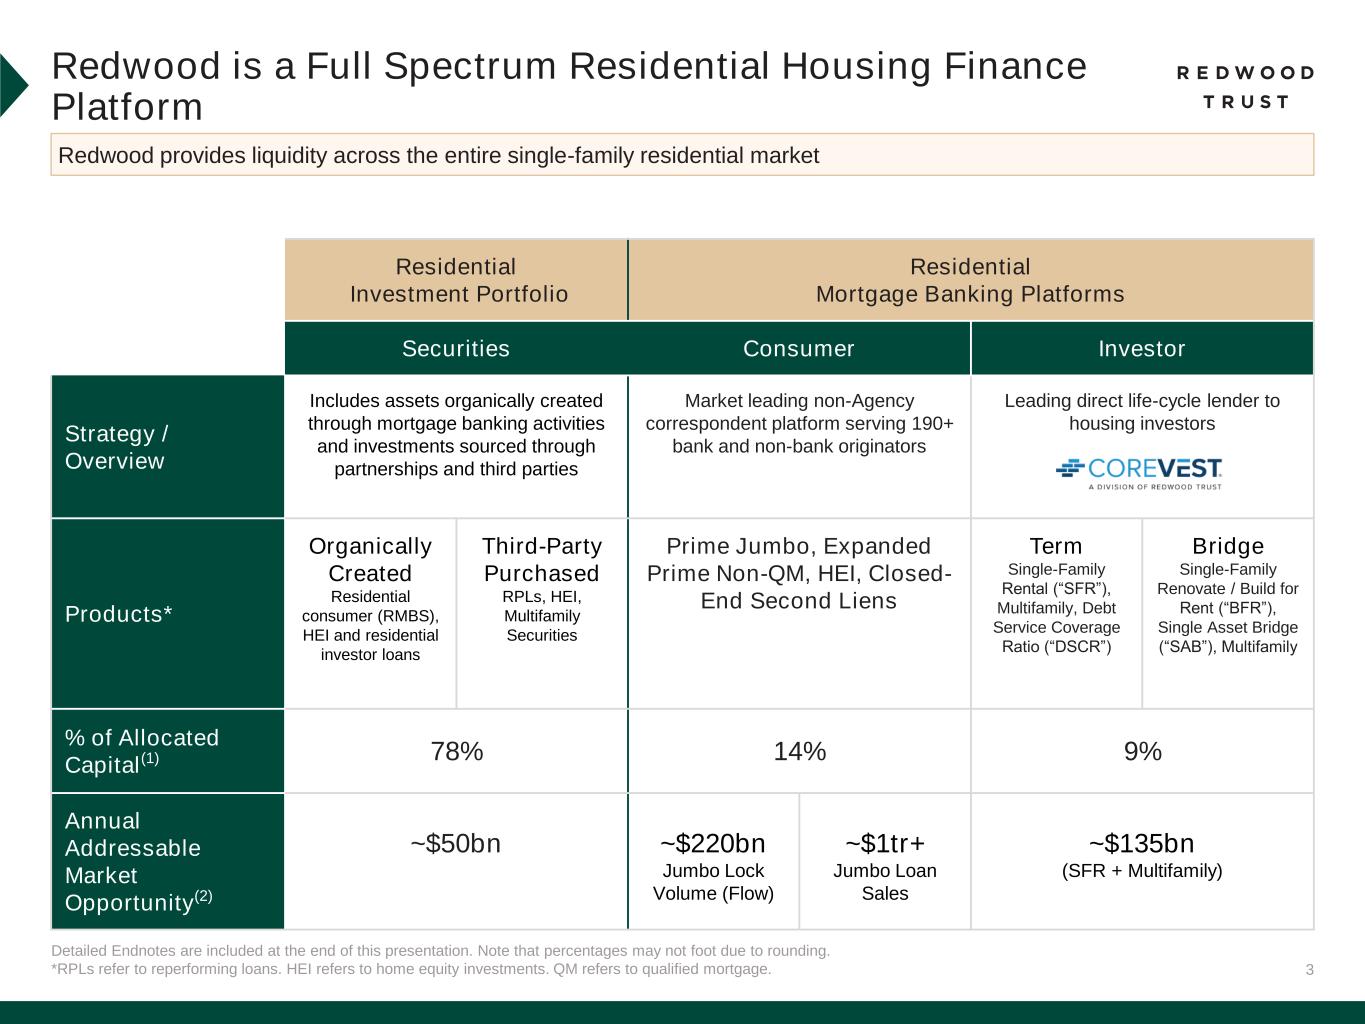
3 Detailed Endnotes are included at the end of this presentation. Note that percentages may not foot due to rounding. *RPLs refer to reperforming loans. HEI refers to home equity investments. QM refers to qualified mortgage. Redwood is a Full Spectrum Residential Housing Finance Platform Redwood provides liquidity across the entire single-family residential market Residential Investment Portfolio Residential Mortgage Banking Platforms Securities Consumer Investor Strategy / Overview Includes assets organically created through mortgage banking activities and investments sourced through partnerships and third parties Market leading non-Agency correspondent platform serving 190+ bank and non-bank originators Leading direct life-cycle lender to housing investors Products* Organically Created Residential consumer (RMBS), HEI and residential investor loans Third-Party Purchased RPLs, HEI, Multifamily Securities Prime Jumbo, Expanded Prime Non-QM, HEI, Closed- End Second Liens Term Single-Family Rental (“SFR”), Multifamily, Debt Service Coverage Ratio (“DSCR”) Bridge Single-Family Renovate / Build for Rent (“BFR”), Single Asset Bridge (“SAB”), Multifamily % of Allocated Capital(1) 78% 14% 9% Annual Addressable Market Opportunity(2) ~$50bn ~$220bn Jumbo Lock Volume (Flow) ~$1tr+ Jumbo Loan Sales ~$135bn (SFR + Multifamily)
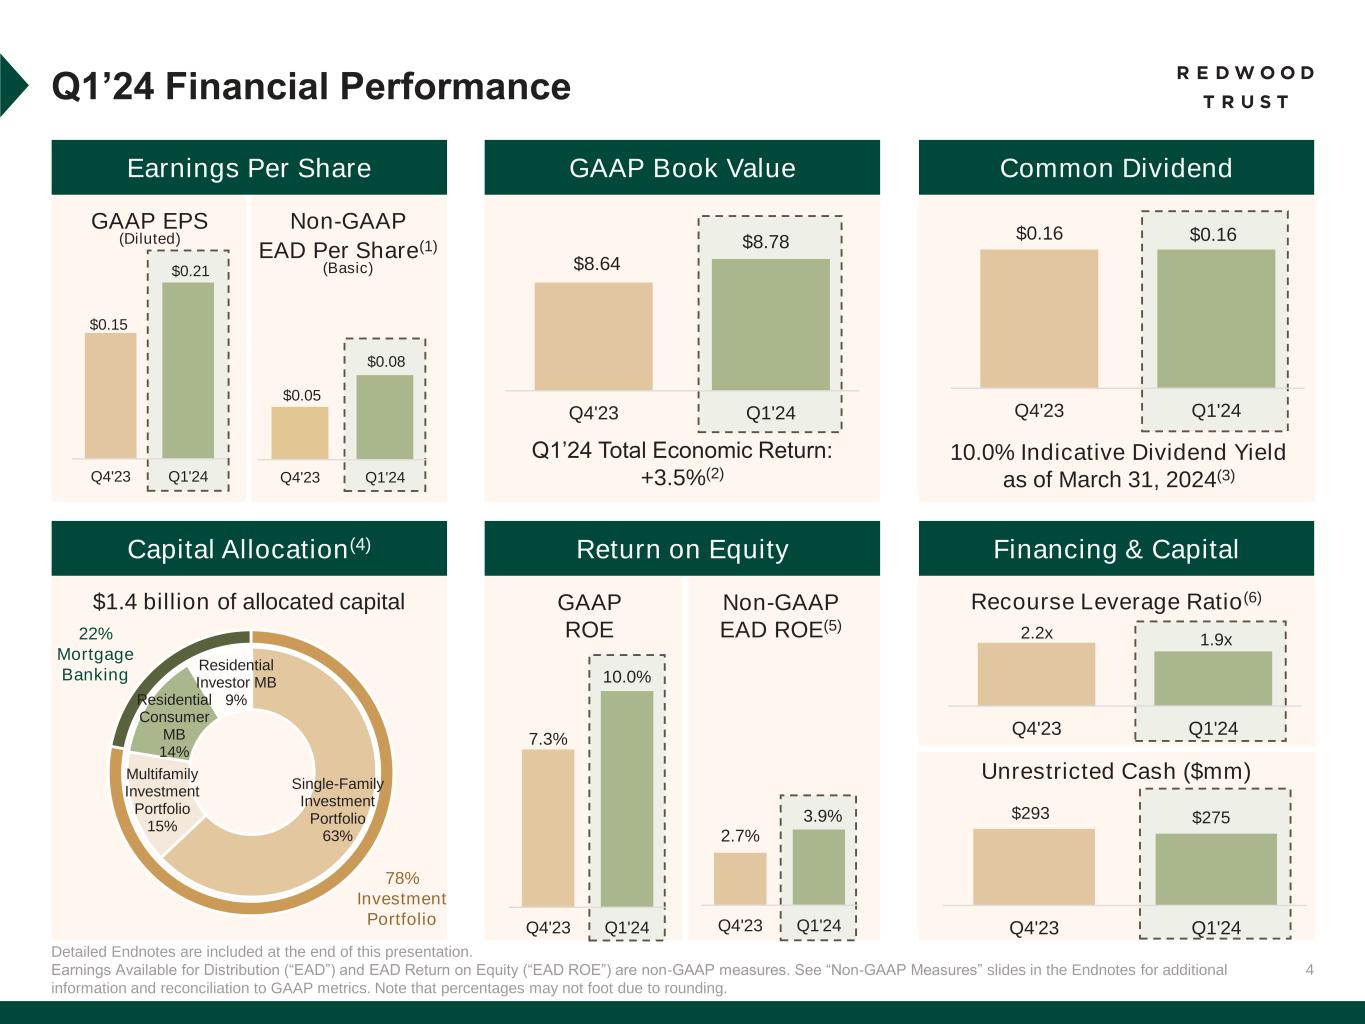
4 Detailed Endnotes are included at the end of this presentation. Earnings Available for Distribution (“EAD”) and EAD Return on Equity (“EAD ROE”) are non-GAAP measures. See “Non-GAAP Measures” slides in the Endnotes for additional information and reconciliation to GAAP metrics. Note that percentages may not foot due to rounding. Q1’24 Financial Performance Recourse Leverage Ratio(6) Q1’24 Total Economic Return: +3.5%(2) 10.0% Indicative Dividend Yield as of March 31, 2024(3) GAAP ROE Non-GAAP EAD ROE(5) GAAP EPS (Diluted) Non-GAAP EAD Per Share(1) (Basic) Earnings Per Share GAAP Book Value Common Dividend Capital Allocation(4) Return on Equity Financing & Capital 22% Mortgage Banking $8.64 $8.78 Q4'23 Q1'24 $0.16 $0.16 Q4'23 Q1'24 $0.15 $0.21 Q4'23 Q1'24 2.2x 1.9x Q4'23 Q1'24 $0.05 $0.08 Q4'23 Q1'24 $293 $275 Q4'23 Q1'24 7.3% 10.0% Q4'23 Q1'24 2.7% 3.9% Q4'23 Q1'24 Unrestricted Cash ($mm) $1.4 billion of allocated capital 78% Investment Portfolio Single-Family Investment Portfolio 63% Multifamily Investment Portfolio 15% Residential Consumer MB 14% Residential Investor MB 9%
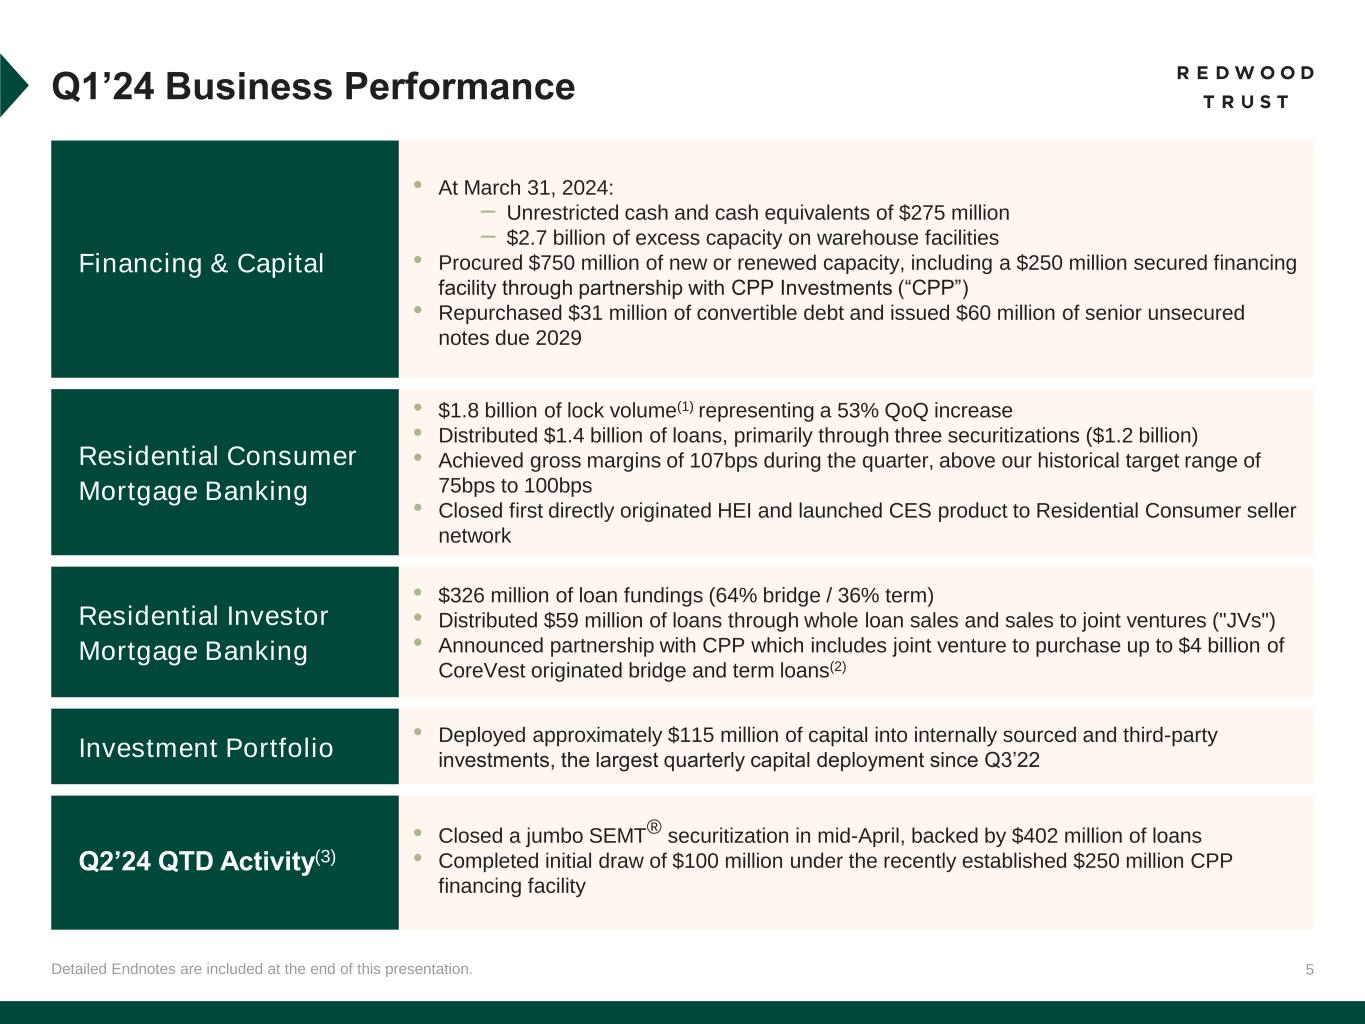
5Detailed Endnotes are included at the end of this presentation. Q1’24 Business Performance Financing & Capital • At March 31, 2024: – Unrestricted cash and cash equivalents of $275 million – $2.7 billion of excess capacity on warehouse facilities • Procured $750 million of new or renewed capacity, including a $250 million secured financing facility through partnership with CPP Investments (“CPP”) • Repurchased $31 million of convertible debt and issued $60 million of senior unsecured notes due 2029 Residential Consumer Mortgage Banking • $1.8 billion of lock volume(1) representing a 53% QoQ increase • Distributed $1.4 billion of loans, primarily through three securitizations ($1.2 billion) • Achieved gross margins of 107bps during the quarter, above our historical target range of 75bps to 100bps • Closed first directly originated HEI and launched CES product to Residential Consumer seller network Residential Investor Mortgage Banking • $326 million of loan fundings (64% bridge / 36% term) • Distributed $59 million of loans through whole loan sales and sales to joint ventures ("JVs") • Announced partnership with CPP which includes joint venture to purchase up to $4 billion of CoreVest originated bridge and term loans(2) Investment Portfolio • Deployed approximately $115 million of capital into internally sourced and third-party investments, the largest quarterly capital deployment since Q3’22 Q2’24 QTD Activity(3) • Closed a jumbo SEMT® securitization in mid-April, backed by $402 million of loans • Completed initial draw of $100 million under the recently established $250 million CPP financing facility
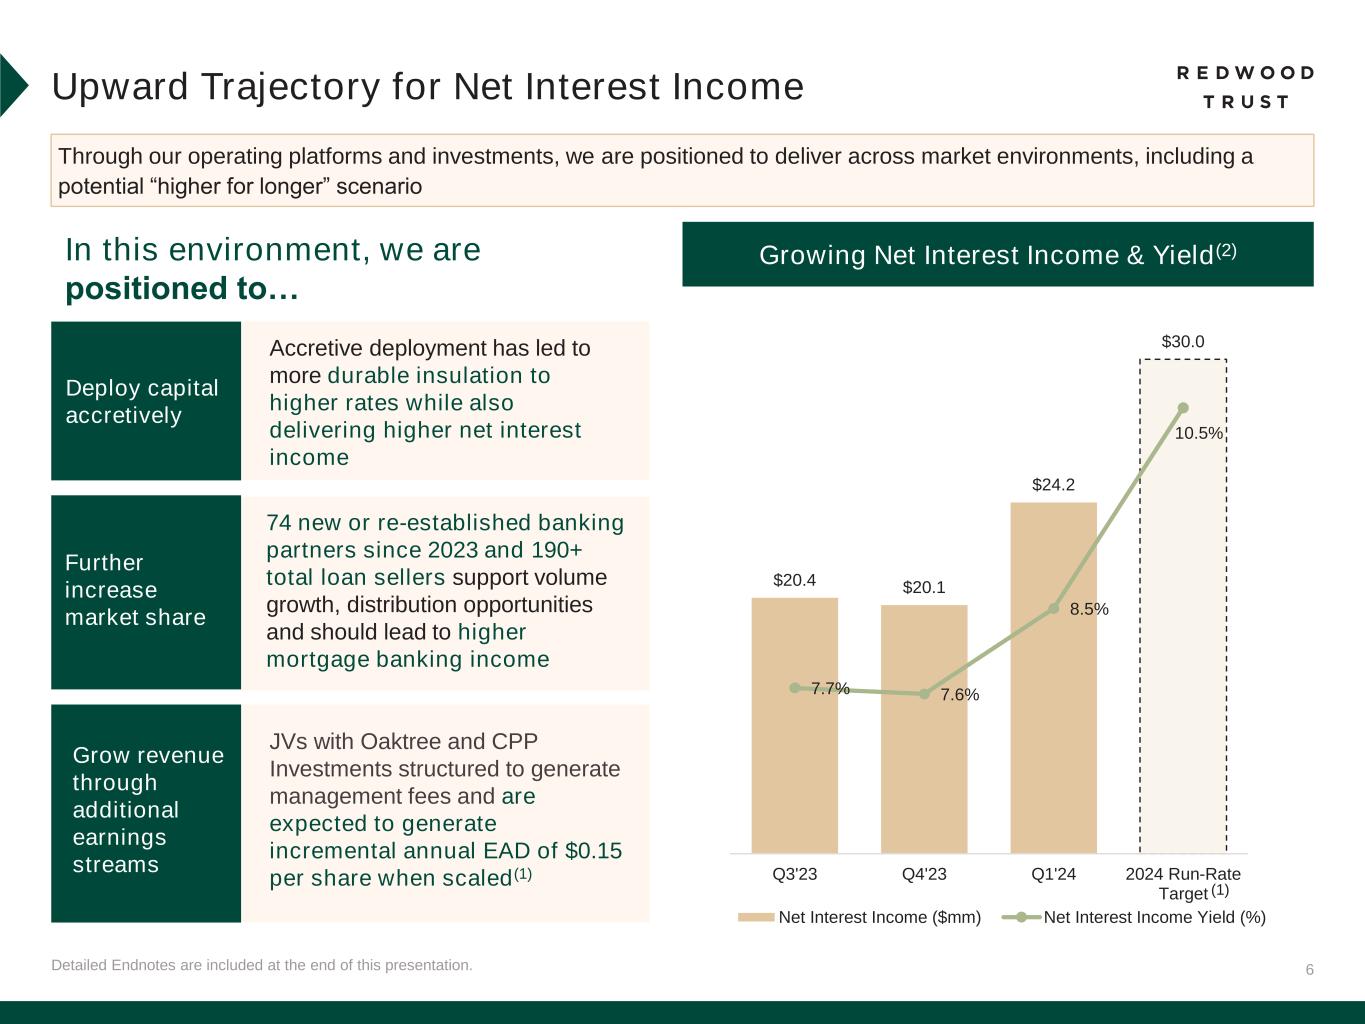
6Detailed Endnotes are included at the end of this presentation. Upward Trajectory for Net Interest Income Through our operating platforms and investments, we are positioned to deliver across market environments, including a potential “higher for longer” scenario In this environment, we are positioned to… (1) Grow revenue through additional earnings streams Deploy capital accretively Growing Net Interest Income & Yield(2) Further increase market share $20.4 $20.1 $24.2 $30.0 7.7% 7.6% 8.5% 10.5% 6.0% 7.0% 8.0% 9.0% 10.0% 11.0% $10 $15 $20 $25 $30 Q3'23 Q4'23 Q1'24 2024 Run-Rate Target Net Interest Income ($mm) Net Interest Income Yield (%) JVs with Oaktree and CPP Investments structured to generate management fees and are expected to generate incremental annual EAD of $0.15 per share when scaled(1) 74 new or re-established banking partners since 2023 and 190+ total loan sellers support volume growth, distribution opportunities and should lead to higher mortgage banking income Accretive deployment has led to more durable insulation to higher rates while also delivering higher net interest income
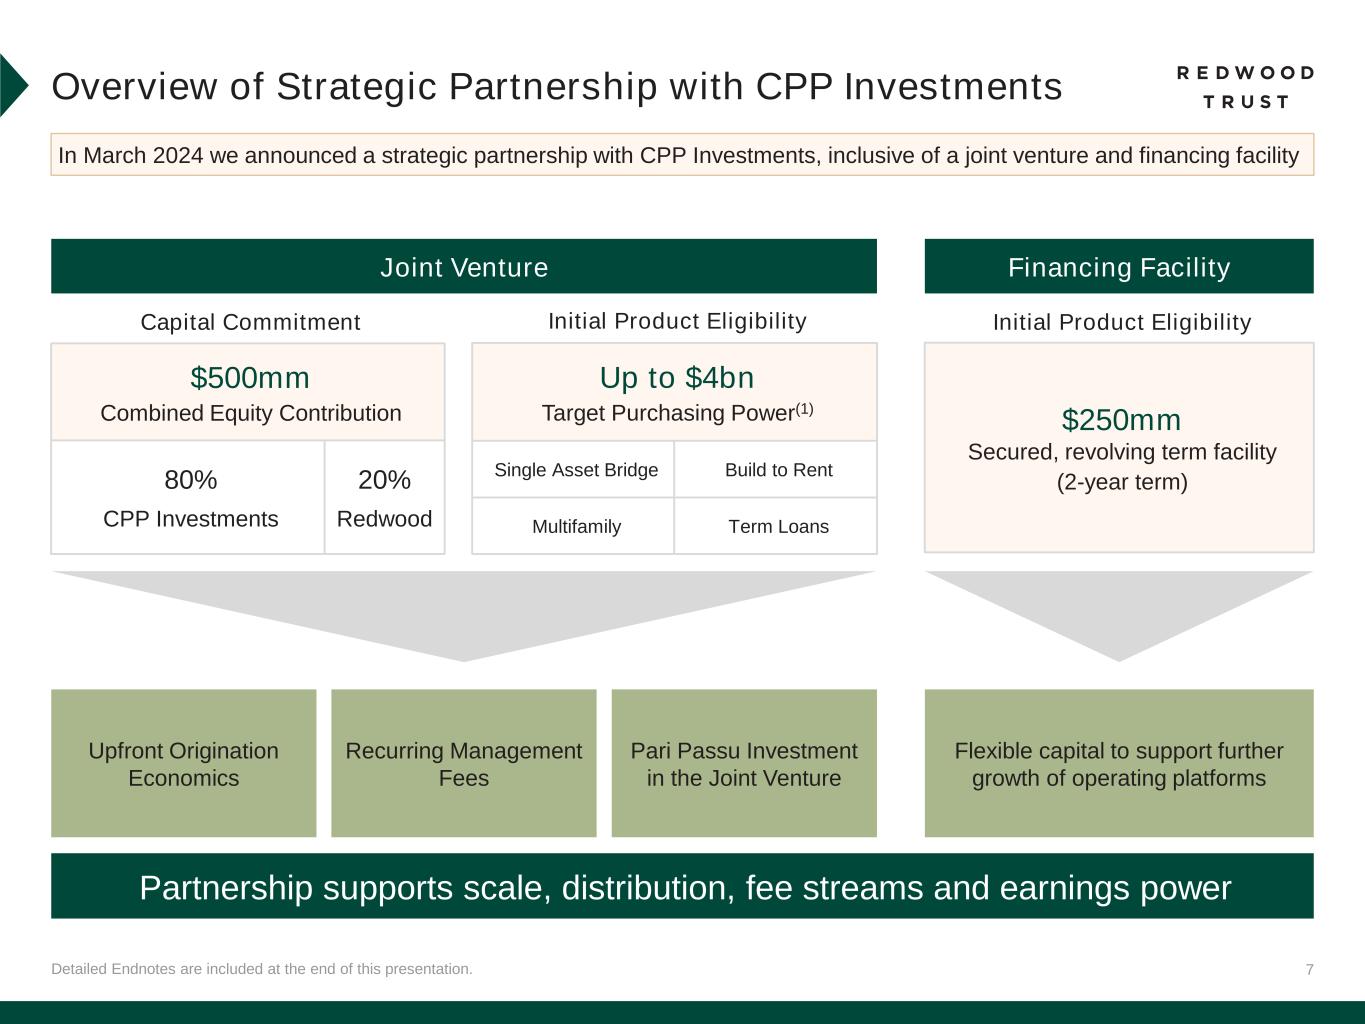
7 Capital Commitment Detailed Endnotes are included at the end of this presentation. Overview of Strategic Partnership with CPP Investments Joint Venture Financing Facility Initial Product Eligibility In March 2024 we announced a strategic partnership with CPP Investments, inclusive of a joint venture and financing facility $500mm Combined Equity Contribution Up to $4bn Target Purchasing Power(1) Upfront Origination Economics Recurring Management Fees Pari Passu Investment in the Joint Venture Partnership supports scale, distribution, fee streams and earnings power $250mm Secured, revolving term facility (2-year term) Flexible capital to support further growth of operating platforms 80% CPP Investments 20% Redwood Single Asset Bridge Build to Rent Multifamily Term Loans Initial Product Eligibility
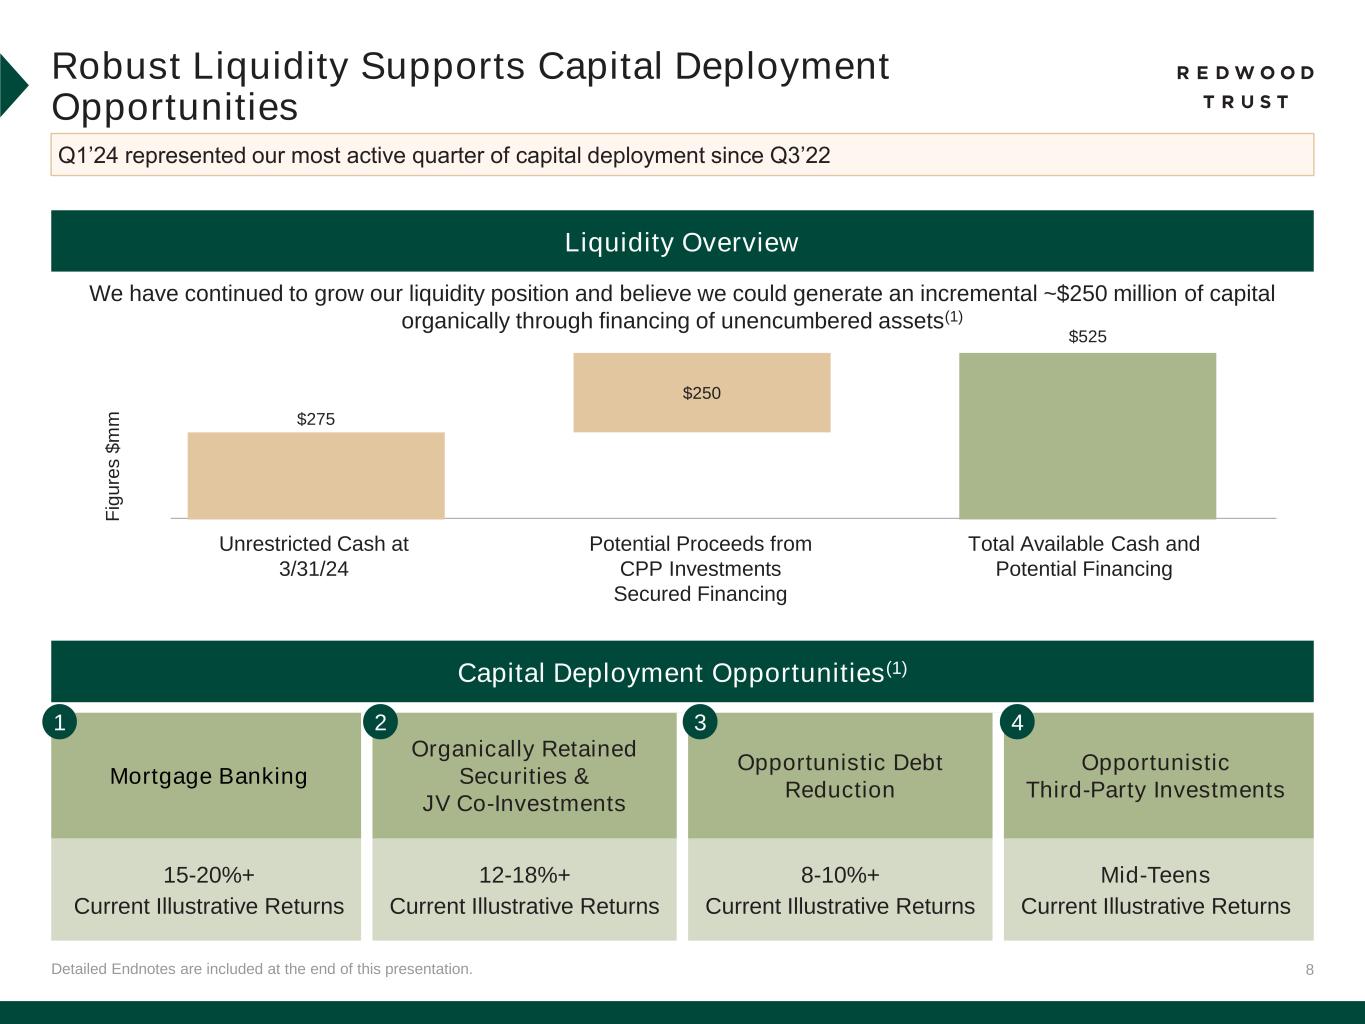
8Detailed Endnotes are included at the end of this presentation. Robust Liquidity Supports Capital Deployment Opportunities Liquidity Overview Capital Deployment Opportunities(1) Q1’24 represented our most active quarter of capital deployment since Q3’22 We have continued to grow our liquidity position and believe we could generate an incremental ~$250 million of capital organically through financing of unencumbered assets(1) Mortgage Banking Organically Retained Securities & JV Co-Investments Opportunistic Debt Reduction Opportunistic Third-Party Investments 15-20%+ Current Illustrative Returns 12-18%+ Current Illustrative Returns 8-10%+ Current Illustrative Returns Mid-Teens Current Illustrative Returns 1 2 3 4 Unrestricted Cash at 3/31/24 Potential Proceeds from CPP Investments Secured Financing Total Available Cash and Potential Financing F ig u re s $ m m $525 $275 $250
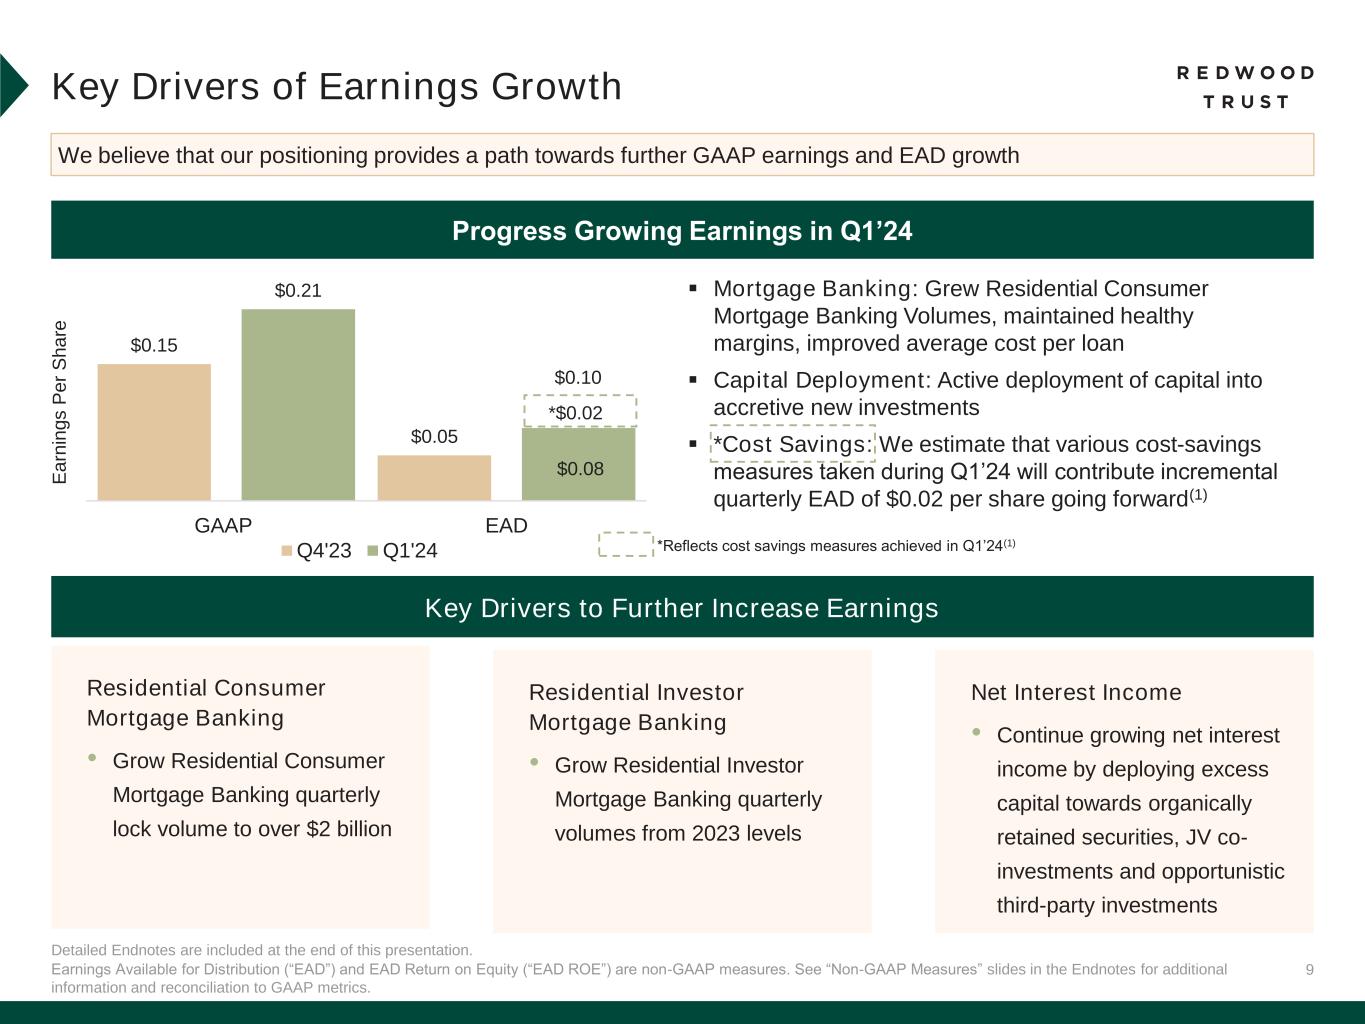
9 $0.15 $0.05 $0.21 $0.08 GAAP EAD Q4'23 Q1'24 Detailed Endnotes are included at the end of this presentation. Key Drivers of Earnings Growth We believe that our positioning provides a path towards further GAAP earnings and EAD growth Progress Growing Earnings in Q1’24 Key Drivers to Further Increase Earnings Residential Consumer Mortgage Banking • Grow Residential Consumer Mortgage Banking quarterly lock volume to over $2 billion ▪ Mortgage Banking: Grew Residential Consumer Mortgage Banking Volumes, maintained healthy margins, improved average cost per loan ▪ Capital Deployment: Active deployment of capital into accretive new investments ▪ *Cost Savings: We estimate that various cost-savings measures taken during Q1’24 will contribute incremental quarterly EAD of $0.02 per share going forward(1) Residential Investor Mortgage Banking • Grow Residential Investor Mortgage Banking quarterly volumes from 2023 levels Net Interest Income • Continue growing net interest income by deploying excess capital towards organically retained securities, JV co- investments and opportunistic third-party investments Earnings Available for Distribution (“EAD”) and EAD Return on Equity (“EAD ROE”) are non-GAAP measures. See “Non-GAAP Measures” slides in the Endnotes for additional information and reconciliation to GAAP metrics. *$0.02 $0.10 *Reflects cost savings measures achieved in Q1’24(1) E a rn in g s P e r S h a re

10 Operating Businesses & Investment Portfolio
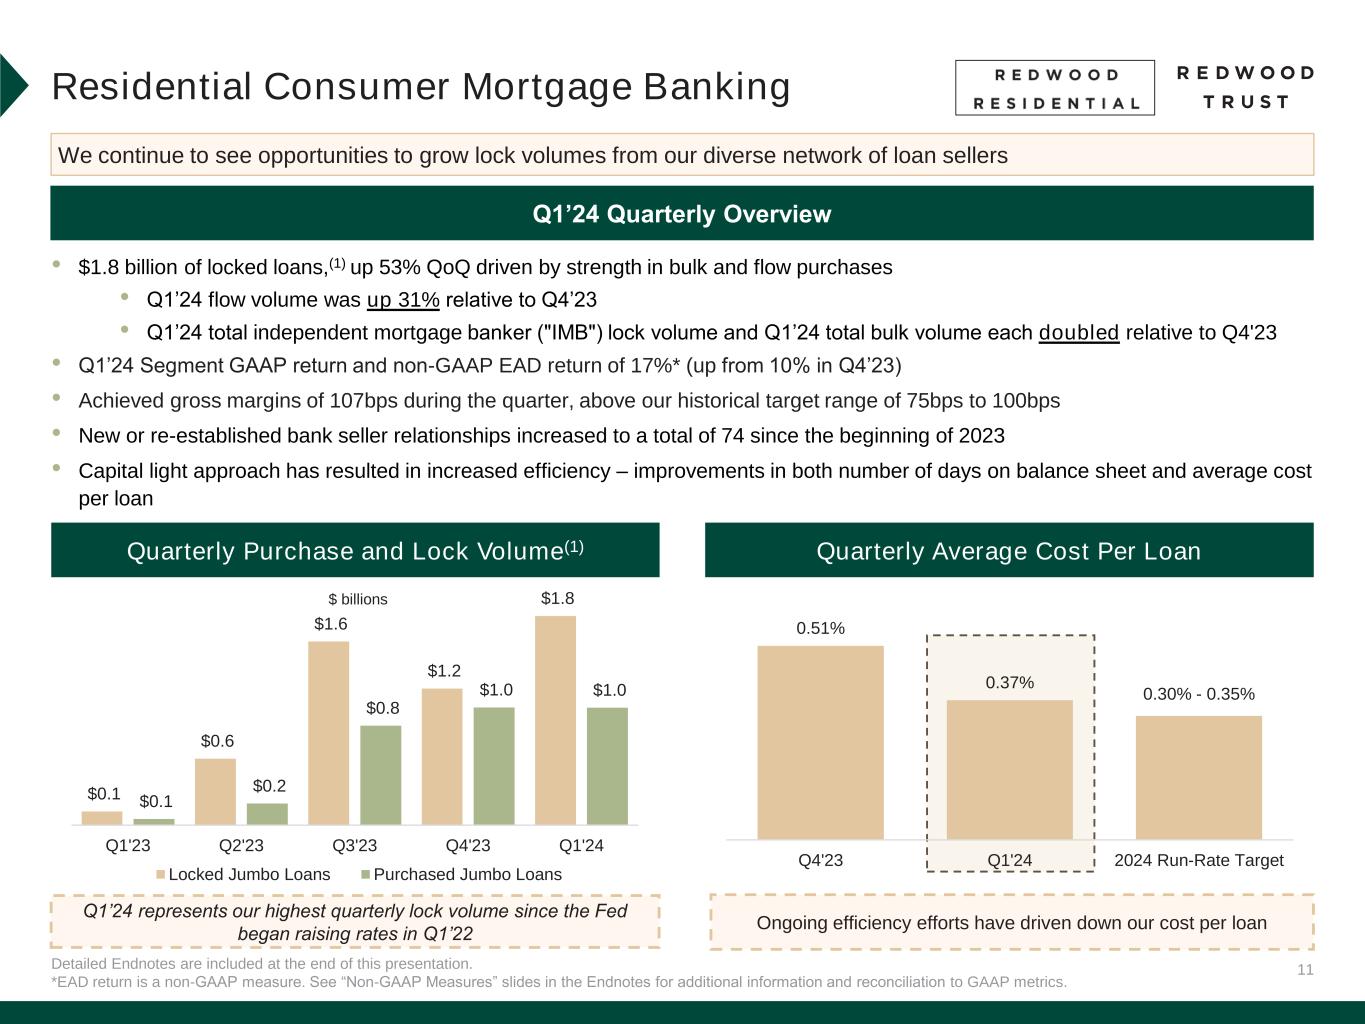
11Detailed Endnotes are included at the end of this presentation. *EAD return is a non-GAAP measure. See “Non-GAAP Measures” slides in the Endnotes for additional information and reconciliation to GAAP metrics. Residential Consumer Mortgage Banking • $1.8 billion of locked loans,(1) up 53% QoQ driven by strength in bulk and flow purchases • Q1’24 flow volume was up 31% relative to Q4’23 • Q1’24 total independent mortgage banker ("IMB") lock volume and Q1’24 total bulk volume each doubled relative to Q4'23 • Q1’24 Segment GAAP return and non-GAAP EAD return of 17%* (up from 10% in Q4’23) • Achieved gross margins of 107bps during the quarter, above our historical target range of 75bps to 100bps • New or re-established bank seller relationships increased to a total of 74 since the beginning of 2023 • Capital light approach has resulted in increased efficiency – improvements in both number of days on balance sheet and average cost per loan Q1’24 Quarterly Overview Quarterly Average Cost Per LoanQuarterly Purchase and Lock Volume(1) We continue to see opportunities to grow lock volumes from our diverse network of loan sellers $ billions $0.1 $0.6 $1.6 $1.2 $1.8 $0.1 $0.2 $0.8 $1.0 $1.0 Q1'23 Q2'23 Q3'23 Q4'23 Q1'24 Locked Jumbo Loans Purchased Jumbo Loans Q1’24 represents our highest quarterly lock volume since the Fed began raising rates in Q1’22 Ongoing efficiency efforts have driven down our cost per loan 0.51% 0.37% 0.30% - 0.35% Q4'23 Q1'24 2024 Run-Rate Target
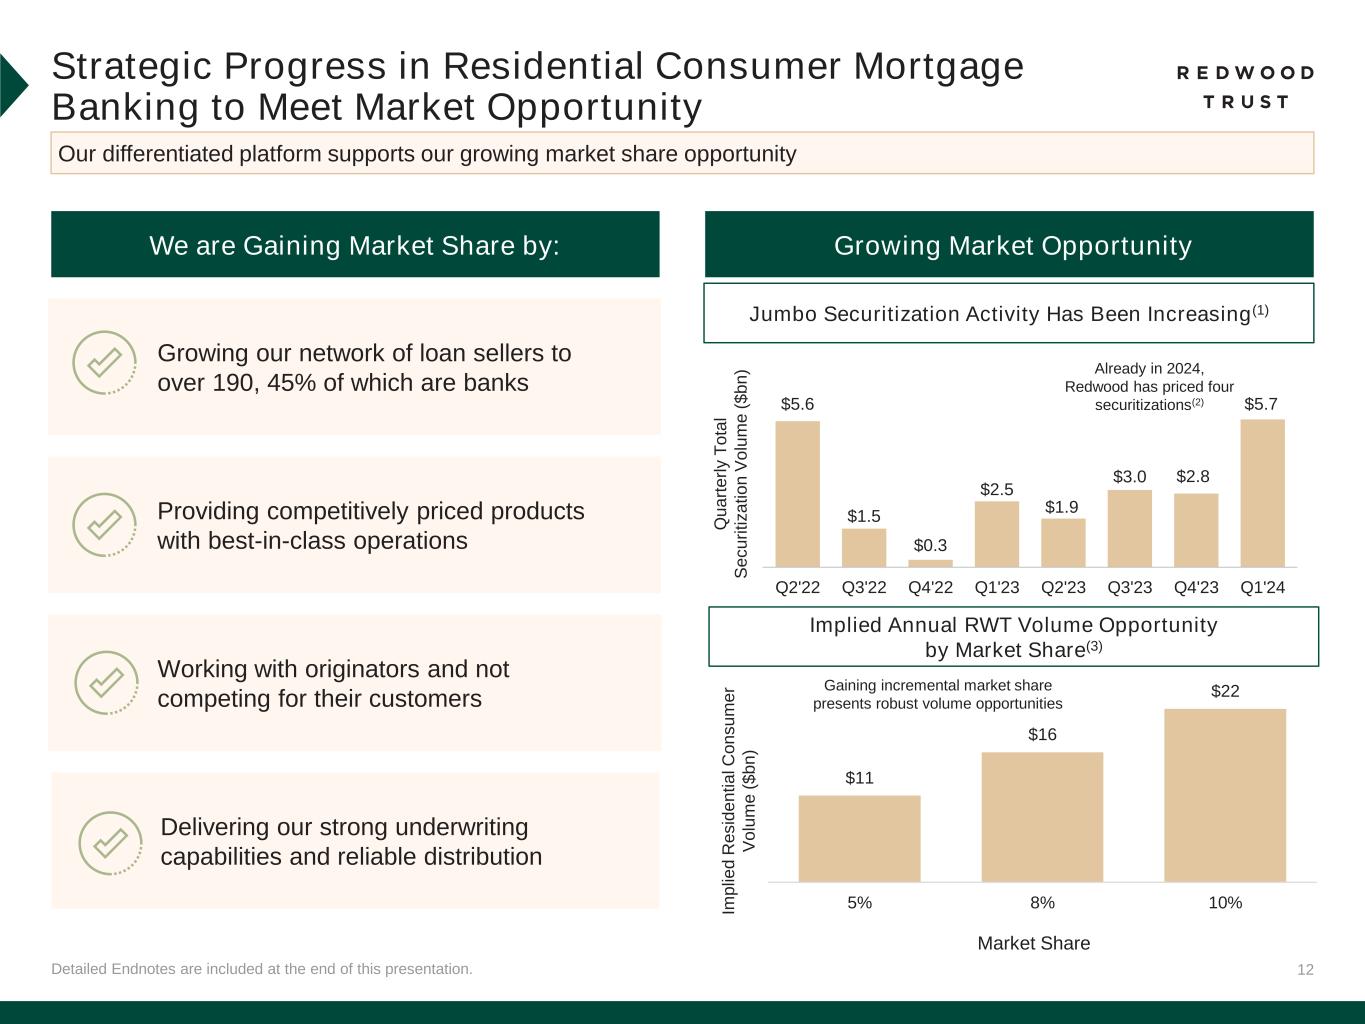
12Detailed Endnotes are included at the end of this presentation. Strategic Progress in Residential Consumer Mortgage Banking to Meet Market Opportunity We are Gaining Market Share by: Jumbo Securitization Activity Has Been Increasing(1) Our differentiated platform supports our growing market share opportunity Growing our network of loan sellers to over 190, 45% of which are banks Providing competitively priced products with best-in-class operations Working with originators and not competing for their customers Delivering our strong underwriting capabilities and reliable distribution Growing Market Opportunity Im p lie d R e s id e n ti a l C o n s u m e r V o lu m e ( $ b n ) Implied Annual RWT Volume Opportunity by Market Share(3) Already in 2024, Redwood has priced four securitizations(2) $11 $16 $22 5% 8% 10% Market Share Gaining incremental market share presents robust volume opportunities $5.6 $1.5 $0.3 $2.5 $1.9 $3.0 $2.8 $5.7 Q2'22 Q3'22 Q4'22 Q1'23 Q2'23 Q3'23 Q4'23 Q1'24 Q u a rt e rl y T o ta l S e c u ri ti z a ti o n V o lu m e ( $ b n )
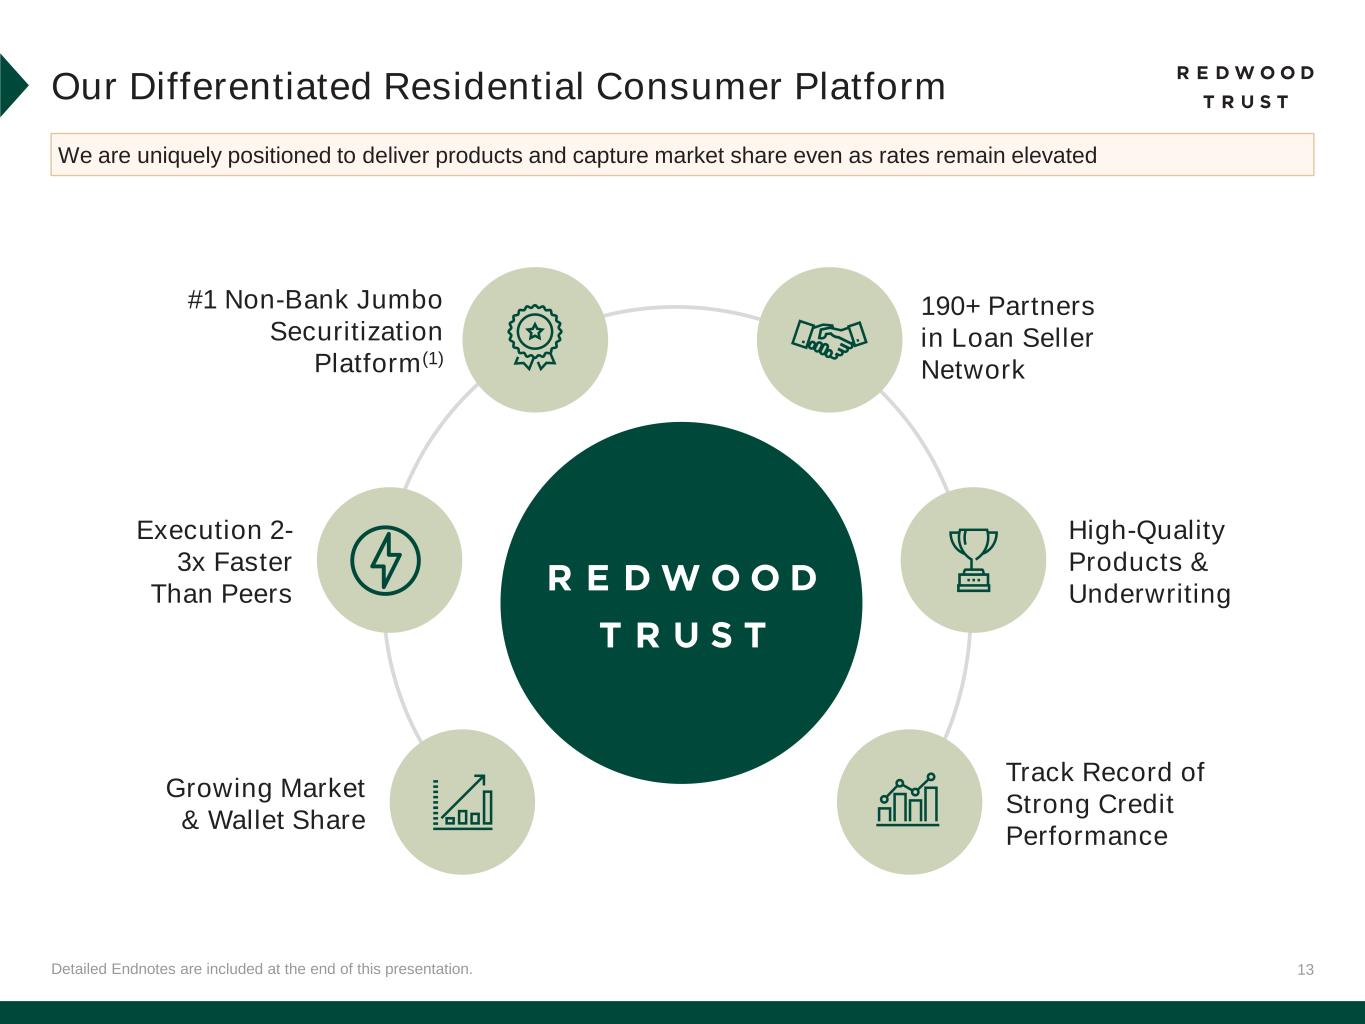
13 Our Differentiated Residential Consumer Platform We are uniquely positioned to deliver products and capture market share even as rates remain elevated 190+ Partners in Loan Seller Network #1 Non-Bank Jumbo Securitization Platform(1) Execution 2- 3x Faster Than Peers Growing Market & Wallet Share High-Quality Products & Underwriting Track Record of Strong Credit Performance Detailed Endnotes are included at the end of this presentation.
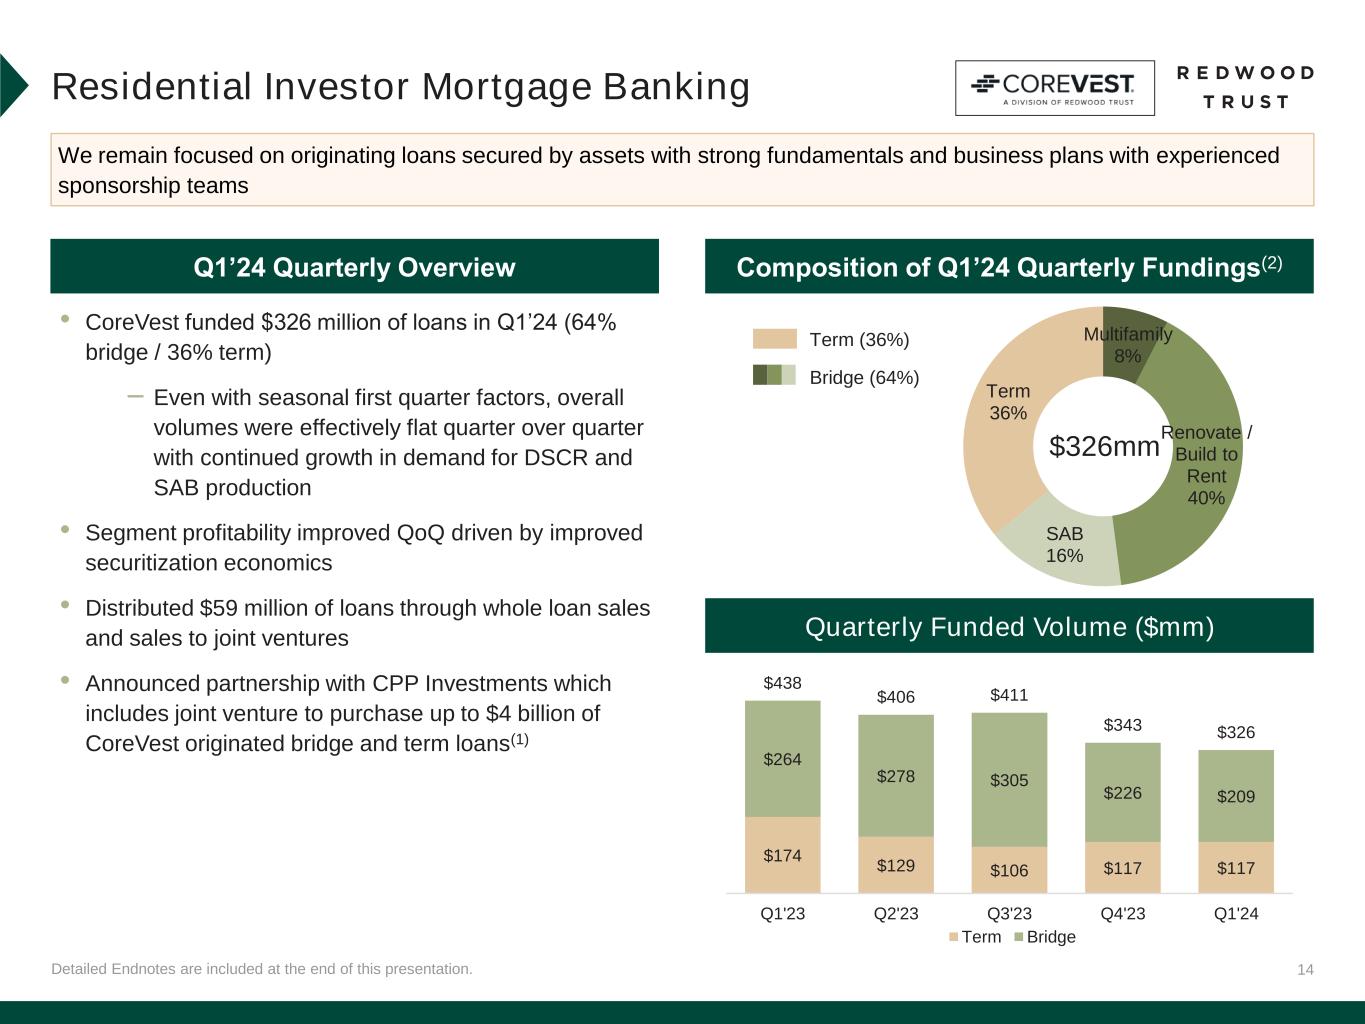
14Detailed Endnotes are included at the end of this presentation. • CoreVest funded $326 million of loans in Q1’24 (64% bridge / 36% term) – Even with seasonal first quarter factors, overall volumes were effectively flat quarter over quarter with continued growth in demand for DSCR and SAB production • Segment profitability improved QoQ driven by improved securitization economics • Distributed $59 million of loans through whole loan sales and sales to joint ventures • Announced partnership with CPP Investments which includes joint venture to purchase up to $4 billion of CoreVest originated bridge and term loans(1) Residential Investor Mortgage Banking Composition of Q1’24 Quarterly Fundings(2)Q1’24 Quarterly Overview Quarterly Funded Volume ($mm) We remain focused on originating loans secured by assets with strong fundamentals and business plans with experienced sponsorship teams Term (36%) Bridge (64%) $174 $129 $106 $117 $117 $264 $278 $305 $226 $209 $438 $406 $411 $343 $326 Q1'23 Q2'23 Q3'23 Q4'23 Q1'24 Term Bridge Multifamily 8% Renovate / Build to Rent 40% SAB 16% Term 36% $326mm
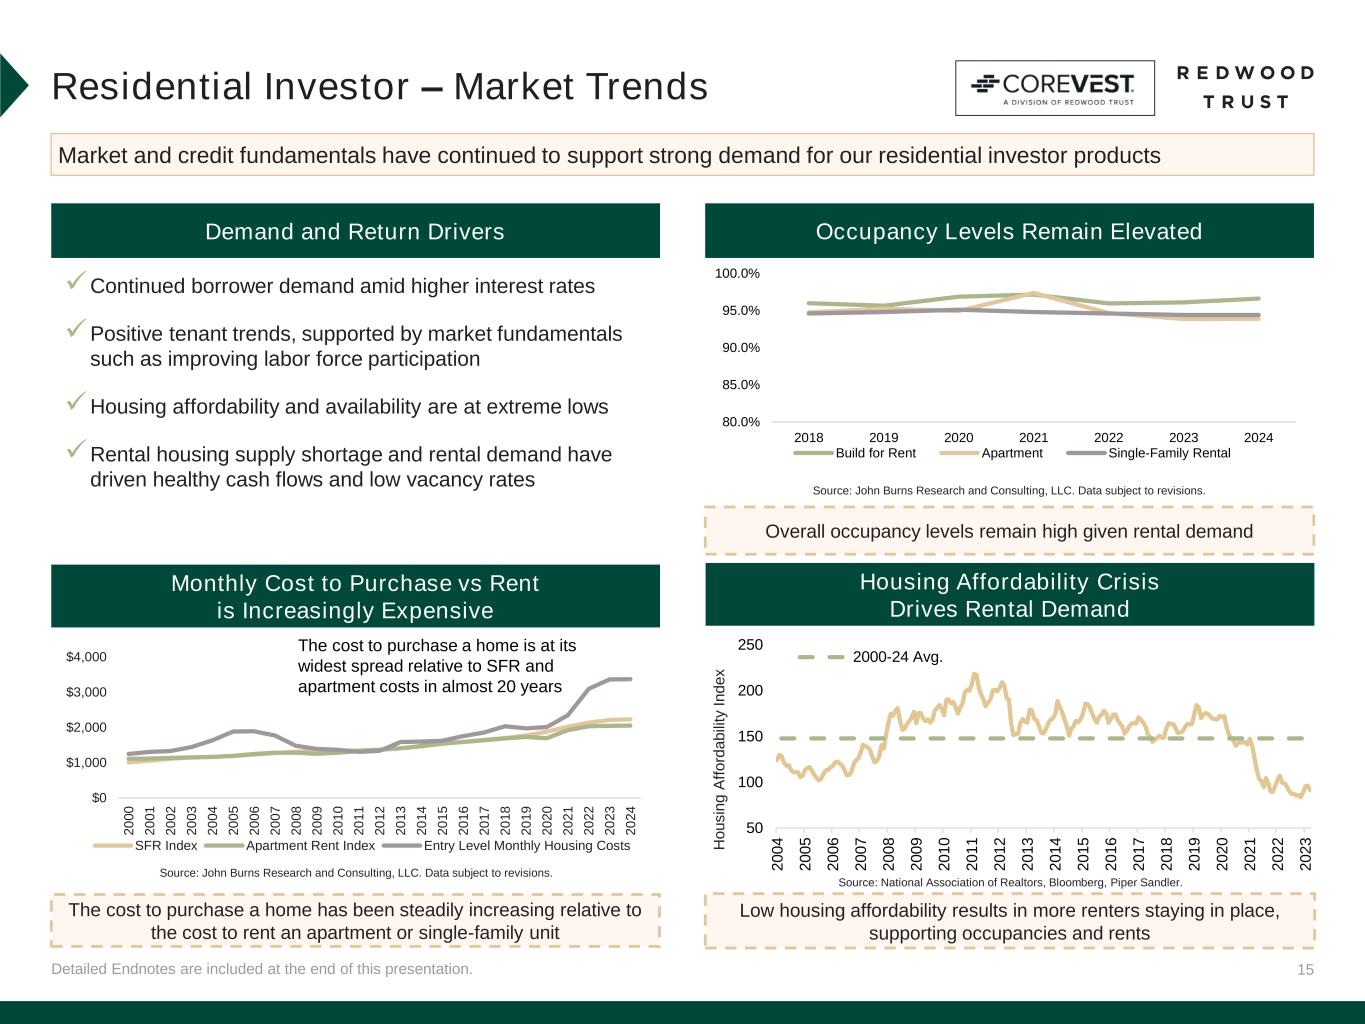
15Detailed Endnotes are included at the end of this presentation. Residential Investor – Market Trends Market and credit fundamentals have continued to support strong demand for our residential investor products Demand and Return Drivers Housing Affordability Crisis Drives Rental Demand Occupancy Levels Remain Elevated Monthly Cost to Purchase vs Rent is Increasingly Expensive Overall occupancy levels remain high given rental demand Low housing affordability results in more renters staying in place, supporting occupancies and rents The cost to purchase a home has been steadily increasing relative to the cost to rent an apartment or single-family unit H o u s in g A ff o rd a b ili ty I n d e x The cost to purchase a home is at its widest spread relative to SFR and apartment costs in almost 20 years Source: John Burns Research and Consulting, LLC. Data subject to revisions. Source: John Burns Research and Consulting, LLC. Data subject to revisions. Source: National Association of Realtors, Bloomberg, Piper Sandler. ✓Continued borrower demand amid higher interest rates ✓Positive tenant trends, supported by market fundamentals such as improving labor force participation ✓Housing affordability and availability are at extreme lows ✓Rental housing supply shortage and rental demand have driven healthy cash flows and low vacancy rates 50 100 150 200 250 2 0 0 4 2 0 0 5 2 0 0 6 2 0 0 7 2 0 0 8 2 0 0 9 2 0 1 0 2 0 1 1 2 0 1 2 2 0 1 3 2 0 1 4 2 0 1 5 2 0 1 6 2 0 1 7 2 0 1 8 2 0 1 9 2 0 2 0 2 0 2 1 2 0 2 2 2 0 2 3 2000-24 Avg. $0 $1,000 $2,000 $3,000 $4,000 2 0 0 0 2 0 0 1 2 0 0 2 2 0 0 3 2 0 0 4 2 0 0 5 2 0 0 6 2 0 0 7 2 0 0 8 2 0 0 9 2 0 1 0 2 0 1 1 2 0 1 2 2 0 1 3 2 0 1 4 2 0 1 5 2 0 1 6 2 0 1 7 2 0 1 8 2 0 1 9 2 0 2 0 2 0 2 1 2 0 2 2 2 0 2 3 2 0 2 4 SFR Index Apartment Rent Index Entry Level Monthly Housing Costs 80.0% 85.0% 90.0% 95.0% 100.0% 2018 2019 2020 2021 2022 2023 2024 Build for Rent Apartment Single-Family Rental

16 MSR/Other, $50 Residential Jumbo (SEMT), $325 SFR (CAFL) Securities, $333 Multifamily Bridge Loans, $890 Single-Family Bridge Loans, $1,159 RPL (SLST) Securities, $271 HEI, $283 Other Investments, $153 Detailed Endnotes are included at the end of this presentation. Note: Numbers may not foot due to rounding. Investment Portfolio During the first quarter, we actively deployed capital into accretive new investments Q1’24 Quarterly Performance $3.5 Billion Housing Credit Investments Organically Created (80%) $1.1bn Residential Consumer $0.4bn (11%) Residential Investor $2.4bn (69%) Third-Party $0.7bn (20%) Figures ($mm) Summary of Investment Portfolio at 3/31/24 by Economic Investments(2) by Capital • Credit fundamentals within our single-family investment portfolio remained strong • We deployed $115 million of capital into organic and third-party assets, our highest quarterly capital deployment since Q3’22 • Looking ahead, we will continue to target new organic and third-party investments for our portfolio with mid-teens returns(1) • $750 million of new or renewed warehouse financing capacity, including $250 million financing facility with CPP Investments • Portfolio secured recourse leverage remained low at 0.9x (3) MSR/Other 3% Residential Jumbo (SEMT) 12% SFR (CAFL) Securities 14% Multifamily Bridge Loans 17% Single-Family Bridge Loans 18% RPL (SLST) Securities 9% HEI 15% Other Investments 12% (3)
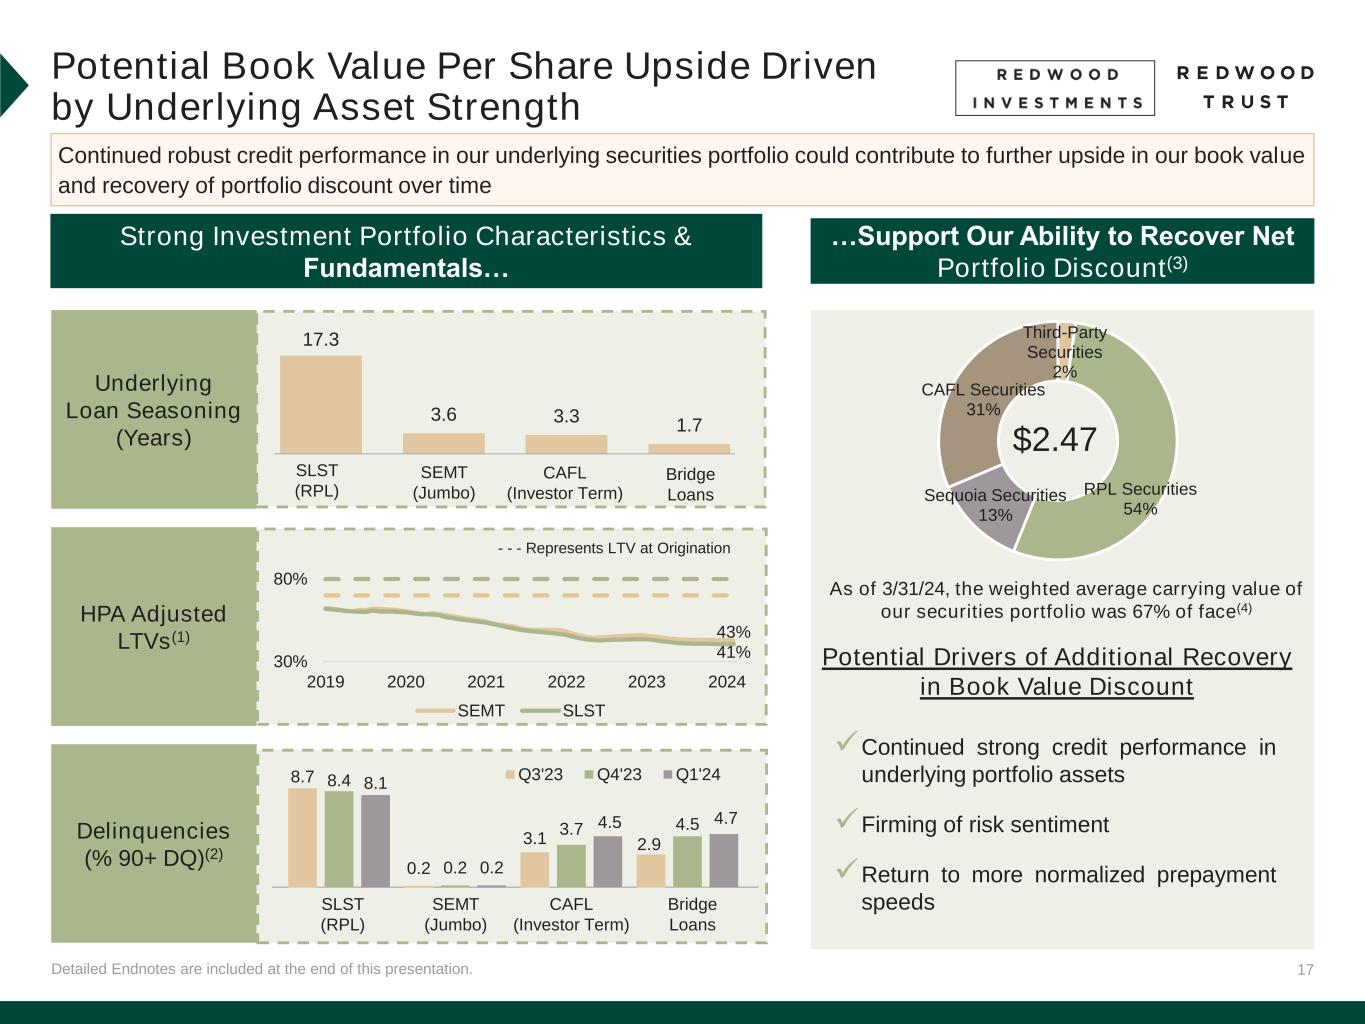
17Detailed Endnotes are included at the end of this presentation. Potential Book Value Per Share Upside Driven by Underlying Asset Strength Continued robust credit performance in our underlying securities portfolio could contribute to further upside in our book value and recovery of portfolio discount over time …Support Our Ability to Recover Net Portfolio Discount(3) As of 3/31/24, the weighted average carrying value of our securities portfolio was 67% of face(4) $2.47 ✓Continued strong credit performance in underlying portfolio assets ✓Firming of risk sentiment ✓Return to more normalized prepayment speeds Underlying Loan Seasoning (Years) HPA Adjusted LTVs(1) Delinquencies (% 90+ DQ)(2) Strong Investment Portfolio Characteristics & Fundamentals… SLST (RPL) SEMT (Jumbo) CAFL (Investor Term) Bridge Loans - - - Represents LTV at Origination SLST (RPL) SEMT (Jumbo) CAFL (Investor Term) Bridge Loans 43% 41% 30% 80% 2019 2020 2021 2022 2023 2024 SEMT SLST Third-Party Securities 2% RPL Securities 54% Sequoia Securities 13% CAFL Securities 31% Potential Drivers of Additional Recovery in Book Value Discount 17.3 3.6 3.3 1.7 8.7 0.2 3.1 2.9 8.4 0.2 3.7 4.5 8.1 0.2 4.5 4.7 Q3'23 Q4'23 Q1'24
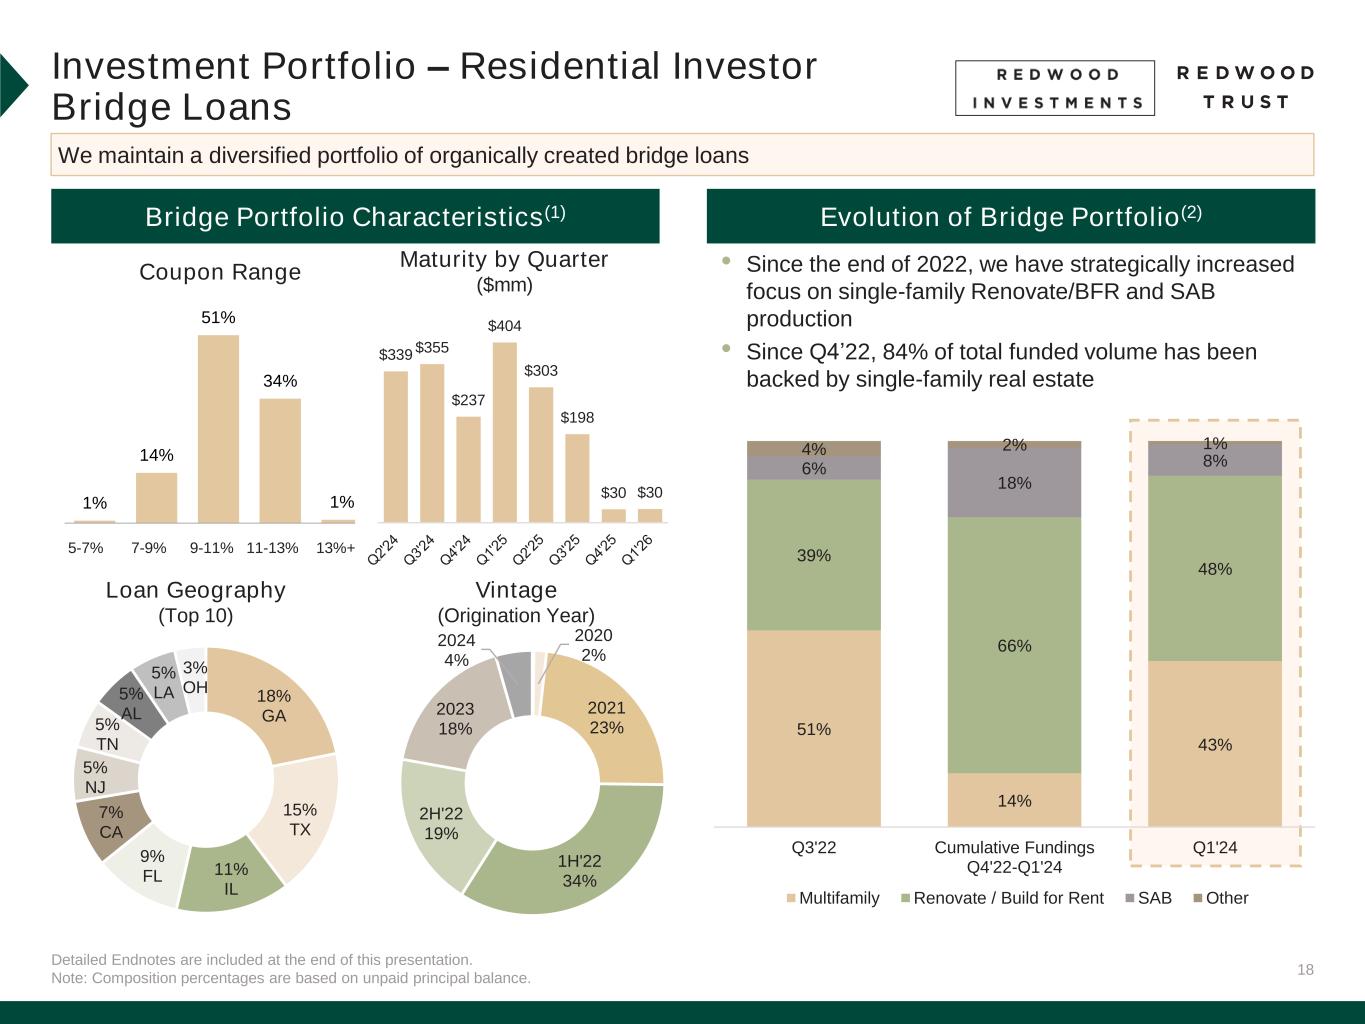
18 1% 14% 51% 34% 1% Detailed Endnotes are included at the end of this presentation. Note: Composition percentages are based on unpaid principal balance. Investment Portfolio – Residential Investor Bridge Loans Bridge Portfolio Characteristics(1) Coupon Range Loan Geography (Top 10) Vintage (Origination Year) Evolution of Bridge Portfolio(2) • Since the end of 2022, we have strategically increased focus on single-family Renovate/BFR and SAB production • Since Q4’22, 84% of total funded volume has been backed by single-family real estate We maintain a diversified portfolio of organically created bridge loans 5-7% 7-9% 9-11% 11-13% 13%+ 2020 2% 2021 23% 1H'22 34% 2H'22 19% 2023 18% 2024 4% $339 $355 $237 $404 $303 $198 $30 $30 Maturity by Quarter ($mm) 18% GA 15% TX 11% IL 9% FL 7% CA 5% NJ 5% TN 5% AL 5% LA 3% OH 51% 14% 43% 39% 66% 48% 6% 18% 8% 4% 2% 1% Q3'22 Cumulative Fundings Q4'22-Q1'24 Q1'24 Multifamily Renovate / Build for Rent SAB Other
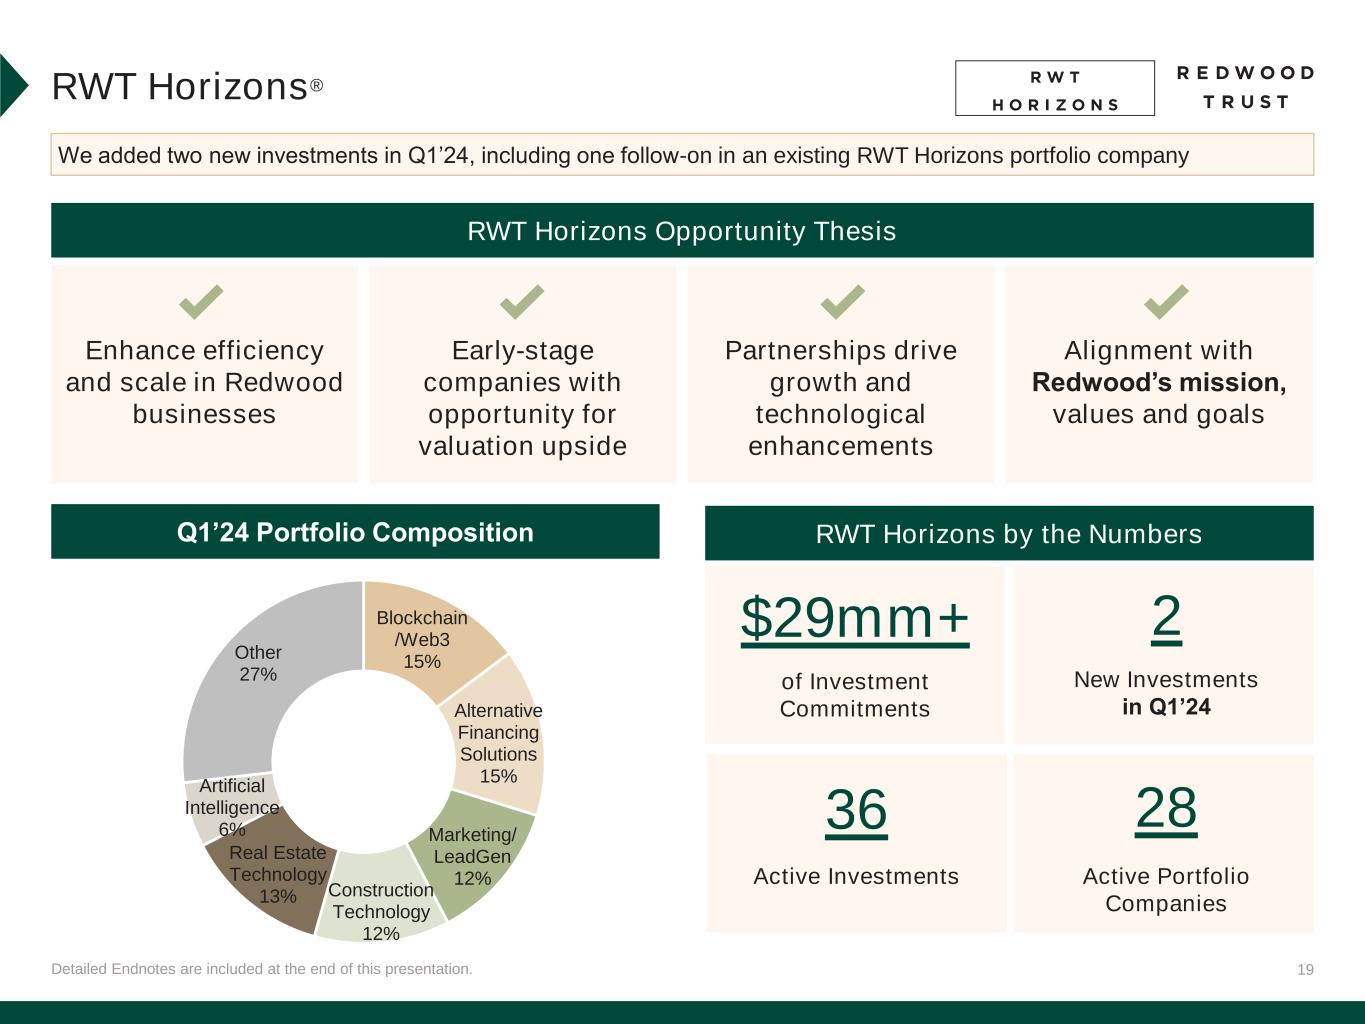
19Detailed Endnotes are included at the end of this presentation. RWT Horizons® We added two new investments in Q1’24, including one follow-on in an existing RWT Horizons portfolio company RWT Horizons by the Numbers RWT Horizons Opportunity Thesis Enhance efficiency and scale in Redwood businesses Early-stage companies with opportunity for valuation upside Partnerships drive growth and technological enhancements Alignment with Redwood’s mission, values and goals Q1’24 Portfolio Composition Blockchain /Web3 15% Alternative Financing Solutions 15% Marketing/ LeadGen 12% Construction Technology 12% Real Estate Technology 13% Artificial Intelligence 6% Other 27% of Investment Commitments $29mm+ 2 New Investments in Q1’24 36 Active Investments 28 Active Portfolio Companies

20 Financial Results
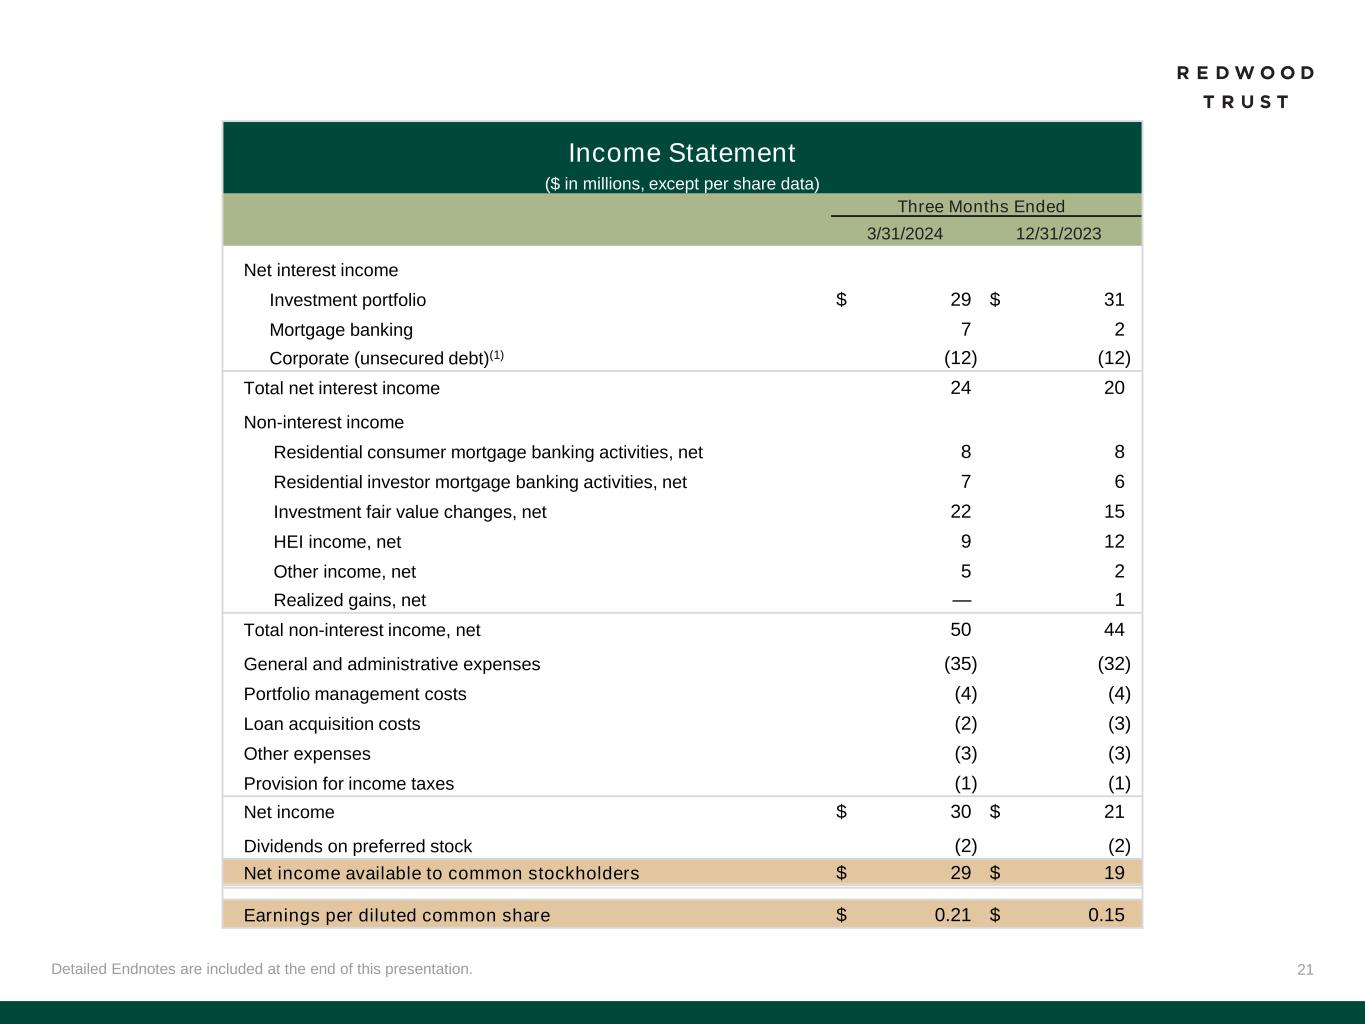
21Detailed Endnotes are included at the end of this presentation. Income Statement ($ in millions, except per share data) Three Months Ended 3/31/2024 12/31/2023 Net interest income Investment portfolio $ 29 $ 31 Mortgage banking 7 2 Corporate (unsecured debt)(1) (12) (12) Total net interest income 24 20 Non-interest income Residential consumer mortgage banking activities, net 8 8 Residential investor mortgage banking activities, net 7 6 Investment fair value changes, net 22 15 HEI income, net 9 12 Other income, net 5 2 Realized gains, net — 1 Total non-interest income, net 50 44 General and administrative expenses (35) (32) Portfolio management costs (4) (4) Loan acquisition costs (2) (3) Other expenses (3) (3) Provision for income taxes (1) (1) Net income $ 30 $ 21 Dividends on preferred stock (2) (2) Net income available to common stockholders $ 29 $ 19 Earnings per diluted common share $ 0.21 $ 0.15
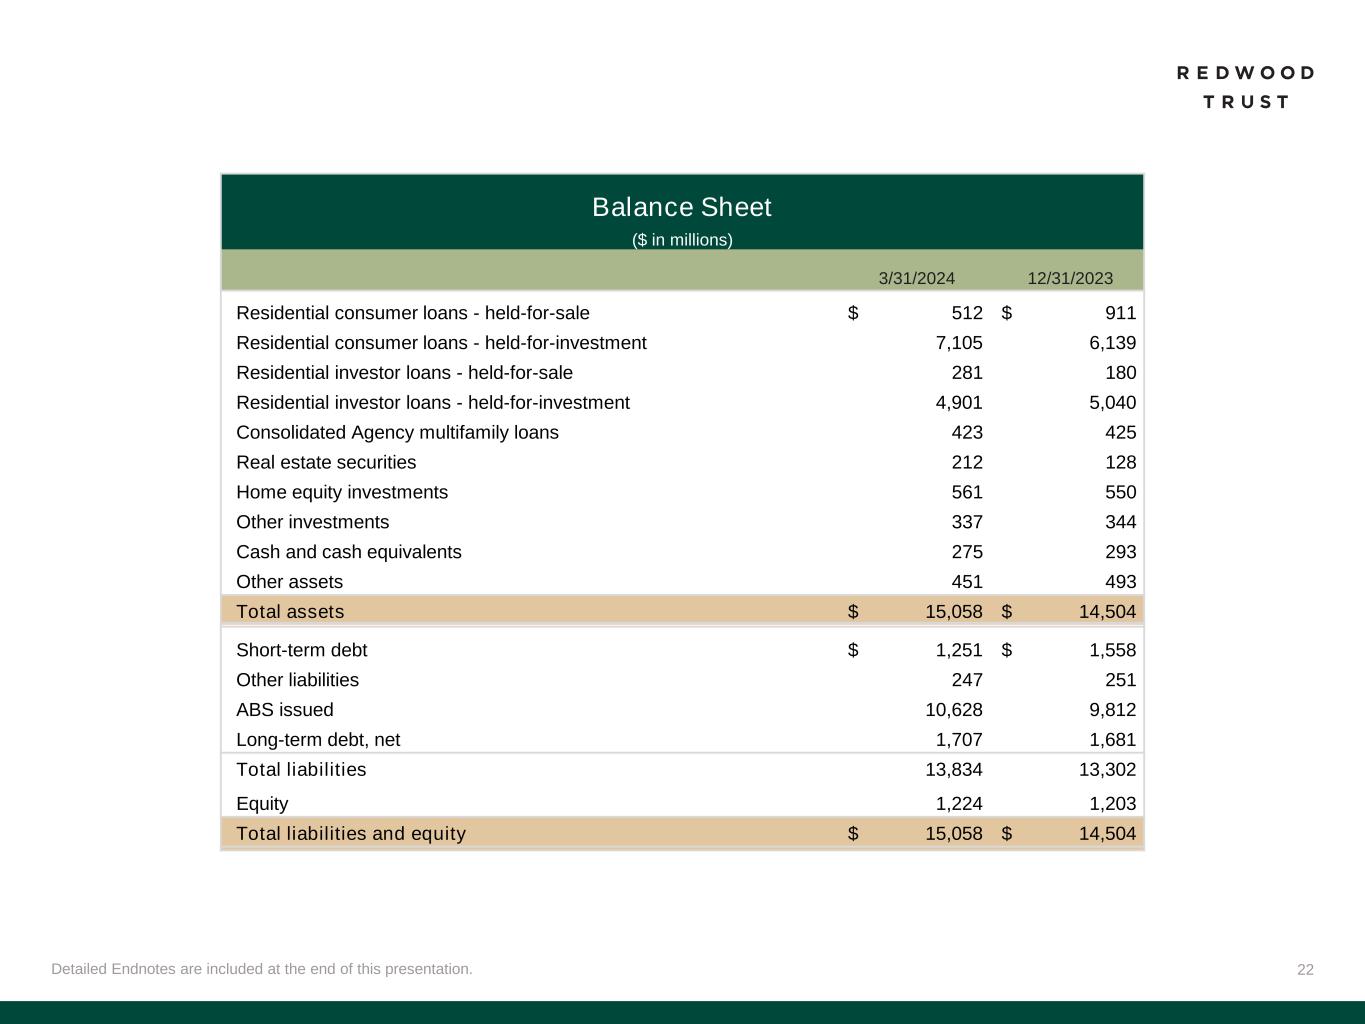
22Detailed Endnotes are included at the end of this presentation. Balance Sheet ($ in millions) 3/31/2024 12/31/2023 Residential consumer loans - held-for-sale $ 512 $ 911 Residential consumer loans - held-for-investment 7,105 6,139 Residential investor loans - held-for-sale 281 180 Residential investor loans - held-for-investment 4,901 5,040 Consolidated Agency multifamily loans 423 425 Real estate securities 212 128 Home equity investments 561 550 Other investments 337 344 Cash and cash equivalents 275 293 Other assets 451 493 Total assets $ 15,058 $ 14,504 Short-term debt $ 1,251 $ 1,558 Other liabilities 247 251 ABS issued 10,628 9,812 Long-term debt, net 1,707 1,681 Total liabilities 13,834 13,302 Equity 1,224 1,203 Total liabilities and equity $ 15,058 $ 14,504
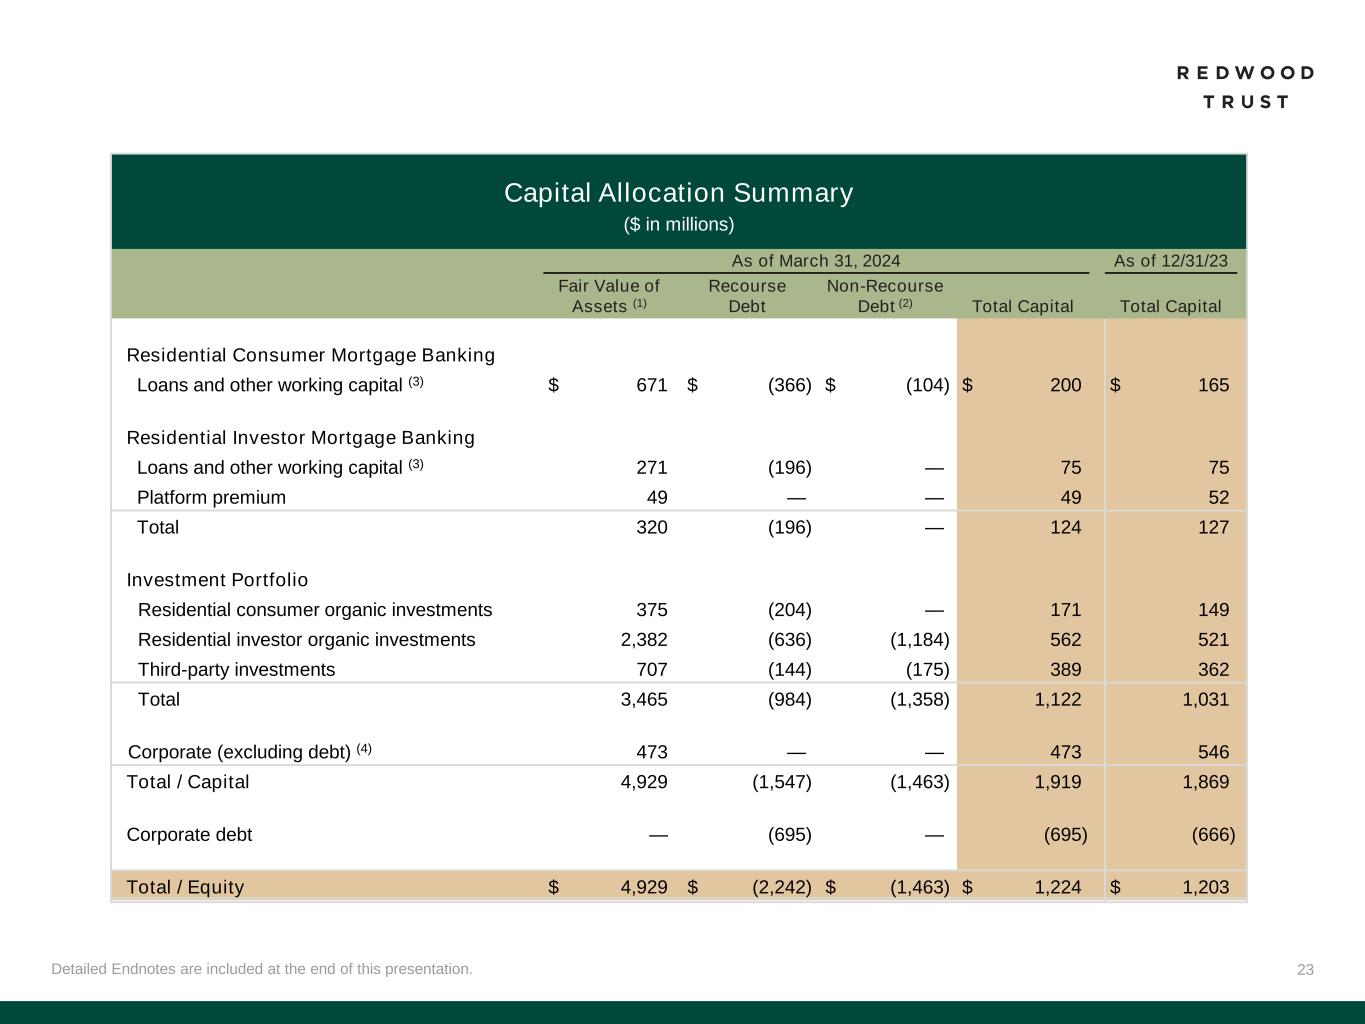
23Detailed Endnotes are included at the end of this presentation. Capital Allocation Summary ($ in millions) As of March 31, 2024 As of 12/31/23 Fair Value of Assets (1) Recourse Debt Non-Recourse Debt (2) Total Capital Total Capital Residential Consumer Mortgage Banking Loans and other working capital (3) $ 671 $ (366) $ (104) $ 200 $ 165 Residential Investor Mortgage Banking Loans and other working capital (3) 271 (196) — 75 75 Platform premium 49 — — 49 52 Total 320 (196) — 124 127 Investment Portfolio Residential consumer organic investments 375 (204) — 171 149 Residential investor organic investments 2,382 (636) (1,184) 562 521 Third-party investments 707 (144) (175) 389 362 Total 3,465 (984) (1,358) 1,122 1,031 Corporate (excluding debt) (4) 473 — — 473 546 Total / Capital 4,929 (1,547) (1,463) 1,919 1,869 Corporate debt — (695) — (695) (666) Total / Equity $ 4,929 $ (2,242) $ (1,463) $ 1,224 $ 1,203
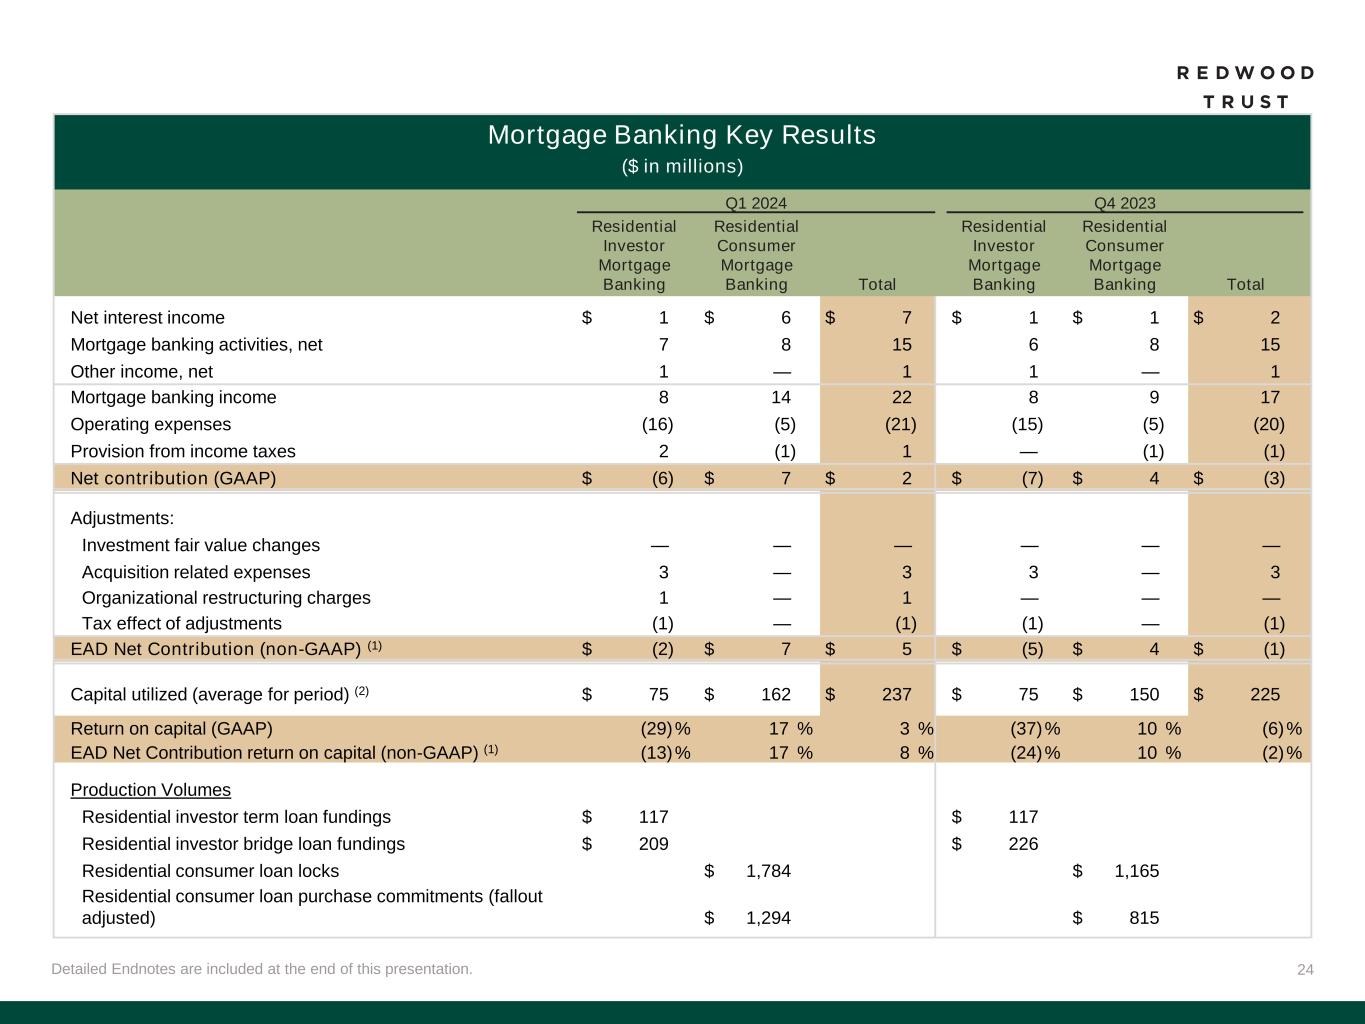
24Detailed Endnotes are included at the end of this presentation. Mortgage Banking Key Results ($ in millions) Q1 2024 Q4 2023 Residential Investor Mortgage Banking Residential Consumer Mortgage Banking Total Residential Investor Mortgage Banking Residential Consumer Mortgage Banking Total Net interest income $ 1 $ 6 $ 7 $ 1 $ 1 $ 2 Mortgage banking activities, net 7 8 15 6 8 15 Other income, net 1 — 1 1 — 1 Mortgage banking income 8 14 22 8 9 17 Operating expenses (16) (5) (21) (15) (5) (20) Provision from income taxes 2 (1) 1 — (1) (1) Net contribution (GAAP) $ (6) $ 7 $ 2 $ (7) $ 4 $ (3) Adjustments: Investment fair value changes — — — — — — Acquisition related expenses 3 — 3 3 — 3 Organizational restructuring charges 1 — 1 — — — Tax effect of adjustments (1) — (1) (1) — (1) EAD Net Contribution (non-GAAP) (1) $ (2) $ 7 $ 5 $ (5) $ 4 $ (1) Capital utilized (average for period) (2) $ 75 $ 162 $ 237 $ 75 $ 150 $ 225 Return on capital (GAAP) (29)% 17 % 3 % (37)% 10 % (6)% EAD Net Contribution return on capital (non-GAAP) (1) (13)% 17 % 8 % (24)% 10 % (2)% Production Volumes Residential investor term loan fundings $ 117 $ 117 Residential investor bridge loan fundings $ 209 $ 226 Residential consumer loan locks $ 1,784 $ 1,165 Residential consumer loan purchase commitments (fallout adjusted) $ 1,294 $ 815
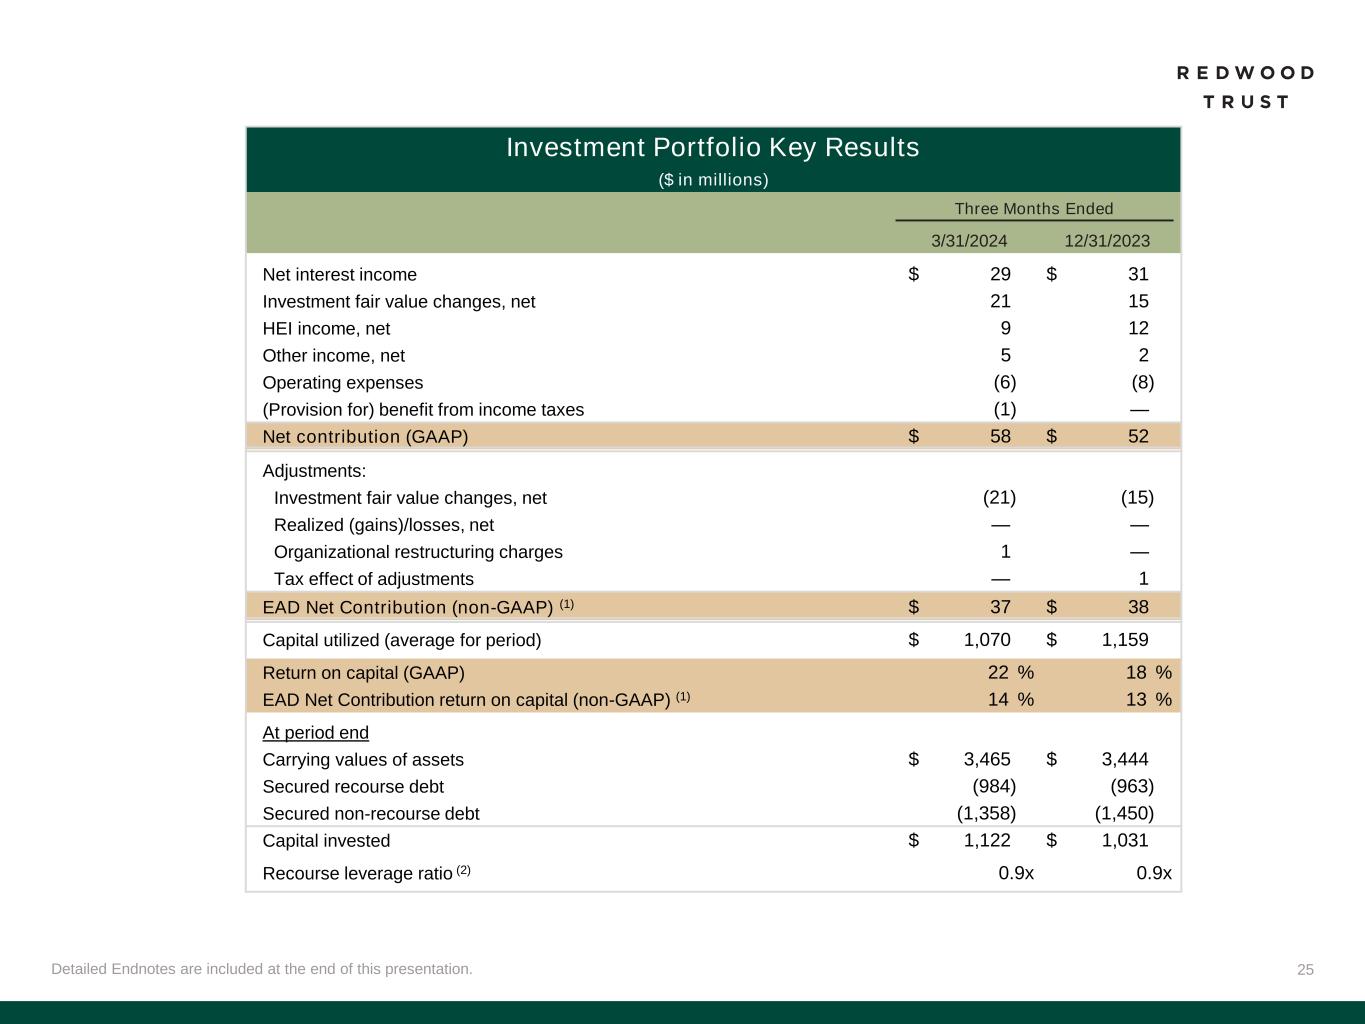
25Detailed Endnotes are included at the end of this presentation. Investment Portfolio Key Results ($ in millions) Three Months Ended 3/31/2024 12/31/2023 Net interest income $ 29 $ 31 Investment fair value changes, net 21 15 HEI income, net 9 12 Other income, net 5 2 Operating expenses (6) (8) (Provision for) benefit from income taxes (1) — Net contribution (GAAP) $ 58 $ 52 Adjustments: Investment fair value changes, net (21) (15) Realized (gains)/losses, net — — Organizational restructuring charges 1 — Tax effect of adjustments — 1 EAD Net Contribution (non-GAAP) (1) $ 37 $ 38 Capital utilized (average for period) $ 1,070 $ 1,159 Return on capital (GAAP) 22 % 18 % EAD Net Contribution return on capital (non-GAAP) (1) 14 % 13 % At period end Carrying values of assets $ 3,465 $ 3,444 Secured recourse debt (984) (963) Secured non-recourse debt (1,358) (1,450) Capital invested $ 1,122 $ 1,031 Recourse leverage ratio (2) 0.9x 0.9x
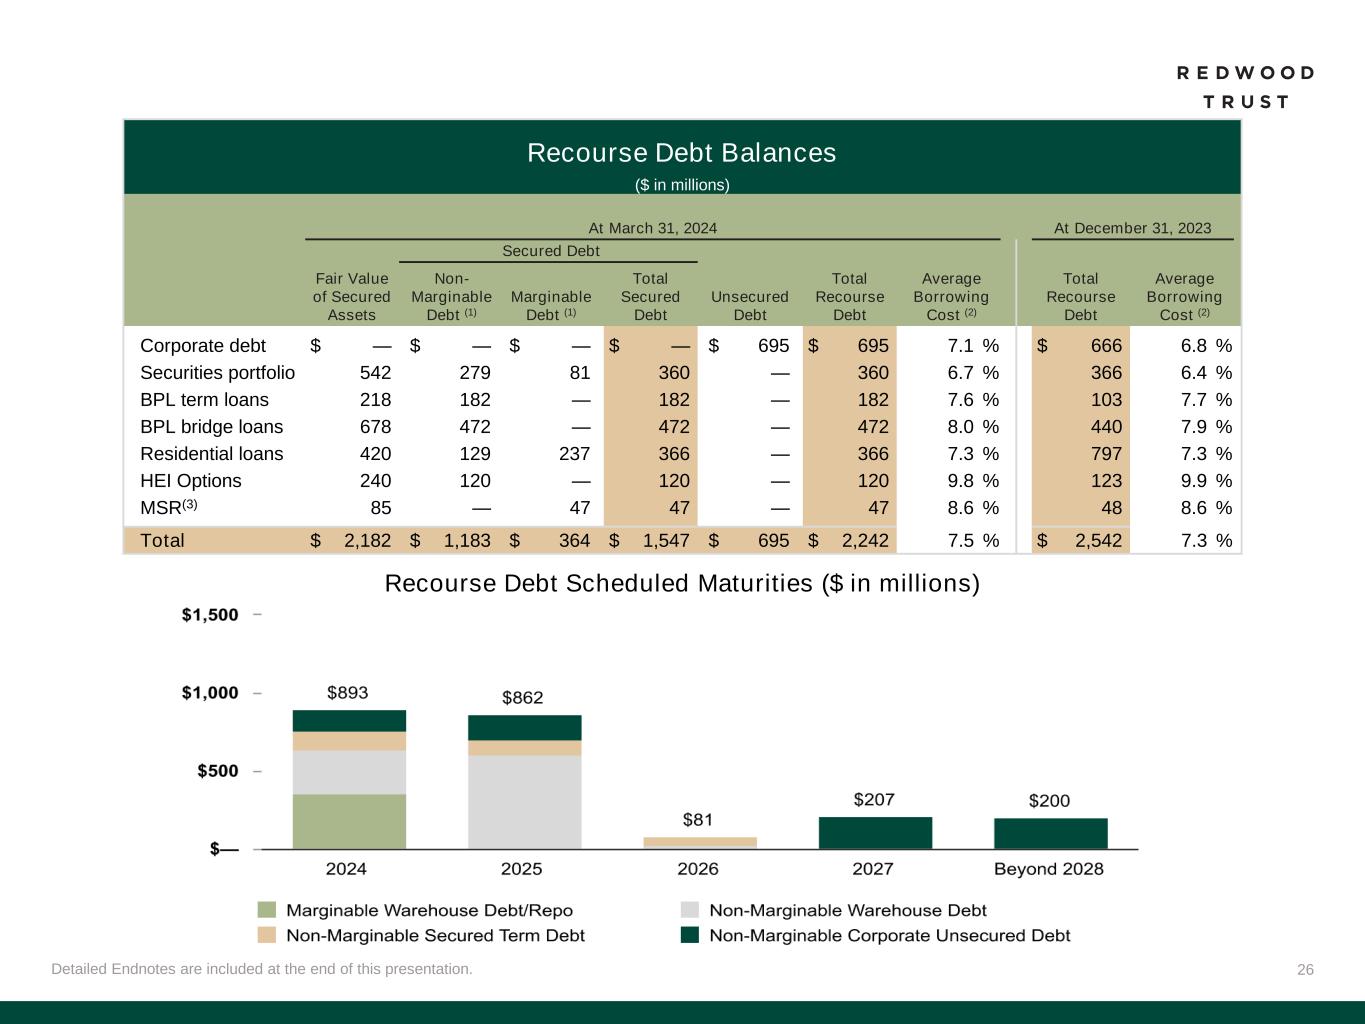
26Detailed Endnotes are included at the end of this presentation. Recourse Debt Scheduled Maturities ($ in millions) Recourse Debt Balances ($ in millions) At March 31, 2024 At December 31, 2023 Secured Debt Fair Value of Secured Assets Non- Marginable Debt (1) Marginable Debt (1) Total Secured Debt Unsecured Debt Total Recourse Debt Average Borrowing Cost (2) Total Recourse Debt Average Borrowing Cost (2) Corporate debt $ — $ — $ — $ — $ 695 $ 695 7.1 % $ 666 6.8 % Securities portfolio 542 279 81 360 — 360 6.7 % 366 6.4 % BPL term loans 218 182 — 182 — 182 7.6 % 103 7.7 % BPL bridge loans 678 472 — 472 — 472 8.0 % 440 7.9 % Residential loans 420 129 237 366 — 366 7.3 % 797 7.3 % HEI Options 240 120 — 120 — 120 9.8 % 123 9.9 % MSR(3) 85 — 47 47 — 47 8.6 % 48 8.6 % Total $ 2,182 $ 1,183 $ 364 $ 1,547 $ 695 $ 2,242 7.5 % $ 2,542 7.3 %

27 Endnotes
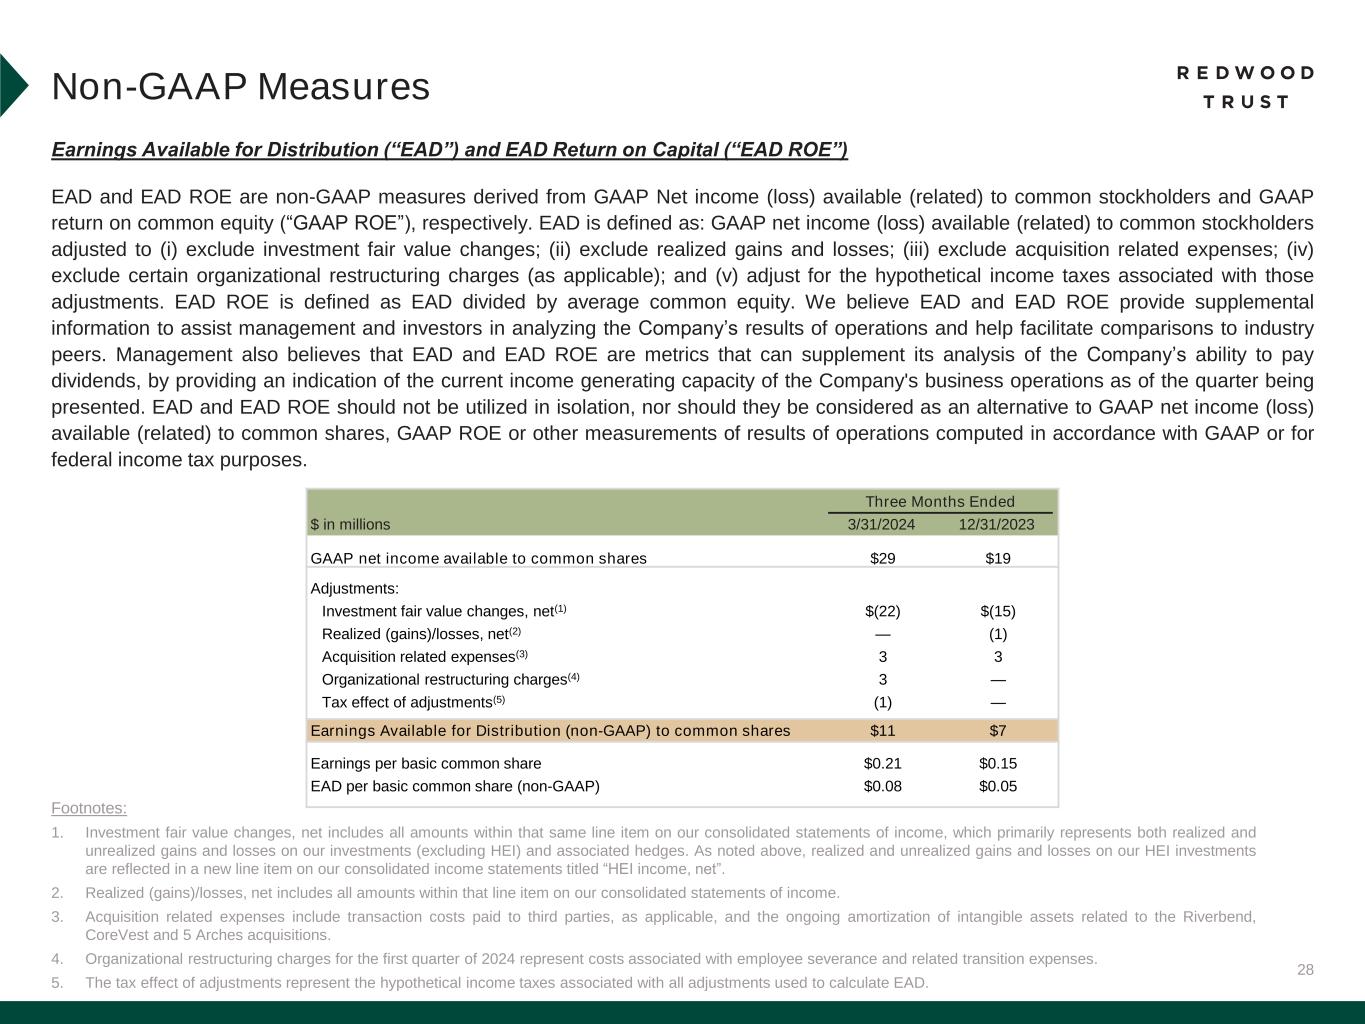
28 Earnings Available for Distribution (“EAD”) and EAD Return on Capital (“EAD ROE”) EAD and EAD ROE are non-GAAP measures derived from GAAP Net income (loss) available (related) to common stockholders and GAAP return on common equity (“GAAP ROE”), respectively. EAD is defined as: GAAP net income (loss) available (related) to common stockholders adjusted to (i) exclude investment fair value changes; (ii) exclude realized gains and losses; (iii) exclude acquisition related expenses; (iv) exclude certain organizational restructuring charges (as applicable); and (v) adjust for the hypothetical income taxes associated with those adjustments. EAD ROE is defined as EAD divided by average common equity. We believe EAD and EAD ROE provide supplemental information to assist management and investors in analyzing the Company’s results of operations and help facilitate comparisons to industry peers. Management also believes that EAD and EAD ROE are metrics that can supplement its analysis of the Company’s ability to pay dividends, by providing an indication of the current income generating capacity of the Company's business operations as of the quarter being presented. EAD and EAD ROE should not be utilized in isolation, nor should they be considered as an alternative to GAAP net income (loss) available (related) to common shares, GAAP ROE or other measurements of results of operations computed in accordance with GAAP or for federal income tax purposes. Footnotes: 1. Investment fair value changes, net includes all amounts within that same line item on our consolidated statements of income, which primarily represents both realized and unrealized gains and losses on our investments (excluding HEI) and associated hedges. As noted above, realized and unrealized gains and losses on our HEI investments are reflected in a new line item on our consolidated income statements titled “HEI income, net”. 2. Realized (gains)/losses, net includes all amounts within that line item on our consolidated statements of income. 3. Acquisition related expenses include transaction costs paid to third parties, as applicable, and the ongoing amortization of intangible assets related to the Riverbend, CoreVest and 5 Arches acquisitions. 4. Organizational restructuring charges for the first quarter of 2024 represent costs associated with employee severance and related transition expenses. 5. The tax effect of adjustments represent the hypothetical income taxes associated with all adjustments used to calculate EAD. Non-GAAP Measures Three Months Ended $ in millions 3/31/2024 12/31/2023 GAAP net income available to common shares $29 $19 Adjustments: Investment fair value changes, net(1) $(22) $(15) Realized (gains)/losses, net(2) — (1) Acquisition related expenses(3) 3 3 Organizational restructuring charges(4) 3 — Tax effect of adjustments(5) (1) — Earnings Available for Distribution (non-GAAP) to common shares $11 $7 Earnings per basic common share $0.21 $0.15 EAD per basic common share (non-GAAP) $0.08 $0.05
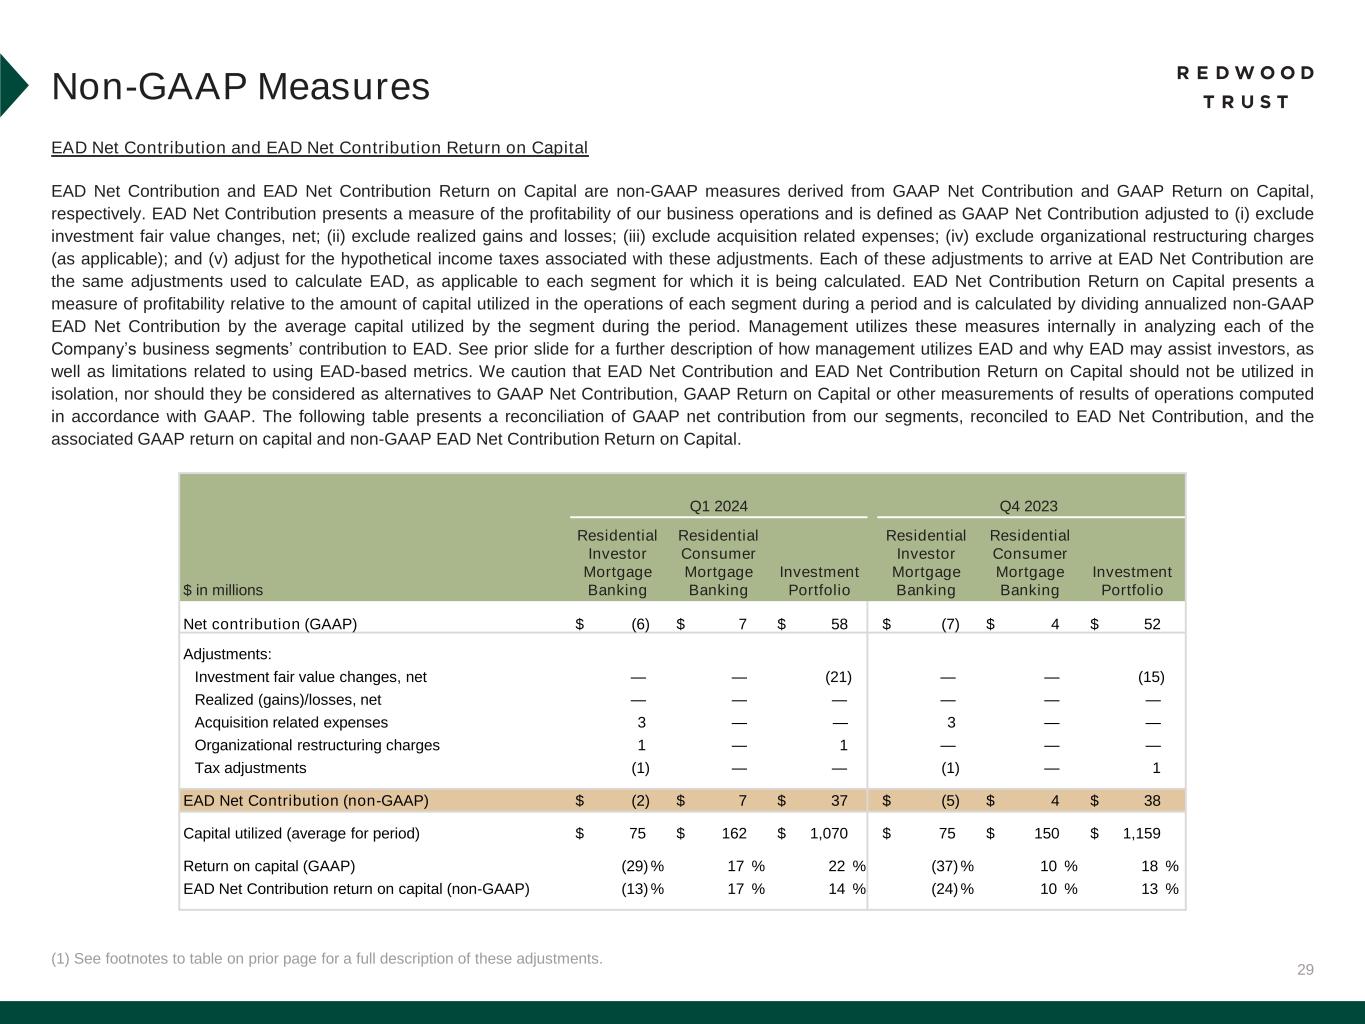
29 EAD Net Contribution and EAD Net Contribution Return on Capital EAD Net Contribution and EAD Net Contribution Return on Capital are non-GAAP measures derived from GAAP Net Contribution and GAAP Return on Capital, respectively. EAD Net Contribution presents a measure of the profitability of our business operations and is defined as GAAP Net Contribution adjusted to (i) exclude investment fair value changes, net; (ii) exclude realized gains and losses; (iii) exclude acquisition related expenses; (iv) exclude organizational restructuring charges (as applicable); and (v) adjust for the hypothetical income taxes associated with these adjustments. Each of these adjustments to arrive at EAD Net Contribution are the same adjustments used to calculate EAD, as applicable to each segment for which it is being calculated. EAD Net Contribution Return on Capital presents a measure of profitability relative to the amount of capital utilized in the operations of each segment during a period and is calculated by dividing annualized non-GAAP EAD Net Contribution by the average capital utilized by the segment during the period. Management utilizes these measures internally in analyzing each of the Company’s business segments’ contribution to EAD. See prior slide for a further description of how management utilizes EAD and why EAD may assist investors, as well as limitations related to using EAD-based metrics. We caution that EAD Net Contribution and EAD Net Contribution Return on Capital should not be utilized in isolation, nor should they be considered as alternatives to GAAP Net Contribution, GAAP Return on Capital or other measurements of results of operations computed in accordance with GAAP. The following table presents a reconciliation of GAAP net contribution from our segments, reconciled to EAD Net Contribution, and the associated GAAP return on capital and non-GAAP EAD Net Contribution Return on Capital. (1) See footnotes to table on prior page for a full description of these adjustments. Non-GAAP Measures Q1 2024 Q4 2023 $ in millions Residential Investor Mortgage Banking Residential Consumer Mortgage Banking Investment Portfolio Residential Investor Mortgage Banking Residential Consumer Mortgage Banking Investment Portfolio Net contribution (GAAP) $ (6) $ 7 $ 58 $ (7) $ 4 $ 52 Adjustments: Investment fair value changes, net — — (21) — — (15) Realized (gains)/losses, net — — — — — — Acquisition related expenses 3 — — 3 — — Organizational restructuring charges 1 — 1 — — — Tax adjustments (1) — — (1) — 1 EAD Net Contribution (non-GAAP) $ (2) $ 7 $ 37 $ (5) $ 4 $ 38 Capital utilized (average for period) $ 75 $ 162 $ 1,070 $ 75 $ 150 $ 1,159 Return on capital (GAAP) (29) % 17 % 22 % (37) % 10 % 18 % EAD Net Contribution return on capital (non-GAAP) (13) % 17 % 14 % (24) % 10 % 13 %

30 Slide 3 (Redwood is a Full Spectrum Residential Housing Finance Platform) Source: Company financial data as of March 31, 2024 unless otherwise noted. 1. Allocated capital includes working capital and platform premium for mortgage banking operations and all investments net of associated debt for investment portfolio. Note, capital allocation excludes corporate capital and RWT Horizons. Further detail on the components of allocated capital is included in the Financial Results section of this presentation. 2. Annual Addressable Market Opportunity. Residential Consumer Mortgage Banking opportunity for Jumbo Lock Volume based on MBA Mortgage Finance Forecast for full year 2024 (as of April 2024), adjusted for estimated 12% share to jumbo production. Residential Consumer opportunity for Jumbo Loan Sales based on quantity of jumbo loans held on bank balance sheets (Source: JP Morgan Research). Residential Investor Mortgage Banking based on combined opportunity for SFR and Multifamily Rental. SFR based on March 2024 data and potential financing opportunity for SFR of $130 billion over 3-4 years (Source: John Burns Research and Consulting, LLC and internal Company estimates). Multifamily based on Freddie Mac 2024 multifamily origination estimate of $370 billion, adjusted for FNMA estimate of originations by non-traditional multifamily lenders. Investment Portfolio represents estimated investment opportunities across private label securities (“PLS”) subordinate securities, Credit Risk Transfer (“CRT”), HEI, Multifamily, Non-QM, NPL/RPL, Bridge and CAFL® SFR investments (Source: internal Company estimates). Slide 4 (Q1’24 Financial Performance) Source: Company financial data as of March 31, 2024 unless otherwise noted. Market data per Bloomberg as of March 28, 2024. 1. Earnings Available for Distribution (“EAD”) is a non-GAAP measure. See slide in the Endnotes section of this presentation for additional information and reconciliation to GAAP net income. 2. Total economic return is based on the periodic change in GAAP book value per common share plus dividends declared per common share during the period, divided by beginning period GAAP book value per common share. 3. Indicative dividend yield based on RWT closing stock price of $6.37 on March 28, 2024. 4. Allocated capital includes working capital and platform premium for mortgage banking operations and all investments net of associated debt for investment portfolio. Capital allocation excludes corporate capital and RWT Horizons. Further detail on the components of allocated capital is included in the Financial Results section of this presentation. Single-Family Investment Portfolio capital allocation includes all capital allocated to the Investment Portfolio, including nominal amount of capital allocated to Freddie K-Series and CAFL securities with multifamily collateral and excluding capital allocated to Multifamily Bridge, which is depicted as its own sub-category on this chart. 5. EAD ROE is a non-GAAP metric. Please refer to Non-GAAP Measures in the Endnotes section of this presentation for additional information. 6. Recourse leverage ratio at March 31, 2024 is defined as recourse debt at Redwood exclusive of other liabilities, divided by tangible stockholders' equity. Recourse debt excludes $10.8 billion of consolidated securitization debt (ABS issued and servicer advance financing) $0.6 billion of other debt that is non-recourse to Redwood, and $0.2 billion of other liabilities, and tangible stockholders' equity excludes $49 million of goodwill and intangible assets. Slide 5 (Q1’24 Business Performance) Source: Company financial data as of March 31, 2024 unless otherwise noted. 1. Lock volume represents loans identified for purchase from loan sellers. Lock volume does not account for potential fallout from pipeline that typically occurs through the lending process. 2. Target purchasing power assumes joint venture successfully establishes planned third-party warehouse financing facilities. 3. Includes Q2’24 activity through April 29, 2024. Endnotes
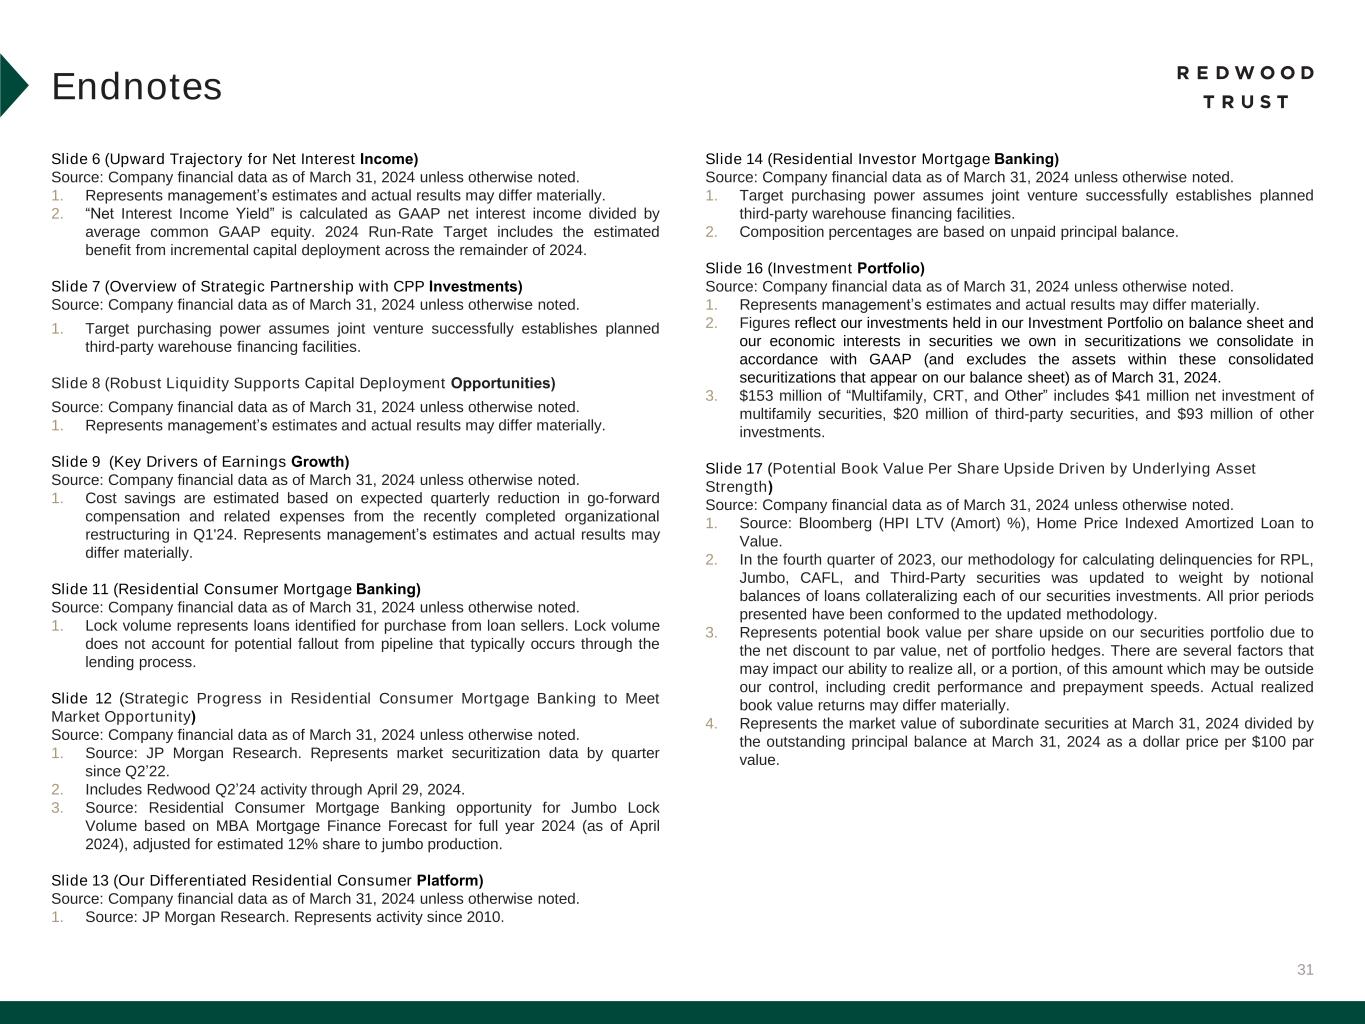
31 Slide 6 (Upward Trajectory for Net Interest Income) Source: Company financial data as of March 31, 2024 unless otherwise noted. 1. Represents management’s estimates and actual results may differ materially. 2. “Net Interest Income Yield” is calculated as GAAP net interest income divided by average common GAAP equity. 2024 Run-Rate Target includes the estimated benefit from incremental capital deployment across the remainder of 2024. Slide 7 (Overview of Strategic Partnership with CPP Investments) Source: Company financial data as of March 31, 2024 unless otherwise noted. 1. Target purchasing power assumes joint venture successfully establishes planned third-party warehouse financing facilities. Slide 8 (Robust Liquidity Supports Capital Deployment Opportunities) Source: Company financial data as of March 31, 2024 unless otherwise noted. 1. Represents management’s estimates and actual results may differ materially. Slide 9 (Key Drivers of Earnings Growth) Source: Company financial data as of March 31, 2024 unless otherwise noted. 1. Cost savings are estimated based on expected quarterly reduction in go-forward compensation and related expenses from the recently completed organizational restructuring in Q1'24. Represents management’s estimates and actual results may differ materially. Slide 11 (Residential Consumer Mortgage Banking) Source: Company financial data as of March 31, 2024 unless otherwise noted. 1. Lock volume represents loans identified for purchase from loan sellers. Lock volume does not account for potential fallout from pipeline that typically occurs through the lending process. Slide 12 (Strategic Progress in Residential Consumer Mortgage Banking to Meet Market Opportunity) Source: Company financial data as of March 31, 2024 unless otherwise noted. 1. Source: JP Morgan Research. Represents market securitization data by quarter since Q2’22. 2. Includes Redwood Q2’24 activity through April 29, 2024. 3. Source: Residential Consumer Mortgage Banking opportunity for Jumbo Lock Volume based on MBA Mortgage Finance Forecast for full year 2024 (as of April 2024), adjusted for estimated 12% share to jumbo production. Slide 13 (Our Differentiated Residential Consumer Platform) Source: Company financial data as of March 31, 2024 unless otherwise noted. 1. Source: JP Morgan Research. Represents activity since 2010. Slide 14 (Residential Investor Mortgage Banking) Source: Company financial data as of March 31, 2024 unless otherwise noted. 1. Target purchasing power assumes joint venture successfully establishes planned third-party warehouse financing facilities. 2. Composition percentages are based on unpaid principal balance. Slide 16 (Investment Portfolio) Source: Company financial data as of March 31, 2024 unless otherwise noted. 1. Represents management’s estimates and actual results may differ materially. 2. Figures reflect our investments held in our Investment Portfolio on balance sheet and our economic interests in securities we own in securitizations we consolidate in accordance with GAAP (and excludes the assets within these consolidated securitizations that appear on our balance sheet) as of March 31, 2024. 3. $153 million of “Multifamily, CRT, and Other” includes $41 million net investment of multifamily securities, $20 million of third-party securities, and $93 million of other investments. Slide 17 (Potential Book Value Per Share Upside Driven by Underlying Asset Strength) Source: Company financial data as of March 31, 2024 unless otherwise noted. 1. Source: Bloomberg (HPI LTV (Amort) %), Home Price Indexed Amortized Loan to Value. 2. In the fourth quarter of 2023, our methodology for calculating delinquencies for RPL, Jumbo, CAFL, and Third-Party securities was updated to weight by notional balances of loans collateralizing each of our securities investments. All prior periods presented have been conformed to the updated methodology. 3. Represents potential book value per share upside on our securities portfolio due to the net discount to par value, net of portfolio hedges. There are several factors that may impact our ability to realize all, or a portion, of this amount which may be outside our control, including credit performance and prepayment speeds. Actual realized book value returns may differ materially. 4. Represents the market value of subordinate securities at March 31, 2024 divided by the outstanding principal balance at March 31, 2024 as a dollar price per $100 par value. Endnotes
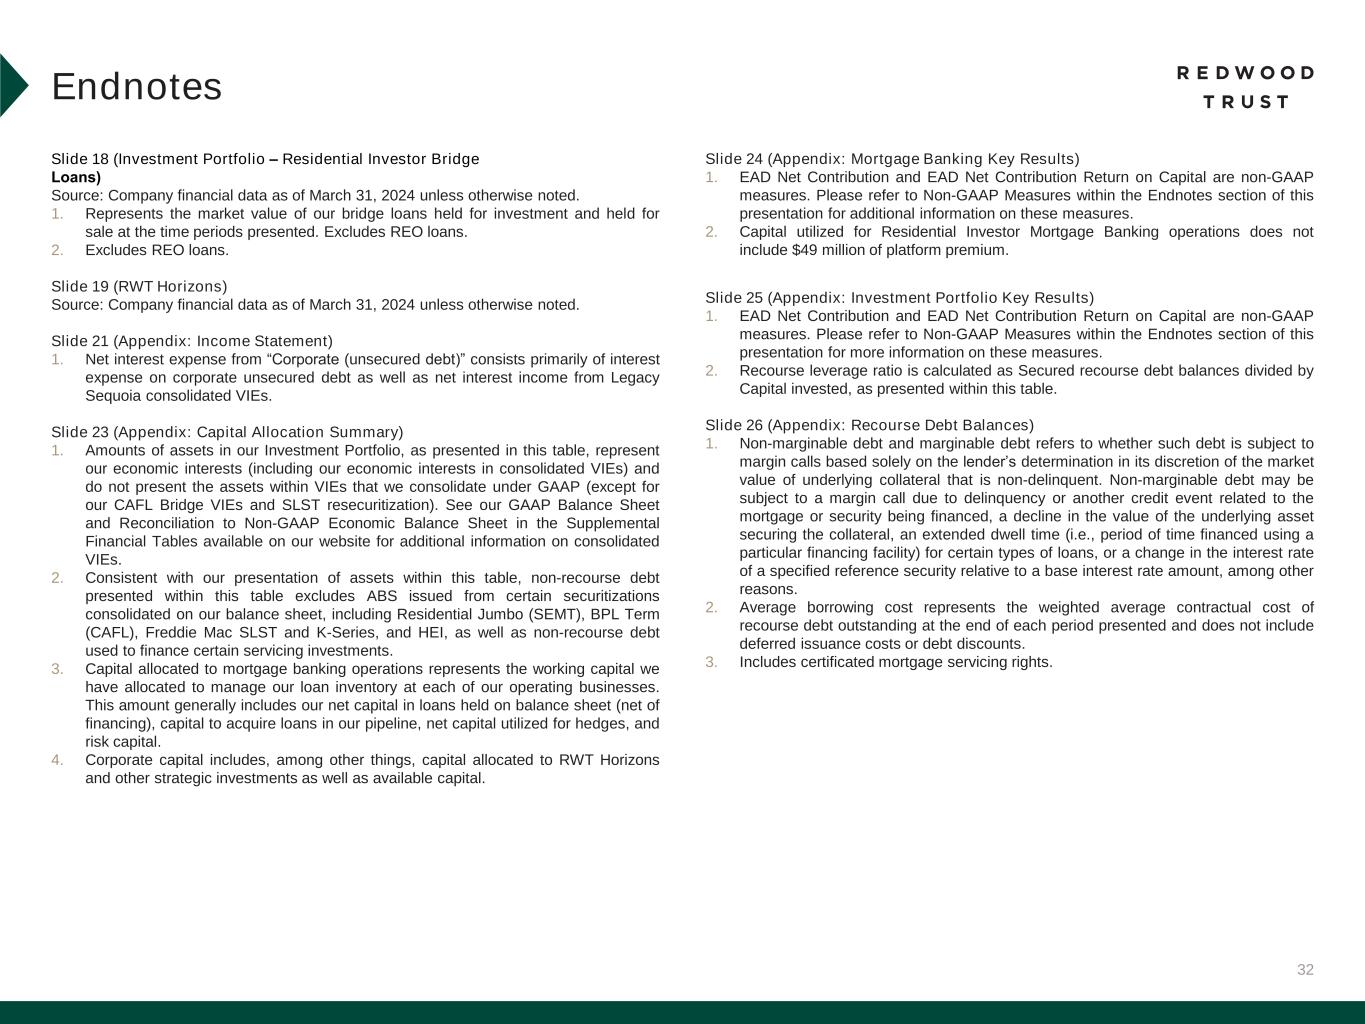
32 Slide 18 (Investment Portfolio – Residential Investor Bridge Loans) Source: Company financial data as of March 31, 2024 unless otherwise noted. 1. Represents the market value of our bridge loans held for investment and held for sale at the time periods presented. Excludes REO loans. 2. Excludes REO loans. Slide 19 (RWT Horizons) Source: Company financial data as of March 31, 2024 unless otherwise noted. Slide 21 (Appendix: Income Statement) 1. Net interest expense from “Corporate (unsecured debt)” consists primarily of interest expense on corporate unsecured debt as well as net interest income from Legacy Sequoia consolidated VIEs. Slide 23 (Appendix: Capital Allocation Summary) 1. Amounts of assets in our Investment Portfolio, as presented in this table, represent our economic interests (including our economic interests in consolidated VIEs) and do not present the assets within VIEs that we consolidate under GAAP (except for our CAFL Bridge VIEs and SLST resecuritization). See our GAAP Balance Sheet and Reconciliation to Non-GAAP Economic Balance Sheet in the Supplemental Financial Tables available on our website for additional information on consolidated VIEs. 2. Consistent with our presentation of assets within this table, non-recourse debt presented within this table excludes ABS issued from certain securitizations consolidated on our balance sheet, including Residential Jumbo (SEMT), BPL Term (CAFL), Freddie Mac SLST and K-Series, and HEI, as well as non-recourse debt used to finance certain servicing investments. 3. Capital allocated to mortgage banking operations represents the working capital we have allocated to manage our loan inventory at each of our operating businesses. This amount generally includes our net capital in loans held on balance sheet (net of financing), capital to acquire loans in our pipeline, net capital utilized for hedges, and risk capital. 4. Corporate capital includes, among other things, capital allocated to RWT Horizons and other strategic investments as well as available capital. Endnotes Slide 24 (Appendix: Mortgage Banking Key Results) 1. EAD Net Contribution and EAD Net Contribution Return on Capital are non-GAAP measures. Please refer to Non-GAAP Measures within the Endnotes section of this presentation for additional information on these measures. 2. Capital utilized for Residential Investor Mortgage Banking operations does not include $49 million of platform premium. Slide 25 (Appendix: Investment Portfolio Key Results) 1. EAD Net Contribution and EAD Net Contribution Return on Capital are non-GAAP measures. Please refer to Non-GAAP Measures within the Endnotes section of this presentation for more information on these measures. 2. Recourse leverage ratio is calculated as Secured recourse debt balances divided by Capital invested, as presented within this table. Slide 26 (Appendix: Recourse Debt Balances) 1. Non-marginable debt and marginable debt refers to whether such debt is subject to margin calls based solely on the lender’s determination in its discretion of the market value of underlying collateral that is non-delinquent. Non-marginable debt may be subject to a margin call due to delinquency or another credit event related to the mortgage or security being financed, a decline in the value of the underlying asset securing the collateral, an extended dwell time (i.e., period of time financed using a particular financing facility) for certain types of loans, or a change in the interest rate of a specified reference security relative to a base interest rate amount, among other reasons. 2. Average borrowing cost represents the weighted average contractual cost of recourse debt outstanding at the end of each period presented and does not include deferred issuance costs or debt discounts. 3. Includes certificated mortgage servicing rights.
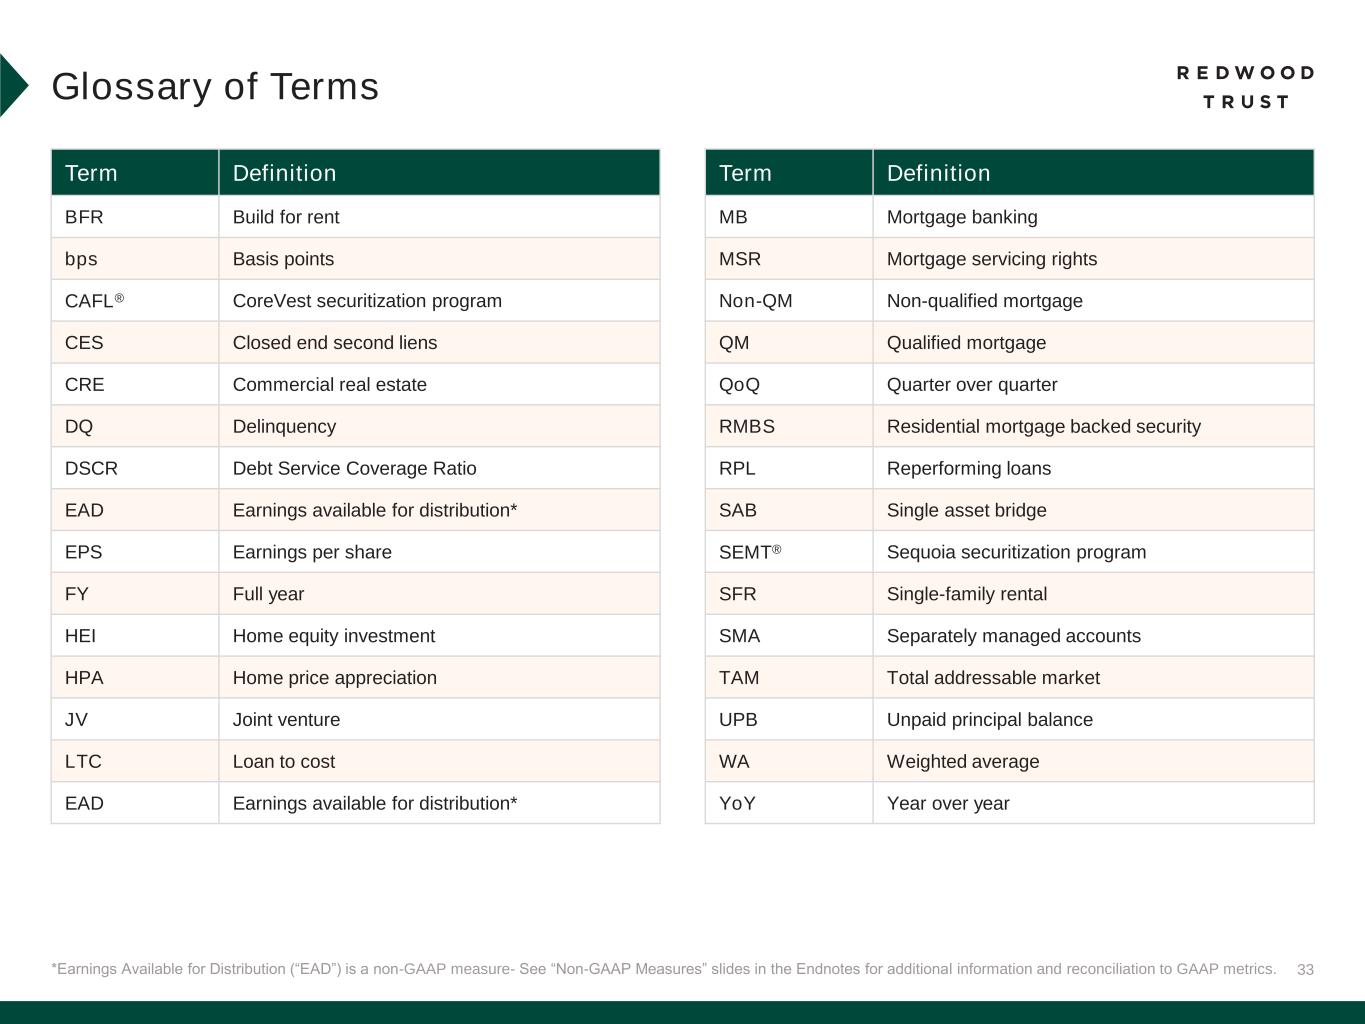
33*Earnings Available for Distribution (“EAD”) is a non-GAAP measure- See “Non-GAAP Measures” slides in the Endnotes for additional information and reconciliation to GAAP metrics. Glossary of Terms Term Definition BFR Build for rent bps Basis points CAFL® CoreVest securitization program CES Closed end second liens CRE Commercial real estate DQ Delinquency DSCR Debt Service Coverage Ratio EAD Earnings available for distribution* EPS Earnings per share FY Full year HEI Home equity investment HPA Home price appreciation JV Joint venture LTC Loan to cost EAD Earnings available for distribution* Term Definition MB Mortgage banking MSR Mortgage servicing rights Non-QM Non-qualified mortgage QM Qualified mortgage QoQ Quarter over quarter RMBS Residential mortgage backed security RPL Reperforming loans SAB Single asset bridge SEMT® Sequoia securitization program SFR Single-family rental SMA Separately managed accounts TAM Total addressable market UPB Unpaid principal balance WA Weighted average YoY Year over year