
1 Q2 2023 Redwood Review July 27, 2023 Exhibit 99.3
2 Cautionary Statement; Forward-Looking Statements This presentation contains forward-looking statements, including statements regarding our 2023 forward outlook, estimates of upside and potential earnings in our investment portfolio from embedded discounts to par value on securities, outlook on jumbo residential loan purchase opportunities, expectations of customer demand for fixed-rate Term and Bridge products, estimates of future G&A expense run rate and resulting impacts to profitability, estimated forward-looking economic yields on our Investment Portfolio, and expected average dollar amount of draws per quarter on BPL bridge loans. Forward-looking statements involve numerous risks and uncertainties. Our actual results may differ from our beliefs, expectations, estimates, and projections and, consequently, you should not rely on these forward- looking statements as predictions of future events. Forward-looking statements are not historical in nature and can be identified by words such as “anticipate,” “estimate,” “will,” “should,” “expect,” “believe,” “intend,” “seek,” “plan” and similar expressions or their negative forms, or by references to strategy, plans, opportunities, or intentions. These forward-looking statements are subject to risks and uncertainties, including, among other things, those described in the Company’s Annual Report on Form 10-K for the year ended December 31, 2022 and any subsequent Quarterly Reports on Form 10-Q under the caption “Risk Factors.” Other risks, uncertainties, and factors that could cause actual results to differ materially from those projected may be described from time to time in reports the Company files with the Securities and Exchange Commission, including Current Reports on Form 8-K. Additionally, this presentation contains estimates and information concerning our industry, including market size and growth rates of the markets in which we participate, that are based on industry publications and reports. This information involves many assumptions and limitations, and you are cautioned not to give undue weight to these estimates. We have not independently verified the accuracy or completeness of the data contained in these industry publications and reports. The industry in which we operate is subject to a high degree of uncertainty and risk due to a variety of factors, including those referred to above, that could cause results to differ materially from those expressed in these publications and reports.

3 Redwood’s mission is to make quality housing, whether rented or owned, accessible to all American households Detailed Endnotes are included at the end of this presentation. 29-Year Track Record of Strong Performance and Earnings Generation Diversified Product Set with Balanced Earnings Streams Industry Leading Operating Platforms Best-in-Class Securitization Platforms and Distribution Channels Control Credit through Disciplined Underwriting Ability to Organically Create Assets for Balance Sheet Innovative Technology Organically and Through Partnerships Deep and Experienced Management Team O U R D I FFER EN TIAT O R S ®
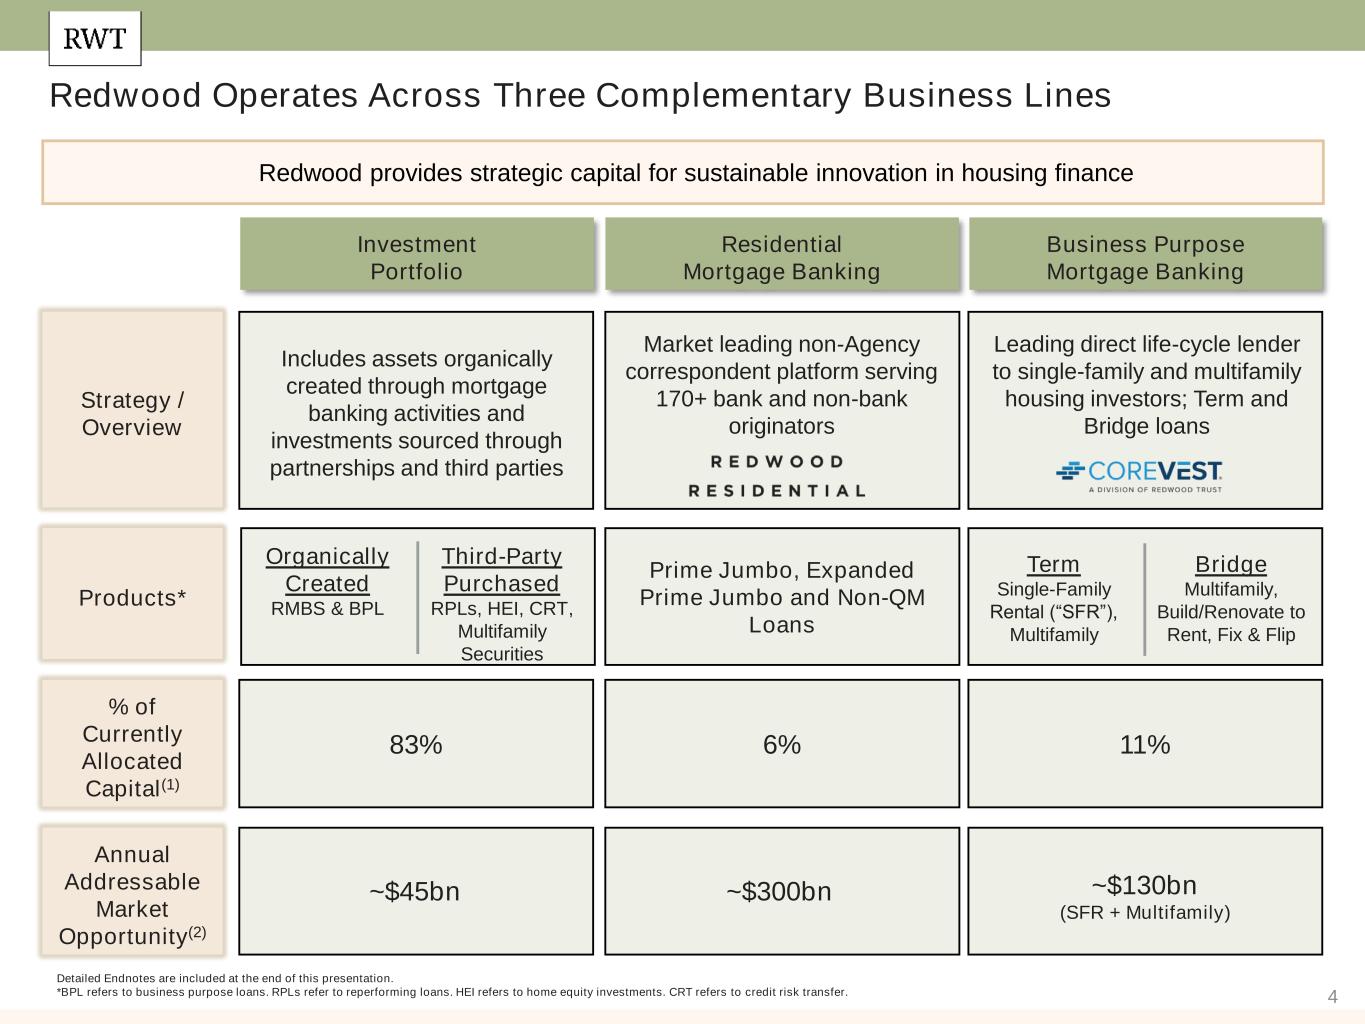
4 Detailed Endnotes are included at the end of this presentation. *BPL refers to business purpose loans. RPLs refer to reperforming loans. HEI refers to home equity investments. CRT refers to credit risk transfer. Redwood Operates Across Three Complementary Business Lines Redwood provides strategic capital for sustainable innovation in housing finance Residential Mortgage Banking Business Purpose Mortgage Banking Strategy / Overview ~$300bn ~$130bn (SFR + Multifamily) 6% 11% % of Currently Allocated Capital(1) Annual Addressable Market Opportunity(2) Products* Market leading non-Agency correspondent platform serving 170+ bank and non-bank originators Leading direct life-cycle lender to single-family and multifamily housing investors; Term and Bridge loans Investment Portfolio ~$45bn 83% Includes assets organically created through mortgage banking activities and investments sourced through partnerships and third parties Prime Jumbo, Expanded Prime Jumbo and Non-QM Loans Term Single-Family Rental (“SFR”), Multifamily Bridge Multifamily, Build/Renovate to Rent, Fix & Flip Organically Created RMBS & BPL Third-Party Purchased RPLs, HEI, CRT, Multifamily Securities
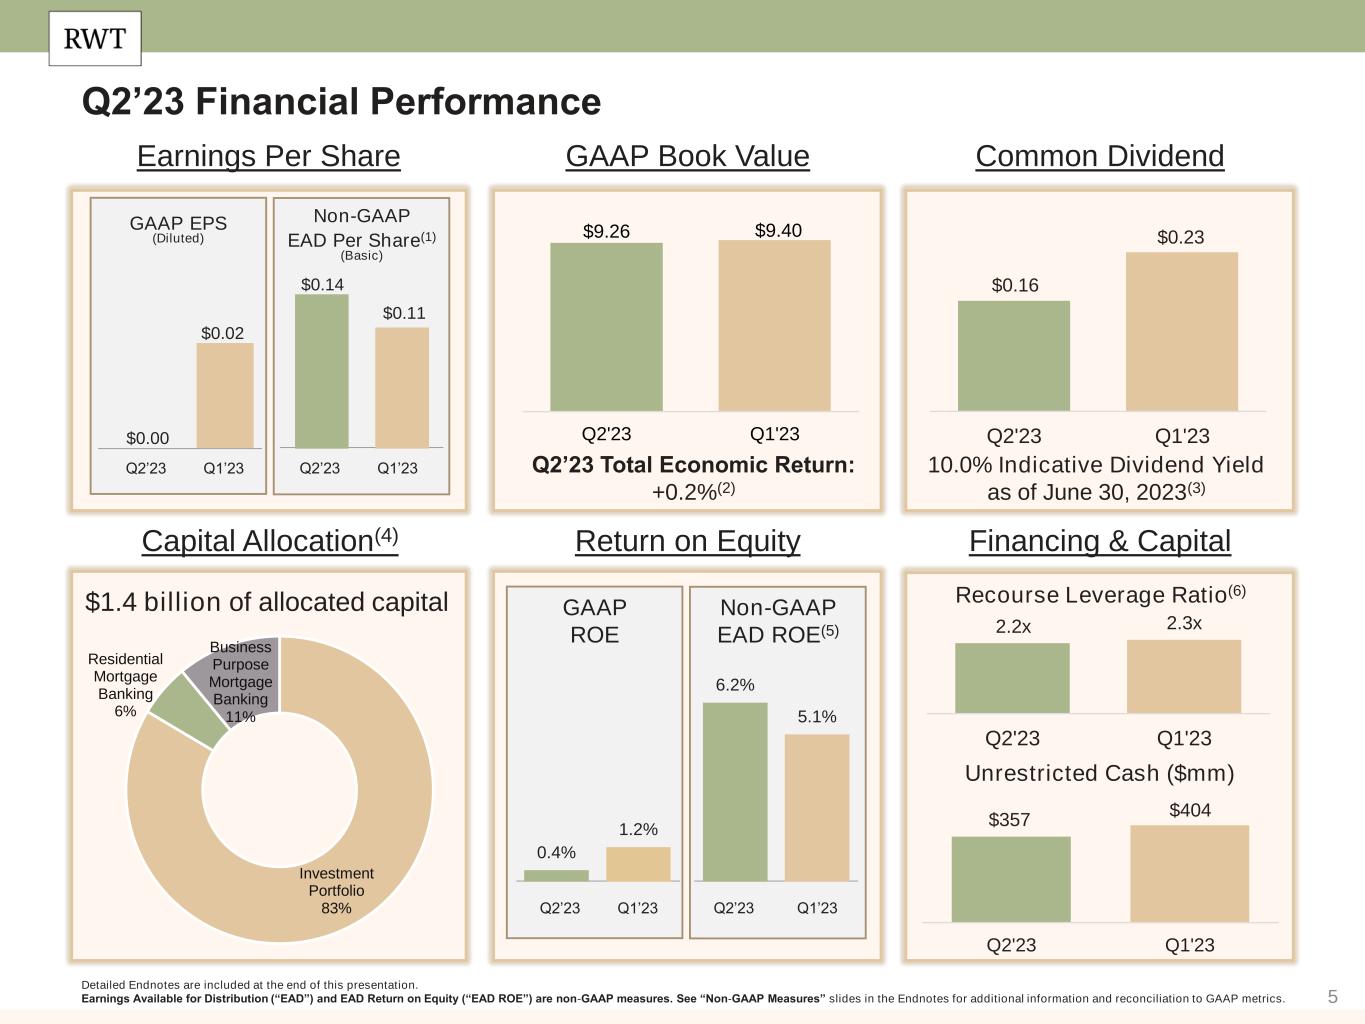
5 Q2’23 Financial Performance $1.4 billion of allocated capital Detailed Endnotes are included at the end of this presentation. Earnings Available for Distribution (“EAD”) and EAD Return on Equity (“EAD ROE”) are non-GAAP measures. See “Non-GAAP Measures” slides in the Endnotes for additional information and reconciliation to GAAP metrics. Earnings Per Share GAAP Book Value Common Dividend Capital Allocation(4) Return on Equity Financing & Capital Recourse Leverage Ratio(6) Unrestricted Cash ($mm) Q2’23 Total Economic Return: +0.2%(2) 10.0% Indicative Dividend Yield as of June 30, 2023(3) GAAP ROE Non-GAAP EAD ROE(5) GAAP EPS (Diluted) Non-GAAP EAD Per Share(1) (Basic) $9.26 $9.40 Q2'23 Q1'23 $0.16 $0.23 Q2'23 Q1'23 Investment Portfolio 83% Residential Mortgage Banking 6% Business Purpose Mortgage Banking 11% $0.14 $0.11 $0.00 $0.02 2.2x 2.3x Q2'23 Q1'23 $357 $404 Q2'23 Q1'23 Q2’23 Q1’23 Q2’23 Q1’23 0.4% 6.2% 1.2% 5.1% Q2’23 Q1’23 Q2’23 Q1’23
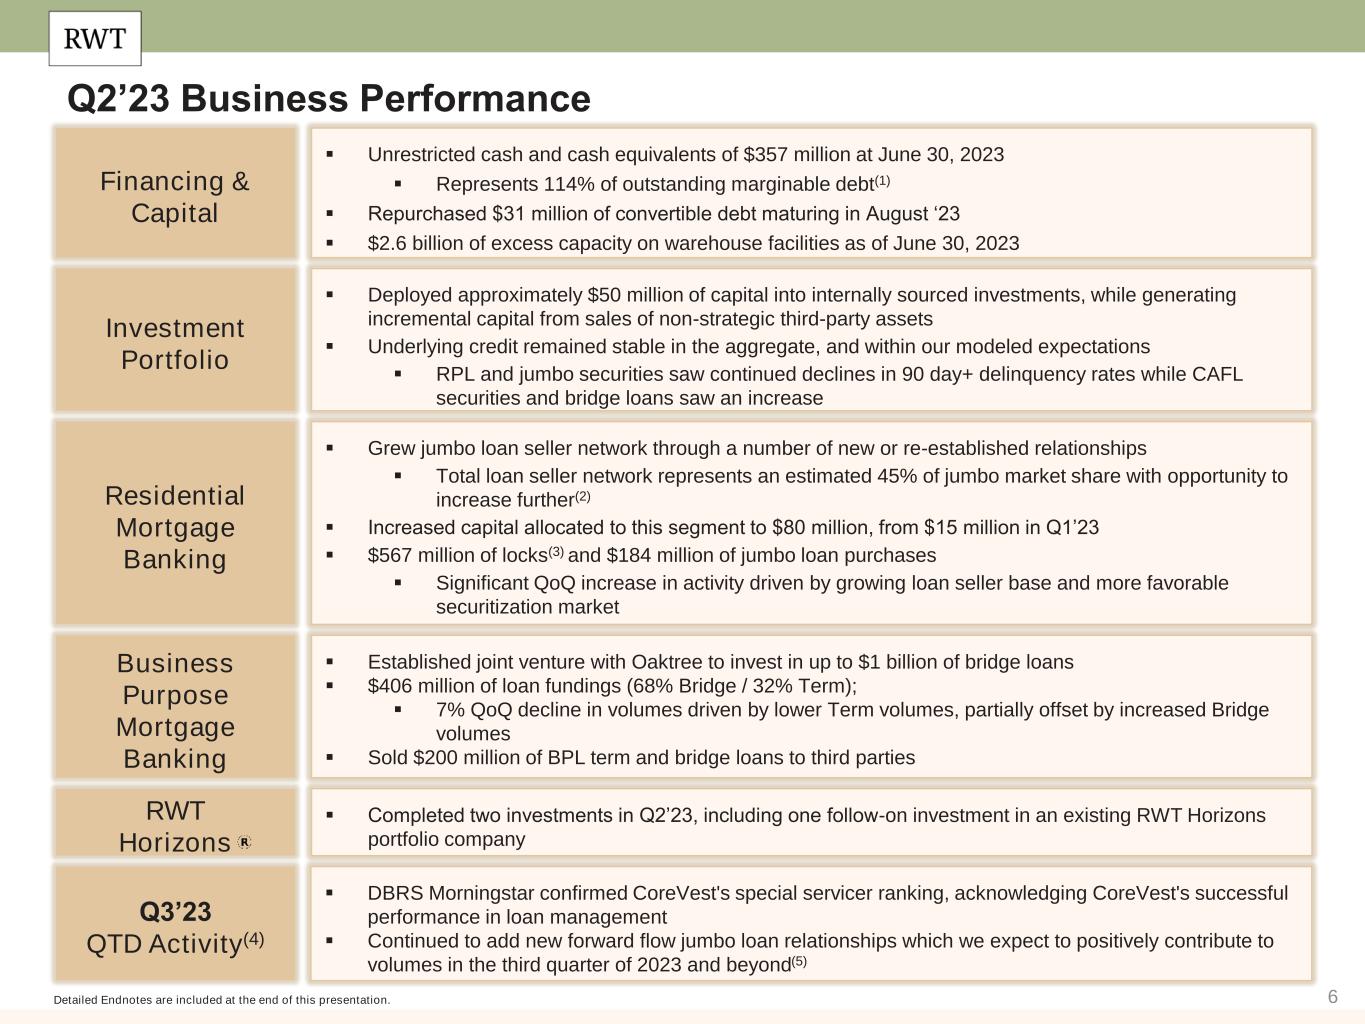
6 Q2’23 Business Performance Detailed Endnotes are included at the end of this presentation. ▪ Grew jumbo loan seller network through a number of new or re-established relationships ▪ Total loan seller network represents an estimated 45% of jumbo market share with opportunity to increase further(2) ▪ Increased capital allocated to this segment to $80 million, from $15 million in Q1’23 ▪ $567 million of locks(3) and $184 million of jumbo loan purchases ▪ Significant QoQ increase in activity driven by growing loan seller base and more favorable securitization market Residential Mortgage Banking ▪ Completed two investments in Q2’23, including one follow-on investment in an existing RWT Horizons portfolio company RWT Horizons ▪ Deployed approximately $50 million of capital into internally sourced investments, while generating incremental capital from sales of non-strategic third-party assets ▪ Underlying credit remained stable in the aggregate, and within our modeled expectations ▪ RPL and jumbo securities saw continued declines in 90 day+ delinquency rates while CAFL securities and bridge loans saw an increase Investment Portfolio ▪ Unrestricted cash and cash equivalents of $357 million at June 30, 2023 ▪ Represents 114% of outstanding marginable debt(1) ▪ Repurchased $31 million of convertible debt maturing in August ‘23 ▪ $2.6 billion of excess capacity on warehouse facilities as of June 30, 2023 Financing & Capital ▪ DBRS Morningstar confirmed CoreVest's special servicer ranking, acknowledging CoreVest's successful performance in loan management ▪ Continued to add new forward flow jumbo loan relationships which we expect to positively contribute to volumes in the third quarter of 2023 and beyond(5) Q3’23 QTD Activity(4) ▪ Established joint venture with Oaktree to invest in up to $1 billion of bridge loans ▪ $406 million of loan fundings (68% Bridge / 32% Term); ▪ 7% QoQ decline in volumes driven by lower Term volumes, partially offset by increased Bridge volumes ▪ Sold $200 million of BPL term and bridge loans to third parties Business Purpose Mortgage Banking
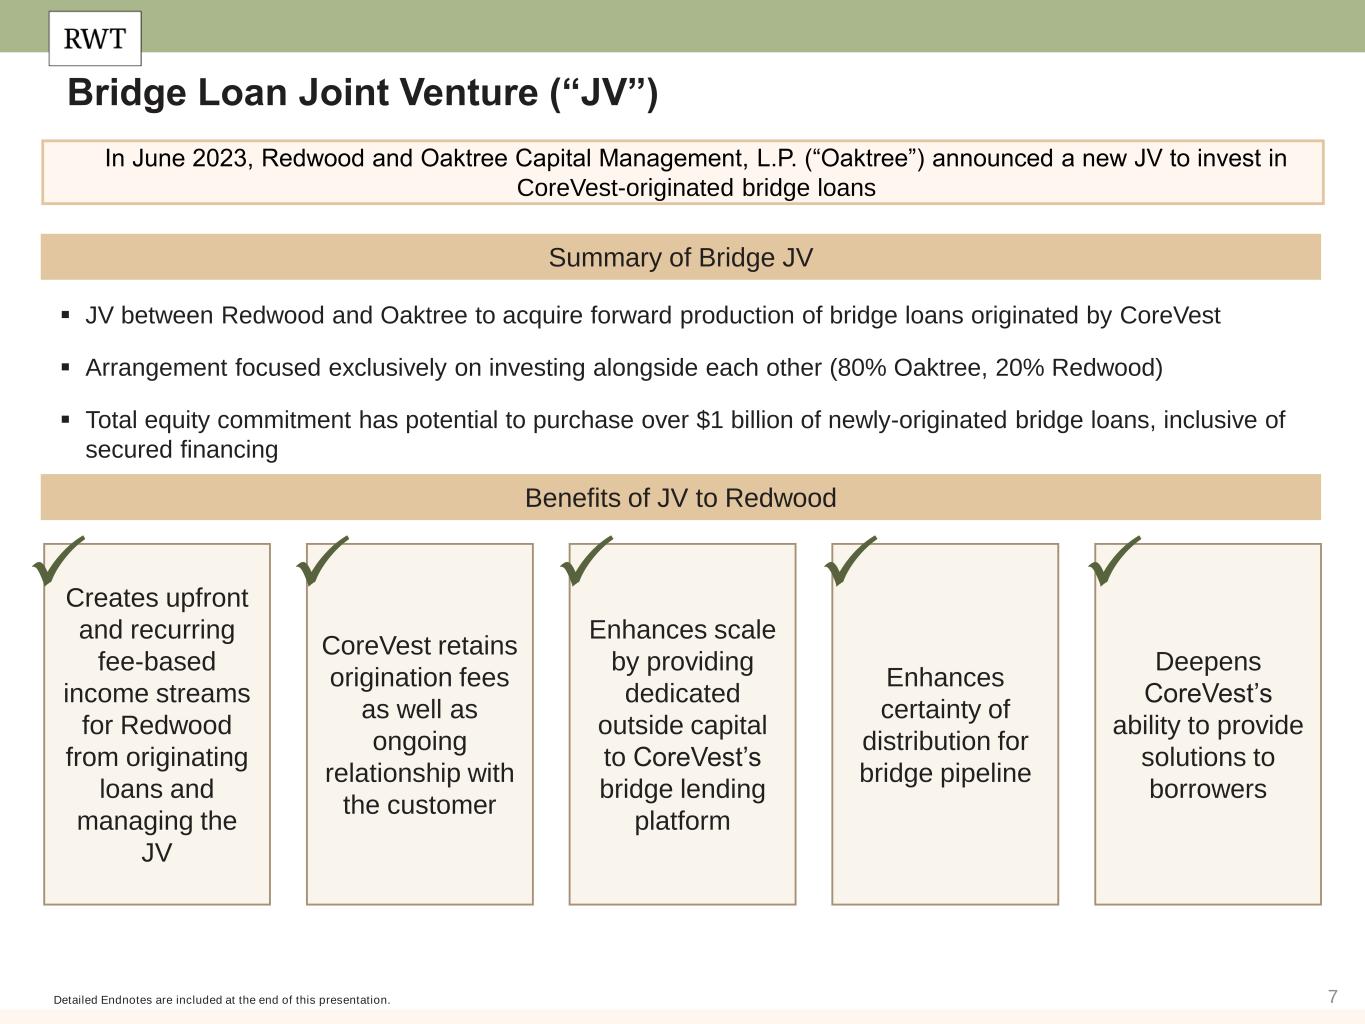
7 Bridge Loan Joint Venture (“JV”) Detailed Endnotes are included at the end of this presentation. Benefits of JV to Redwood Summary of Bridge JV ▪ JV between Redwood and Oaktree to acquire forward production of bridge loans originated by CoreVest ▪ Arrangement focused exclusively on investing alongside each other (80% Oaktree, 20% Redwood) ▪ Total equity commitment has potential to purchase over $1 billion of newly-originated bridge loans, inclusive of secured financing In June 2023, Redwood and Oaktree Capital Management, L.P. (“Oaktree”) announced a new JV to invest in CoreVest-originated bridge loans Creates upfront and recurring fee-based income streams for Redwood from originating loans and managing the JV CoreVest retains origination fees as well as ongoing relationship with the customer Enhances scale by providing dedicated outside capital to CoreVest’s bridge lending platform Enhances certainty of distribution for bridge pipeline Deepens CoreVest’s ability to provide solutions to borrowers P P P P P
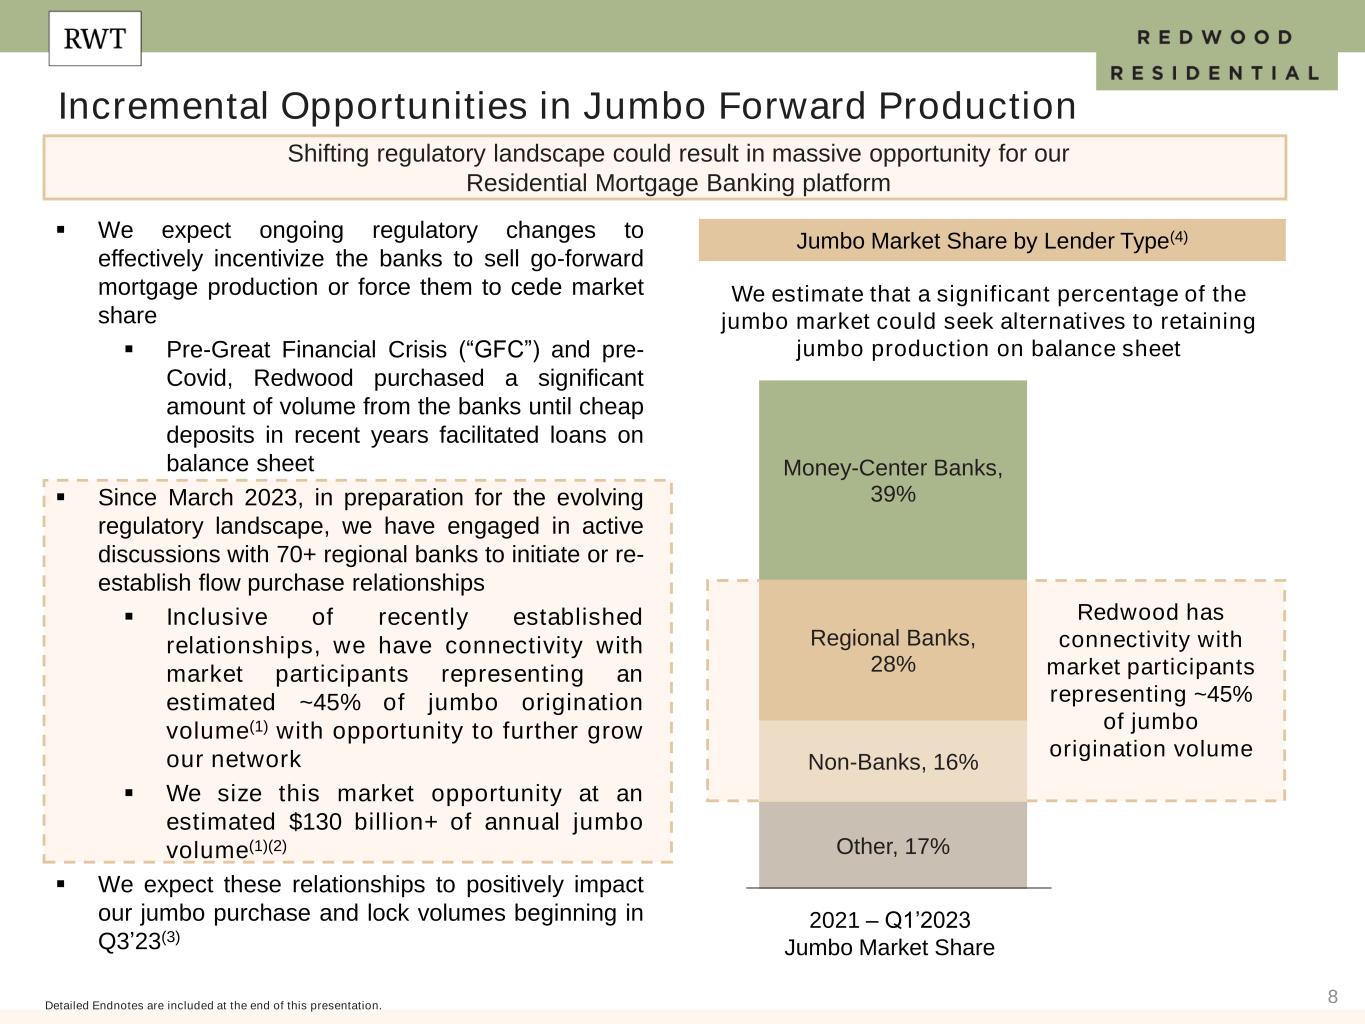
8 Incremental Opportunities in Jumbo Forward Production Detailed Endnotes are included at the end of this presentation. Shifting regulatory landscape could result in massive opportunity for our Residential Mortgage Banking platform Jumbo Market Share by Lender Type(4)▪ We expect ongoing regulatory changes to effectively incentivize the banks to sell go-forward mortgage production or force them to cede market share ▪ Pre-Great Financial Crisis (“GFC”) and pre- Covid, Redwood purchased a significant amount of volume from the banks until cheap deposits in recent years facilitated loans on balance sheet ▪ Since March 2023, in preparation for the evolving regulatory landscape, we have engaged in active discussions with 70+ regional banks to initiate or re- establish flow purchase relationships ▪ Inclusive of recently established relationships, we have connectivity with market participants representing an estimated ~45% of jumbo origination volume(1) with opportunity to further grow our network ▪ We size this market opportunity at an estimated $130 billion+ of annual jumbo volume(1)(2) ▪ We expect these relationships to positively impact our jumbo purchase and lock volumes beginning in Q3’23(3) Other, 17% Non-Banks, 16% Regional Banks, 28% Money-Center Banks, 39% 2021 – Q1’2023 Jumbo Market Share We estimate that a significant percentage of the jumbo market could seek alternatives to retaining jumbo production on balance sheet Redwood has connectivity with market participants representing ~45% of jumbo origination volume
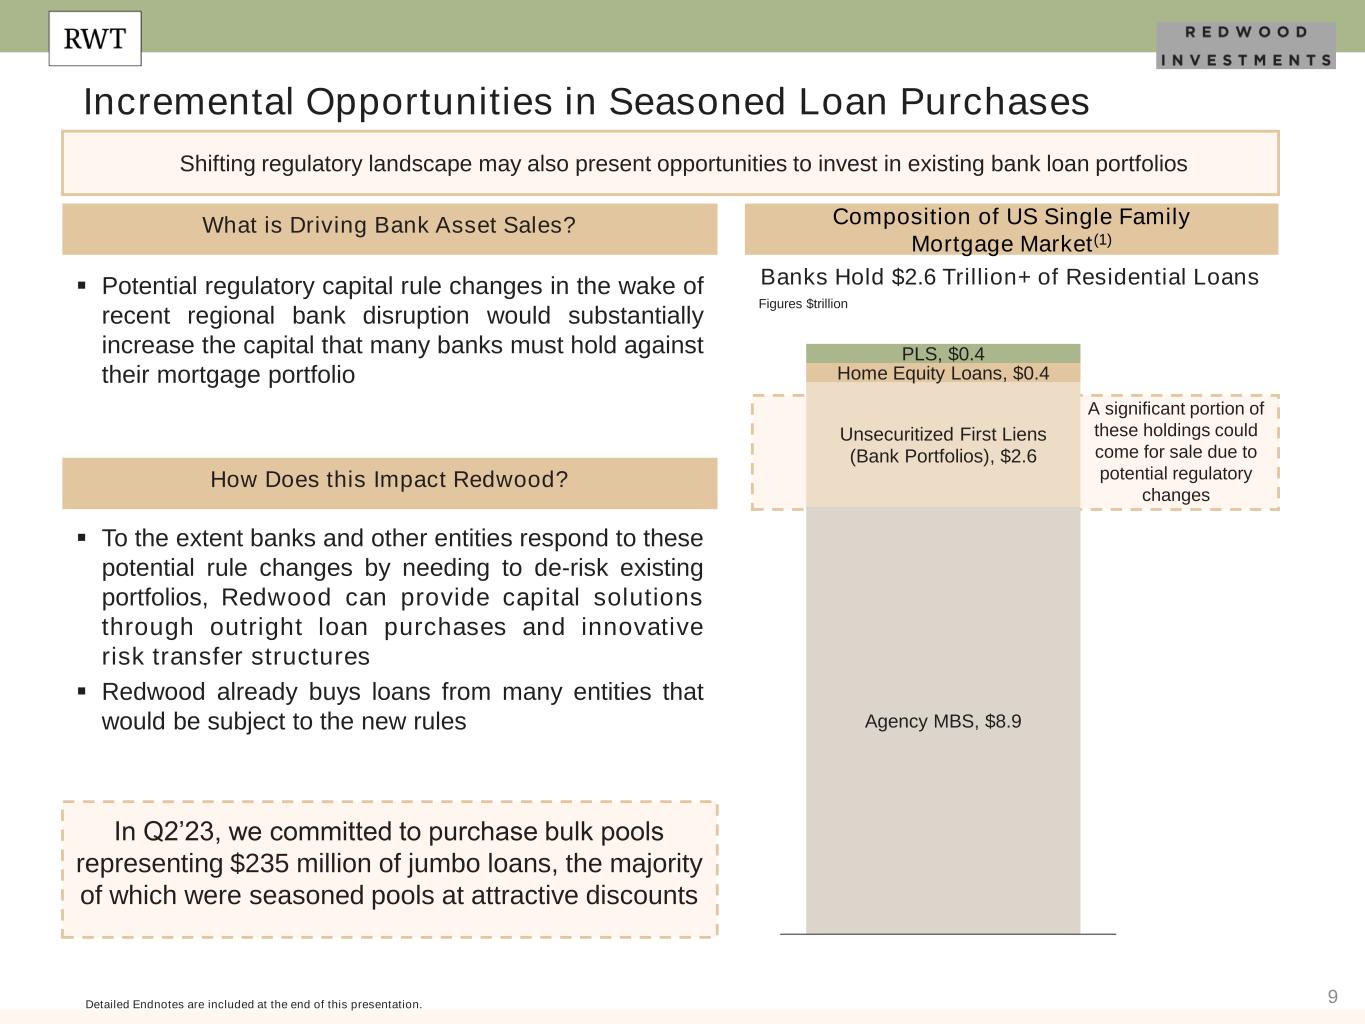
9 Agency MBS, $8.9 Unsecuritized First Liens (Bank Portfolios), $2.6 Home Equity Loans, $0.4 PLS, $0.4 Incremental Opportunities in Seasoned Loan Purchases Shifting regulatory landscape may also present opportunities to invest in existing bank loan portfolios Detailed Endnotes are included at the end of this presentation. ▪ Potential regulatory capital rule changes in the wake of recent regional bank disruption would substantially increase the capital that many banks must hold against their mortgage portfolio How Does this Impact Redwood? Banks Hold $2.6 Trillion+ of Residential Loans What is Driving Bank Asset Sales? ▪ To the extent banks and other entities respond to these potential rule changes by needing to de-risk existing portfolios, Redwood can provide capital solutions through outright loan purchases and innovative risk transfer structures ▪ Redwood already buys loans from many entities that would be subject to the new rules In Q2’23, we committed to purchase bulk pools representing $235 million of jumbo loans, the majority of which were seasoned pools at attractive discounts Figures $trillion Composition of US Single Family Mortgage Market(1) A significant portion of these holdings could come for sale due to potential regulatory changes
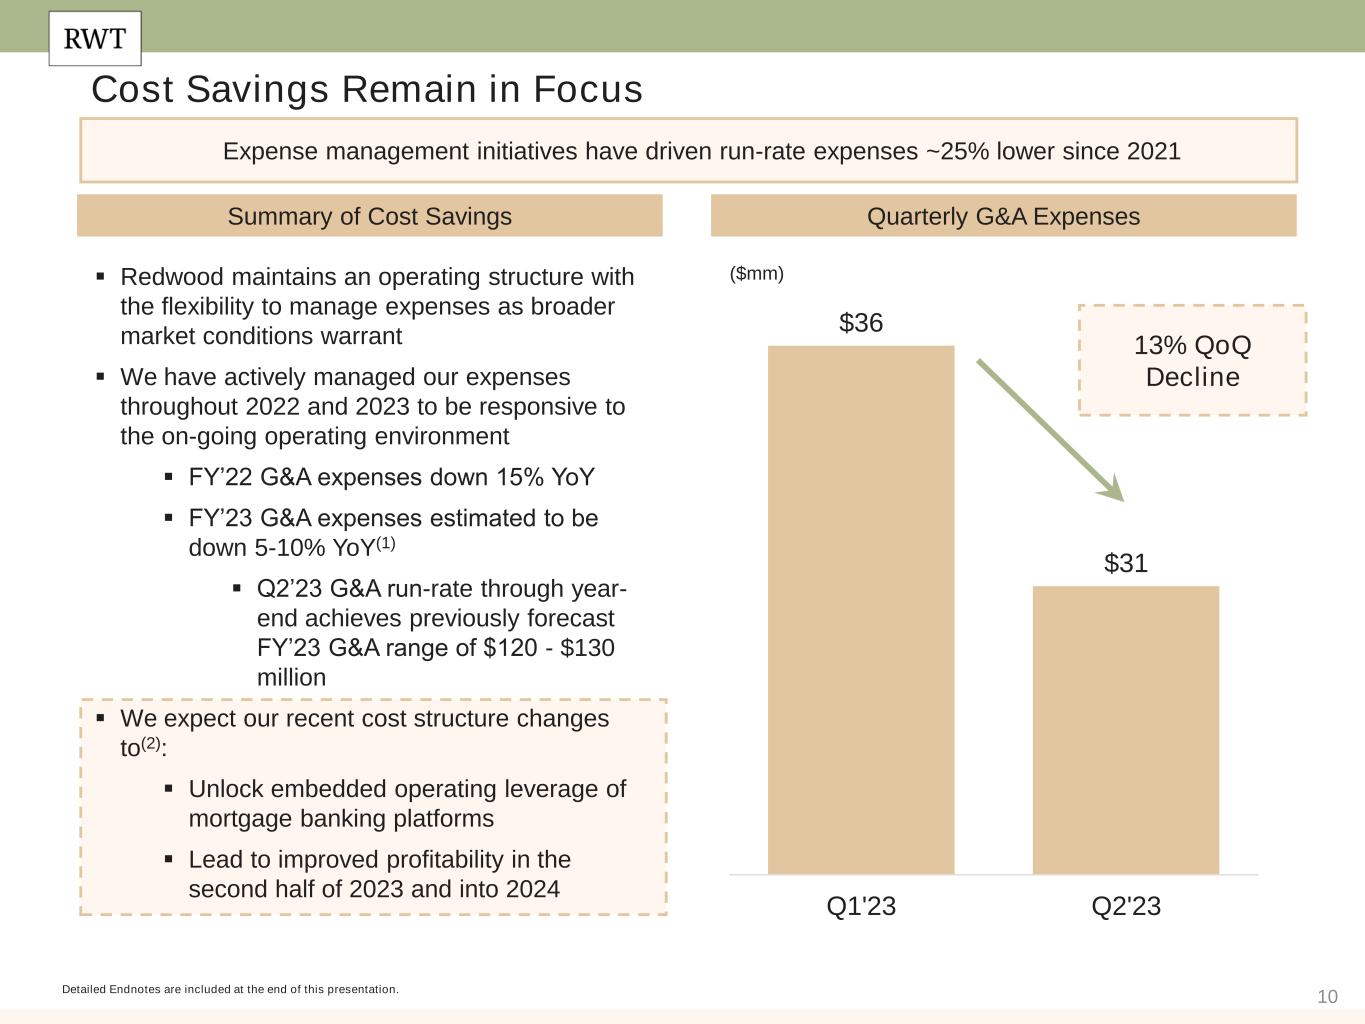
10 $36 $31 Q1'23 Q2'23 Cost Savings Remain in Focus Expense management initiatives have driven run-rate expenses ~25% lower since 2021 Detailed Endnotes are included at the end of this presentation. Quarterly G&A Expenses ($mm) Summary of Cost Savings 13% QoQ Decline ▪ Redwood maintains an operating structure with the flexibility to manage expenses as broader market conditions warrant ▪ We have actively managed our expenses throughout 2022 and 2023 to be responsive to the on-going operating environment ▪ FY’22 G&A expenses down 15% YoY ▪ FY’23 G&A expenses estimated to be down 5-10% YoY(1) ▪ Q2’23 G&A run-rate through year- end achieves previously forecast FY’23 G&A range of $120 - $130 million ▪ We expect our recent cost structure changes to(2): ▪ Unlock embedded operating leverage of mortgage banking platforms ▪ Lead to improved profitability in the second half of 2023 and into 2024
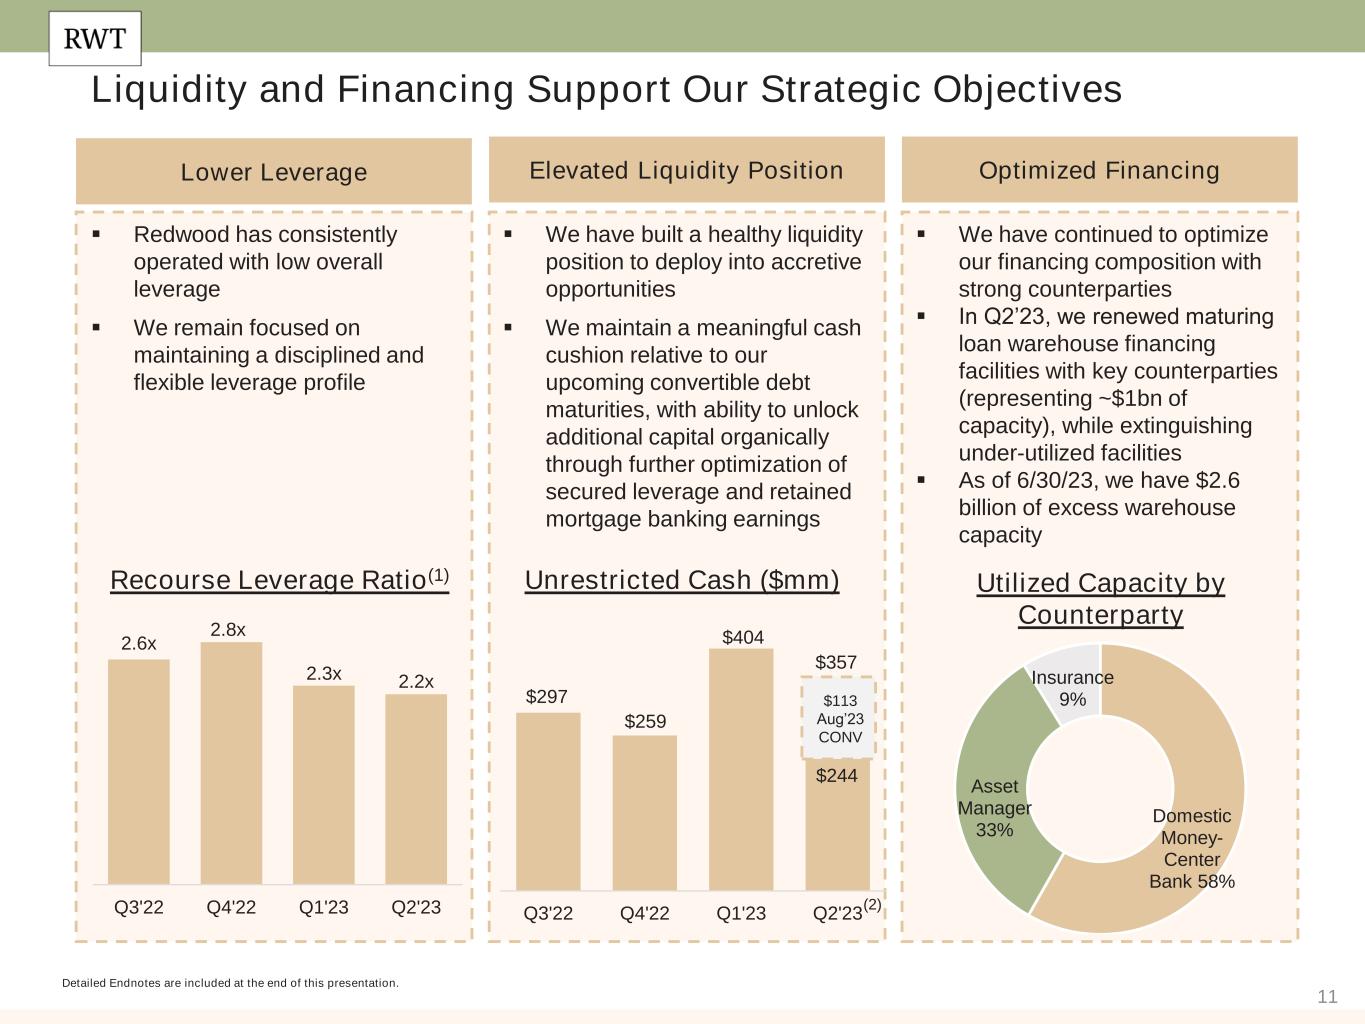
11 Liquidity and Financing Support Our Strategic Objectives Detailed Endnotes are included at the end of this presentation. Lower Leverage Optimized FinancingElevated Liquidity Position ▪ Redwood has consistently operated with low overall leverage ▪ We remain focused on maintaining a disciplined and flexible leverage profile ▪ We have built a healthy liquidity position to deploy into accretive opportunities ▪ We maintain a meaningful cash cushion relative to our upcoming convertible debt maturities, with ability to unlock additional capital organically through further optimization of secured leverage and retained mortgage banking earnings ▪ We have continued to optimize our financing composition with strong counterparties ▪ In Q2’23, we renewed maturing loan warehouse financing facilities with key counterparties (representing ~$1bn of capacity), while extinguishing under-utilized facilities ▪ As of 6/30/23, we have $2.6 billion of excess warehouse capacity Utilized Capacity by Counterparty Recourse Leverage Ratio(1) Unrestricted Cash ($mm) 2.6x 2.8x 2.3x 2.2x Q3'22 Q4'22 Q1'23 Q2'23 $297 $259 $404 $357 Q3'22 Q4'22 Q1'23 Q2'23 Domestic Money- Center Bank 58% Asset Manager 33% Insurance 9%$113 Aug’23 CONV $244 (2)

12 Operating Businesses & Investment Portfolio
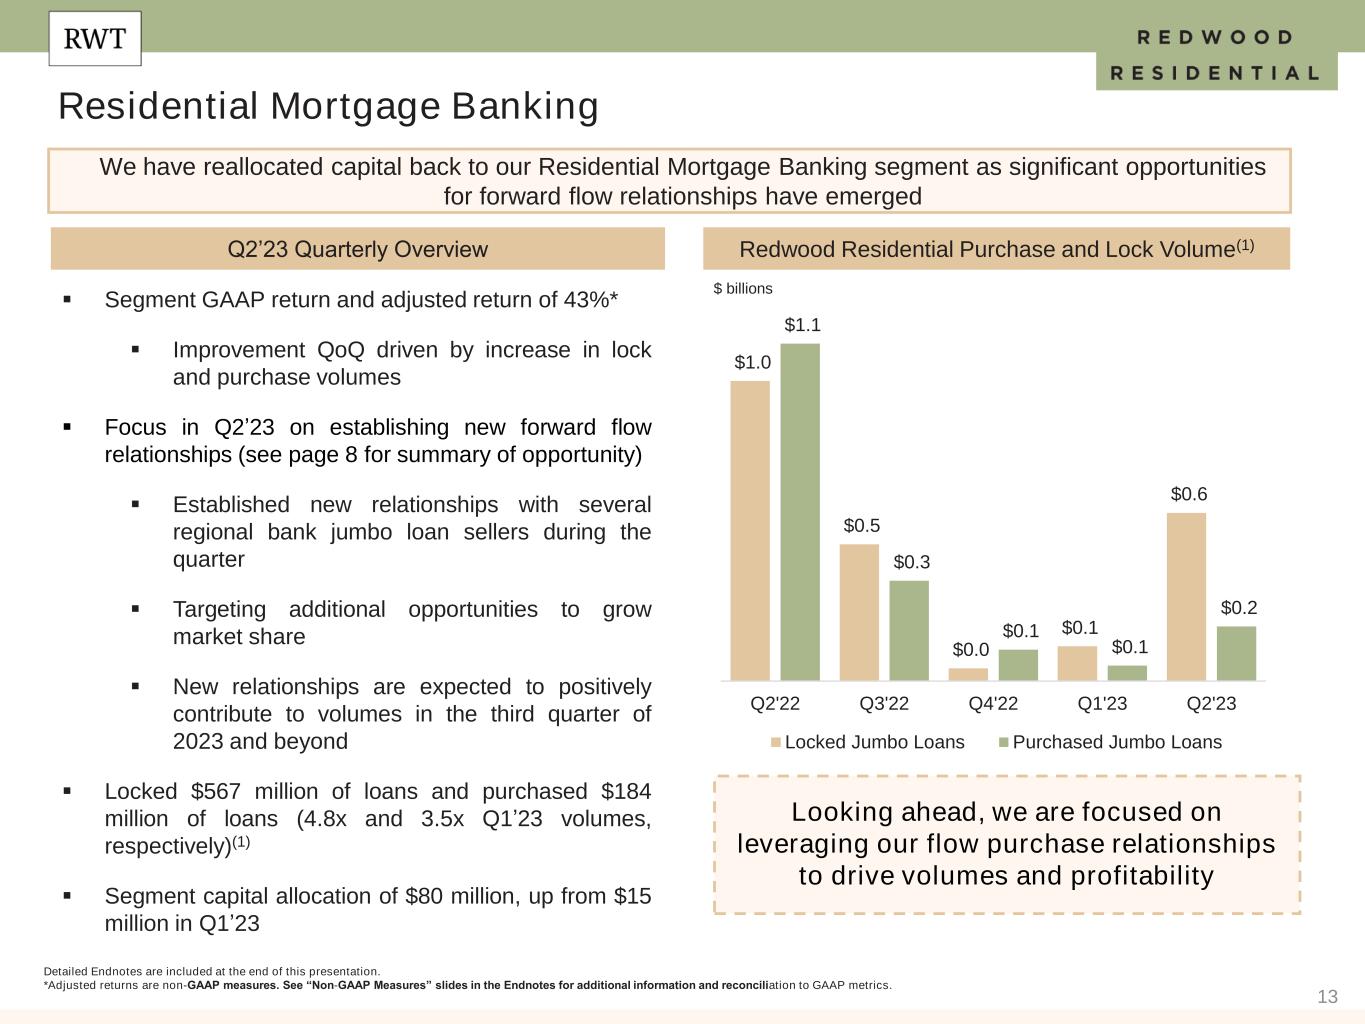
13 ▪ Segment GAAP return and adjusted return of 43%* ▪ Improvement QoQ driven by increase in lock and purchase volumes ▪ Focus in Q2’23 on establishing new forward flow relationships (see page 8 for summary of opportunity) ▪ Established new relationships with several regional bank jumbo loan sellers during the quarter ▪ Targeting additional opportunities to grow market share ▪ New relationships are expected to positively contribute to volumes in the third quarter of 2023 and beyond ▪ Locked $567 million of loans and purchased $184 million of loans (4.8x and 3.5x Q1’23 volumes, respectively)(1) ▪ Segment capital allocation of $80 million, up from $15 million in Q1’23 Residential Mortgage Banking Q2’23 Quarterly Overview We have reallocated capital back to our Residential Mortgage Banking segment as significant opportunities for forward flow relationships have emerged $ billions Looking ahead, we are focused on leveraging our flow purchase relationships to drive volumes and profitability Redwood Residential Purchase and Lock Volume(1) $1.0 $0.5 $0.0 $0.1 $0.6 $1.1 $0.3 $0.1 $0.1 $0.2 Q2'22 Q3'22 Q4'22 Q1'23 Q2'23 Locked Jumbo Loans Purchased Jumbo Loans Detailed Endnotes are included at the end of this presentation. *Adjusted returns are non-GAAP measures. See “Non-GAAP Measures” slides in the Endnotes for additional information and reconciliation to GAAP metrics.
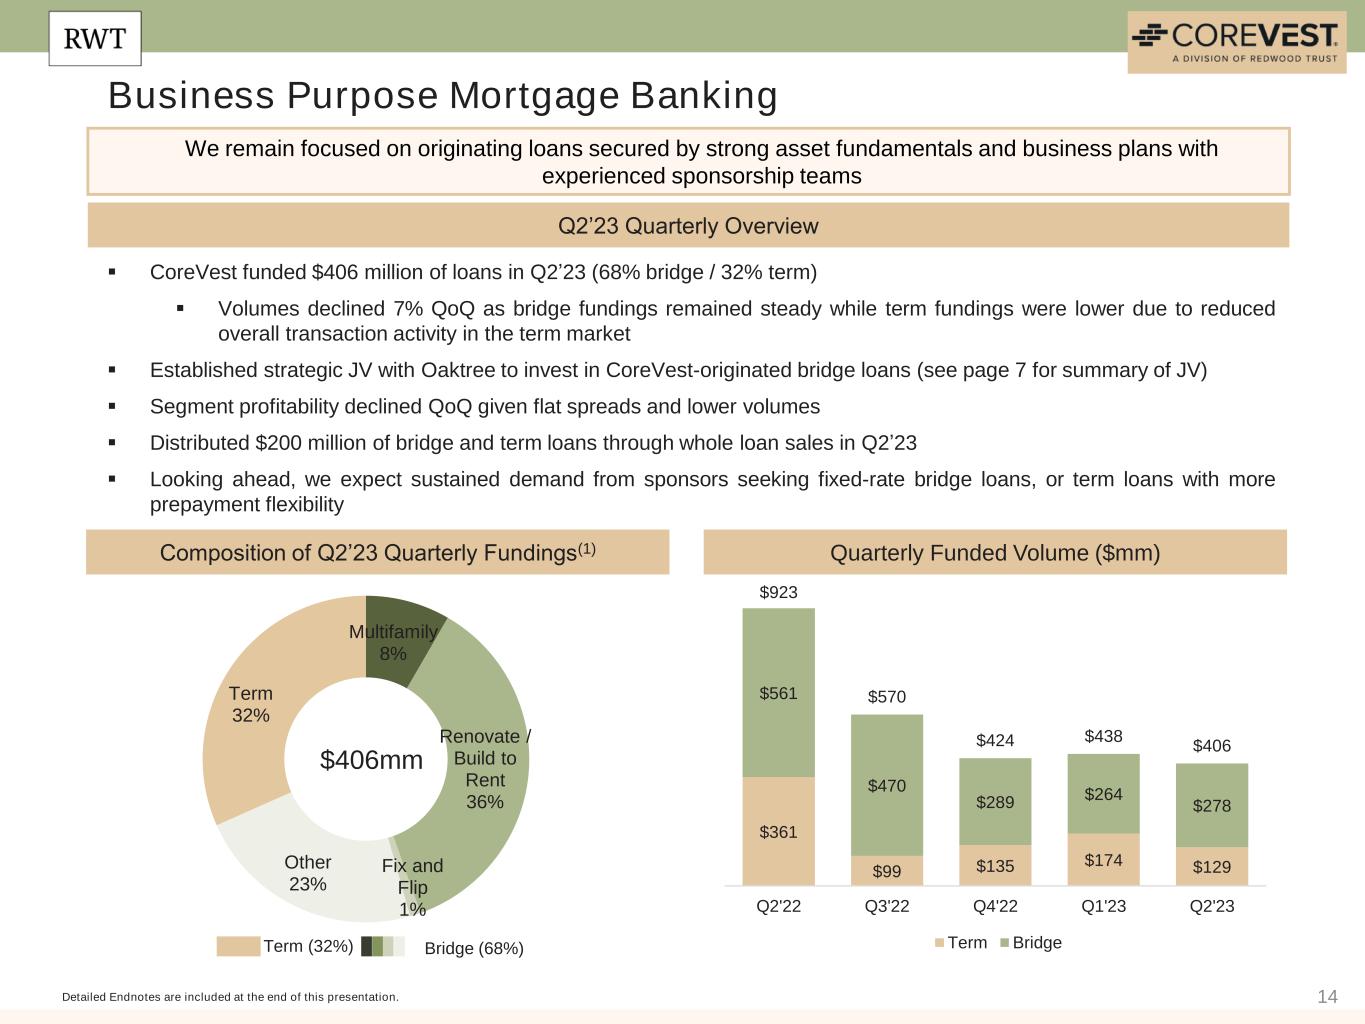
14 Business Purpose Mortgage Banking Q2’23 Quarterly Overview Composition of Q2’23 Quarterly Fundings(1) Detailed Endnotes are included at the end of this presentation. We remain focused on originating loans secured by strong asset fundamentals and business plans with experienced sponsorship teams Quarterly Funded Volume ($mm) Term (32%) Bridge (68%) ▪ CoreVest funded $406 million of loans in Q2’23 (68% bridge / 32% term) ▪ Volumes declined 7% QoQ as bridge fundings remained steady while term fundings were lower due to reduced overall transaction activity in the term market ▪ Established strategic JV with Oaktree to invest in CoreVest-originated bridge loans (see page 7 for summary of JV) ▪ Segment profitability declined QoQ given flat spreads and lower volumes ▪ Distributed $200 million of bridge and term loans through whole loan sales in Q2’23 ▪ Looking ahead, we expect sustained demand from sponsors seeking fixed-rate bridge loans, or term loans with more prepayment flexibility $406mm $361 $99 $135 $174 $129 $561 $470 $289 $264 $278 $923 $570 $424 $438 $406 Q2'22 Q3'22 Q4'22 Q1'23 Q2'23 Term Bridge Multifamily 8% Renovate / Build to Rent 36% Fix and Flip 1% Other 23% Term 32%
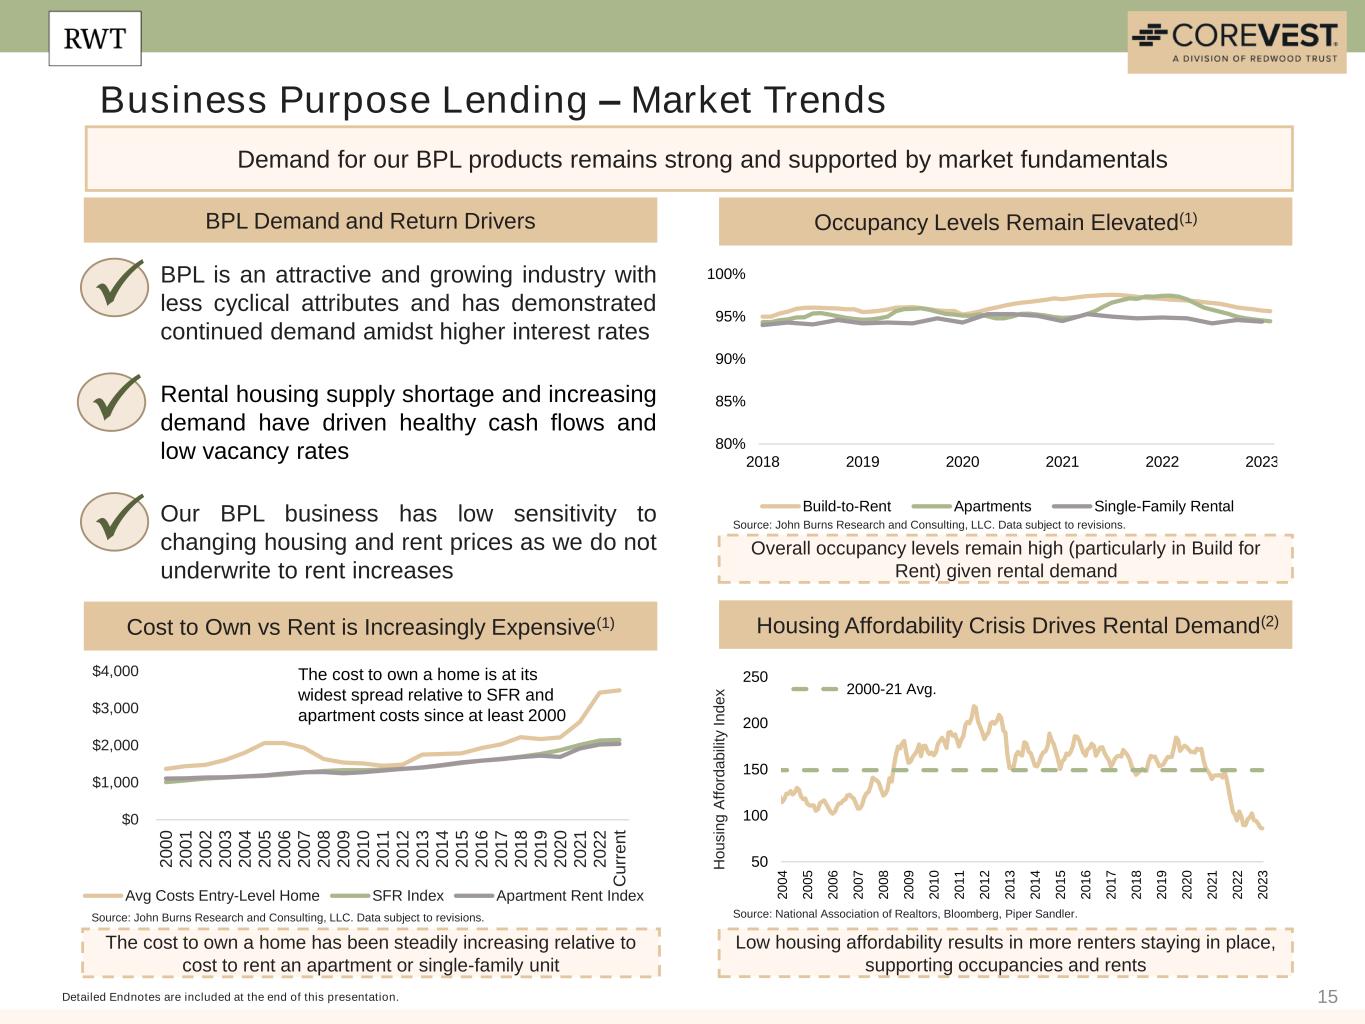
15 Business Purpose Lending – Market Trends Detailed Endnotes are included at the end of this presentation. Demand for our BPL products remains strong and supported by market fundamentals BPL Demand and Return Drivers Housing Affordability Crisis Drives Rental Demand(2) Occupancy Levels Remain Elevated(1) Cost to Own vs Rent is Increasingly Expensive(1) Overall occupancy levels remain high (particularly in Build for Rent) given rental demand Low housing affordability results in more renters staying in place, supporting occupancies and rents The cost to own a home has been steadily increasing relative to cost to rent an apartment or single-family unit 50 100 150 200 250 2 0 0 4 2 0 0 5 2 0 0 6 2 0 0 7 2 0 0 8 2 0 0 9 2 0 1 0 2 0 1 1 2 0 1 2 2 0 1 3 2 0 1 4 2 0 1 5 2 0 1 6 2 0 1 7 2 0 1 8 2 0 1 9 2 0 2 0 2 0 2 1 2 0 2 2 2 0 2 3 2000-21 Avg. H o u s in g A ff o rd a b ili ty I n d e x $0 $1,000 $2,000 $3,000 $4,000 2 0 0 0 2 0 0 1 2 0 0 2 2 0 0 3 2 0 0 4 2 0 0 5 2 0 0 6 2 0 0 7 2 0 0 8 2 0 0 9 2 0 1 0 2 0 1 1 2 0 1 2 2 0 1 3 2 0 1 4 2 0 1 5 2 0 1 6 2 0 1 7 2 0 1 8 2 0 1 9 2 0 2 0 2 0 2 1 2 0 2 2 C u rr e n t Avg Costs Entry-Level Home SFR Index Apartment Rent Index 80% 85% 90% 95% 100% 2018 2019 2020 2021 2022 2023 Build-to-Rent Apartments Single-Family Rental The cost to own a home is at its widest spread relative to SFR and apartment costs since at least 2000 Source: John Burns Research and Consulting, LLC. Data subject to revisions. Source: John Burns Research and Consulting, LLC. Data subject to revisions. Source: National Association of Realtors, Bloomberg, Piper Sandler. BPL is an attractive and growing industry with less cyclical attributes and has demonstrated continued demand amidst higher interest rates Rental housing supply shortage and increasing demand have driven healthy cash flows and low vacancy rates Our BPL business has low sensitivity to changing housing and rent prices as we do not underwrite to rent increases P P P
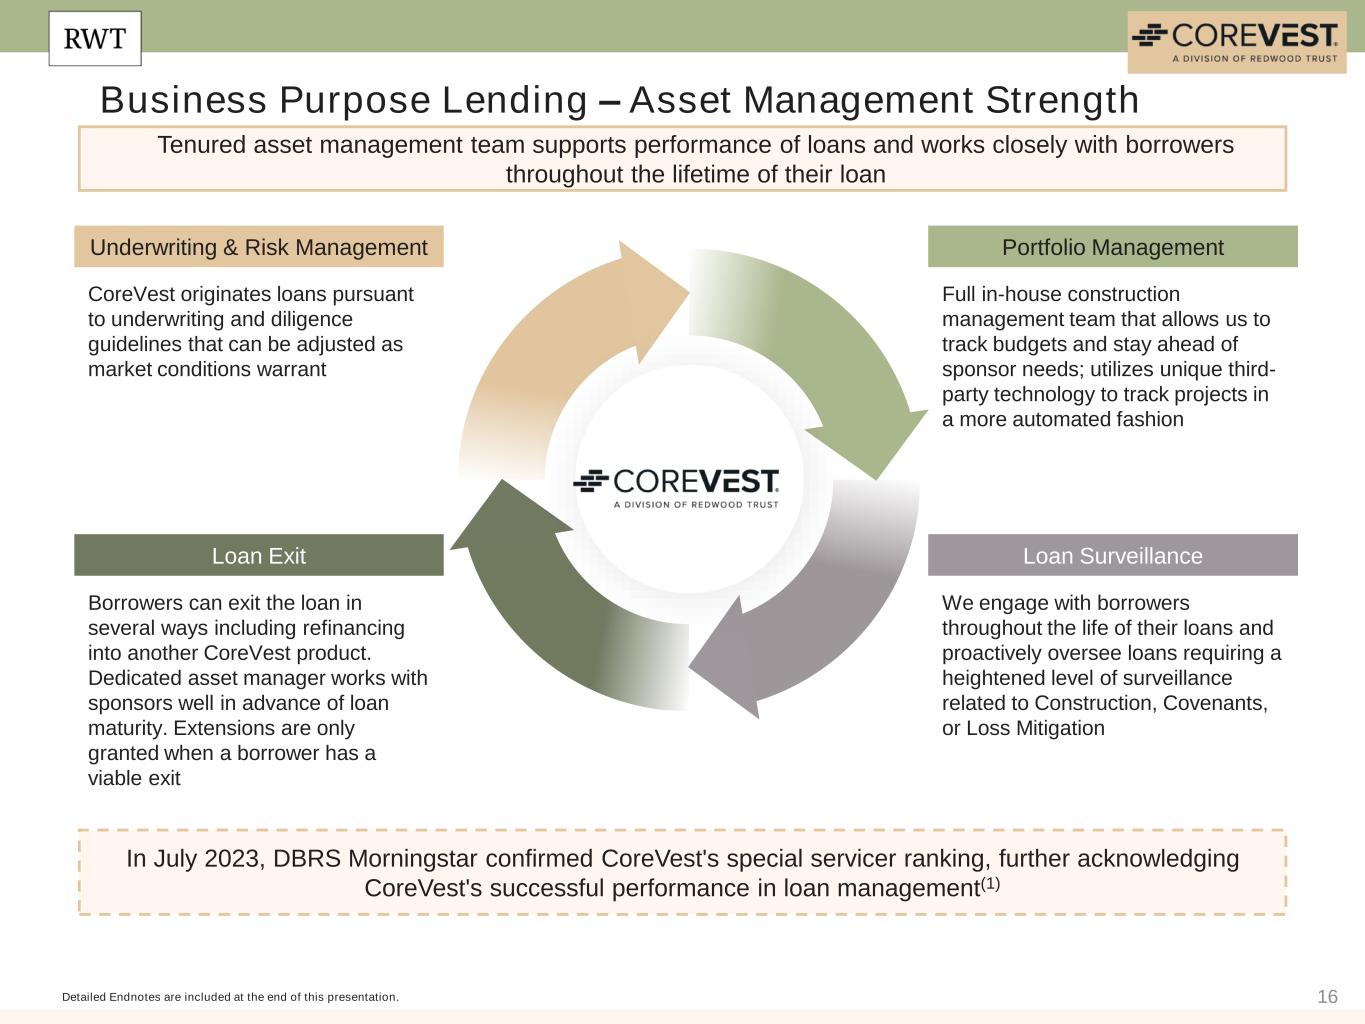
16Detailed Endnotes are included at the end of this presentation. Tenured asset management team supports performance of loans and works closely with borrowers throughout the lifetime of their loan In July 2023, DBRS Morningstar confirmed CoreVest's special servicer ranking, further acknowledging CoreVest's successful performance in loan management(1) Business Purpose Lending – Asset Management Strength Underwriting & Risk Management CoreVest originates loans pursuant to underwriting and diligence guidelines that can be adjusted as market conditions warrant Portfolio Management Full in-house construction management team that allows us to track budgets and stay ahead of sponsor needs; utilizes unique third- party technology to track projects in a more automated fashion Loan Exit Borrowers can exit the loan in several ways including refinancing into another CoreVest product. Dedicated asset manager works with sponsors well in advance of loan maturity. Extensions are only granted when a borrower has a viable exit Loan Surveillance We engage with borrowers throughout the life of their loans and proactively oversee loans requiring a heightened level of surveillance related to Construction, Covenants, or Loss Mitigation
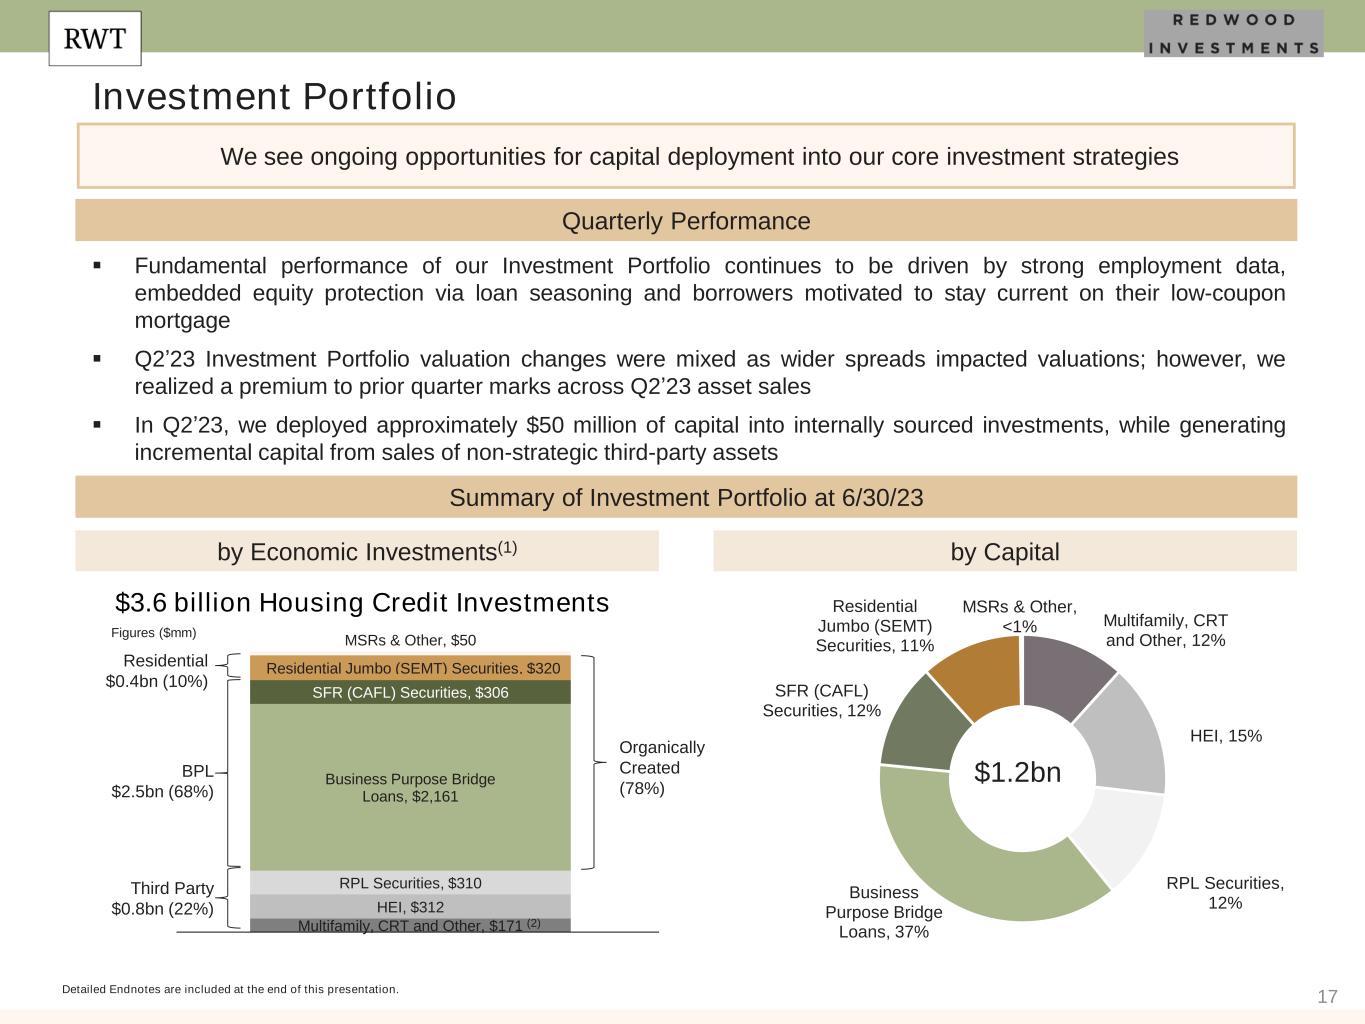
17 Multifamily, CRT and Other, $171 HEI, $312 RPL Securities, $310 Business Purpose Bridge Loans, $2,161 SFR (CAFL) Securities, $306 Residential Jumbo (SEMT) Securities, $320 MSRs & Other, $50 Investment Portfolio Quarterly Performance $3.6 billion Housing Credit Investments Organically Created (78%) Detailed Endnotes are included at the end of this presentation. We see ongoing opportunities for capital deployment into our core investment strategies $1.2bn Third Party $0.8bn (22%) BPL $2.5bn (68%) Residential $0.4bn (10%) Figures ($mm) Summary of Investment Portfolio at 6/30/23 by Economic Investments(1) by Capital (2) ▪ Fundamental performance of our Investment Portfolio continues to be driven by strong employment data, embedded equity protection via loan seasoning and borrowers motivated to stay current on their low-coupon mortgage ▪ Q2’23 Investment Portfolio valuation changes were mixed as wider spreads impacted valuations; however, we realized a premium to prior quarter marks across Q2’23 asset sales ▪ In Q2’23, we deployed approximately $50 million of capital into internally sourced investments, while generating incremental capital from sales of non-strategic third-party assets Multifamily, CRT and Other, 12% HEI, 15% RPL Securities, 12% Business Purpose Bridge Loans, 37% SFR (CAFL) Securities, 12% Residential Jumbo (SEMT) Securities, 11% MSRs & Other, <1%
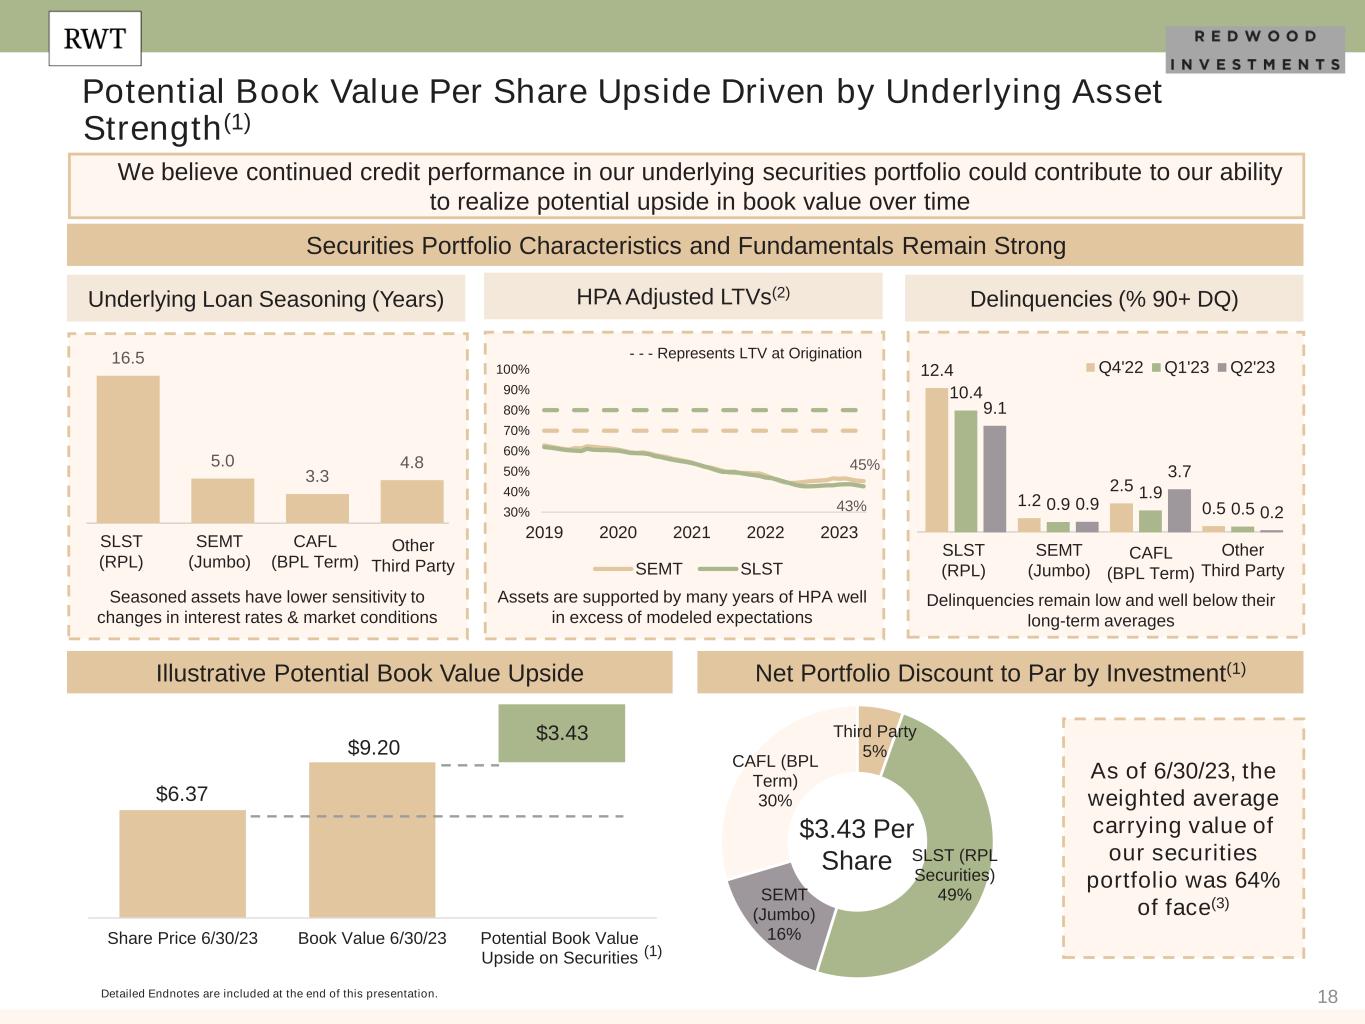
18 $6.37 $9.20 $3.43 Share Price 6/30/23 Book Value 6/30/23 Potential Book Value Upside on Securities (1) Net Portfolio Discount to Par by Investment(1) $3.43 Per Share Illustrative Potential Book Value Upside Detailed Endnotes are included at the end of this presentation. Potential Book Value Per Share Upside Driven by Underlying Asset Strength(1) As of 6/30/23, the weighted average carrying value of our securities portfolio was 64% of face(3) We believe continued credit performance in our underlying securities portfolio could contribute to our ability to realize potential upside in book value over time Delinquencies (% 90+ DQ)HPA Adjusted LTVs(2) Securities Portfolio Characteristics and Fundamentals Remain Strong SLST (RPL) SEMT (Jumbo) CAFL (BPL Term) Other Third Party Underlying Loan Seasoning (Years) Assets are supported by many years of HPA well in excess of modeled expectations Delinquencies remain low and well below their long-term averages Seasoned assets have lower sensitivity to changes in interest rates & market conditions SLST (RPL) SEMT (Jumbo) CAFL (BPL Term) Other Third Party - - - Represents LTV at Origination Third Party 5% SLST (RPL Securities) 49%SEMT (Jumbo) 16% CAFL (BPL Term) 30% 16.5 5.0 3.3 4.8 12.4 1.2 2.5 0.5 10.4 0.9 1.9 0.5 9.1 0.9 3.7 0.2 Q4'22 Q1'23 Q2'23 45% 43%30% 40% 50% 60% 70% 80% 90% 100% 2019 2020 2021 2022 2023 SEMT SLST
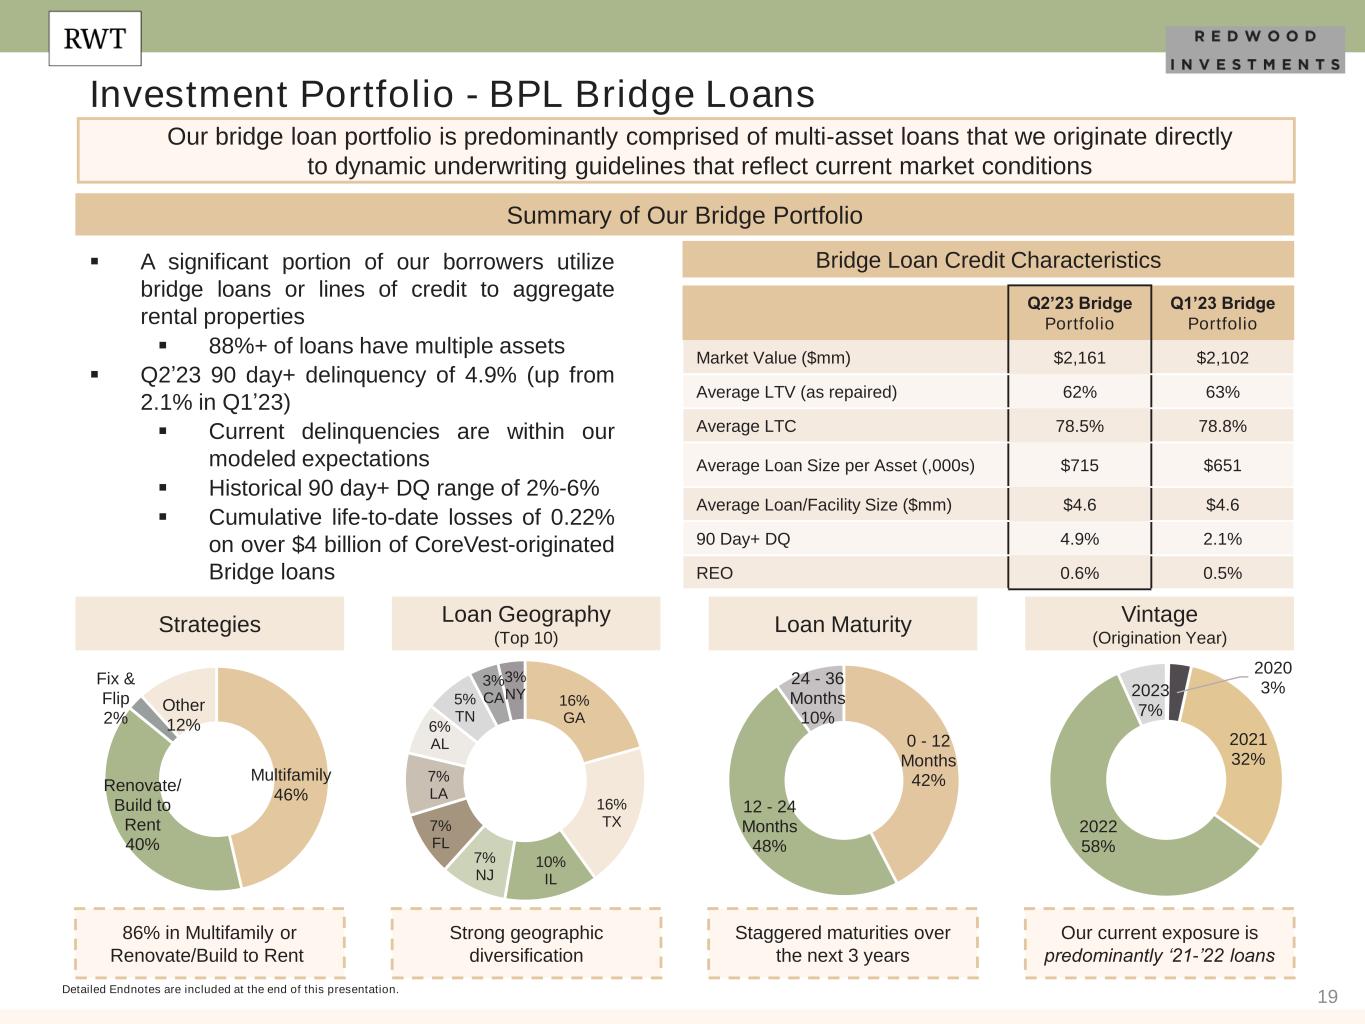
19 Investment Portfolio - BPL Bridge Loans Detailed Endnotes are included at the end of this presentation. Our bridge loan portfolio is predominantly comprised of multi-asset loans that we originate directly to dynamic underwriting guidelines that reflect current market conditions ▪ A significant portion of our borrowers utilize bridge loans or lines of credit to aggregate rental properties ▪ 88%+ of loans have multiple assets ▪ Q2’23 90 day+ delinquency of 4.9% (up from 2.1% in Q1’23) ▪ Current delinquencies are within our modeled expectations ▪ Historical 90 day+ DQ range of 2%-6% ▪ Cumulative life-to-date losses of 0.22% on over $4 billion of CoreVest-originated Bridge loans Vintage (Origination Year) Our current exposure is predominantly ‘21-’22 loans Loan Maturity Staggered maturities over the next 3 years Summary of Our Bridge Portfolio Bridge Loan Credit Characteristics Q2’23 Bridge Portfolio Q1’23 Bridge Portfolio Market Value ($mm) $2,161 $2,102 Average LTV (as repaired) 62% 63% Average LTC 78.5% 78.8% Average Loan Size per Asset (,000s) $715 $651 Average Loan/Facility Size ($mm) $4.6 $4.6 90 Day+ DQ 4.9% 2.1% REO 0.6% 0.5% Strategies Loan Geography (Top 10) Strong geographic diversification 86% in Multifamily or Renovate/Build to Rent Multifamily 46% Renovate/ Build to Rent 40% Fix & Flip 2% Other 12% 0 - 12 Months 42% 12 - 24 Months 48% 24 - 36 Months 10% 2020 3% 2021 32% 2022 58% 2023 7% 16% GA 16% TX 10% IL 7% NJ 7% FL 7% LA 6% AL 5% TN 3% CA 3% NY
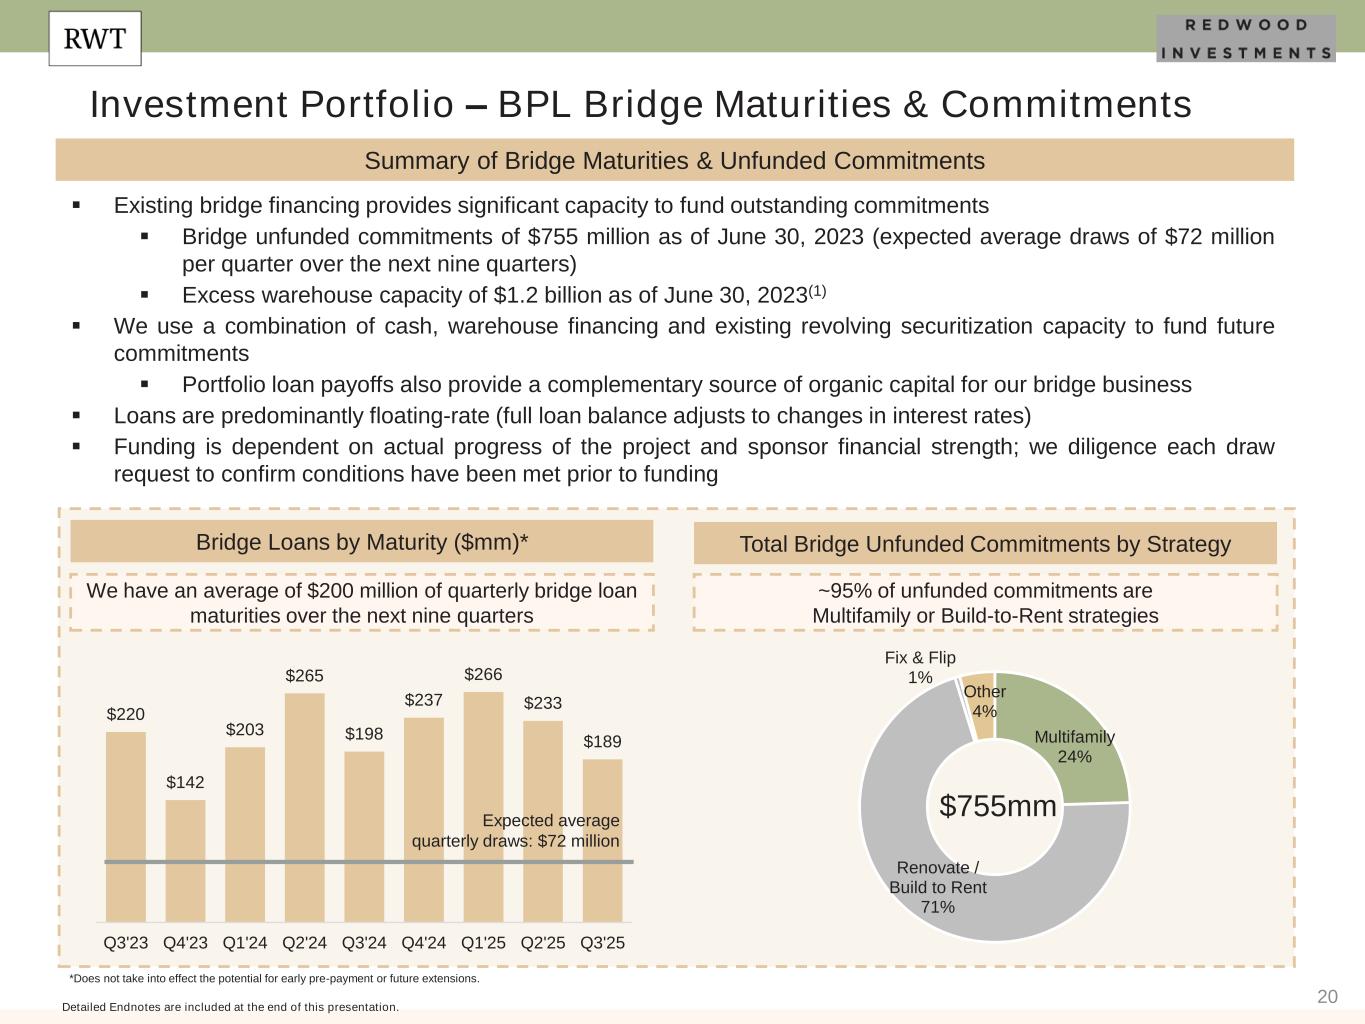
20 Investment Portfolio – BPL Bridge Maturities & Commitments Detailed Endnotes are included at the end of this presentation. Summary of Bridge Maturities & Unfunded Commitments ▪ Existing bridge financing provides significant capacity to fund outstanding commitments ▪ Bridge unfunded commitments of $755 million as of June 30, 2023 (expected average draws of $72 million per quarter over the next nine quarters) ▪ Excess warehouse capacity of $1.2 billion as of June 30, 2023(1) ▪ We use a combination of cash, warehouse financing and existing revolving securitization capacity to fund future commitments ▪ Portfolio loan payoffs also provide a complementary source of organic capital for our bridge business ▪ Loans are predominantly floating-rate (full loan balance adjusts to changes in interest rates) ▪ Funding is dependent on actual progress of the project and sponsor financial strength; we diligence each draw request to confirm conditions have been met prior to funding Bridge Loans by Maturity ($mm)* We have an average of $200 million of quarterly bridge loan maturities over the next nine quarters *Does not take into effect the potential for early pre-payment or future extensions. Total Bridge Unfunded Commitments by Strategy ~95% of unfunded commitments are Multifamily or Build-to-Rent strategies $755mm $220 $142 $203 $265 $198 $237 $266 $233 $189 Q3'23 Q4'23 Q1'24 Q2'24 Q3'24 Q4'24 Q1'25 Q2'25 Q3'25 Expected average quarterly draws: $72 million Multifamily 24% Renovate / Build to Rent 71% Fix & Flip 1% Other 4%
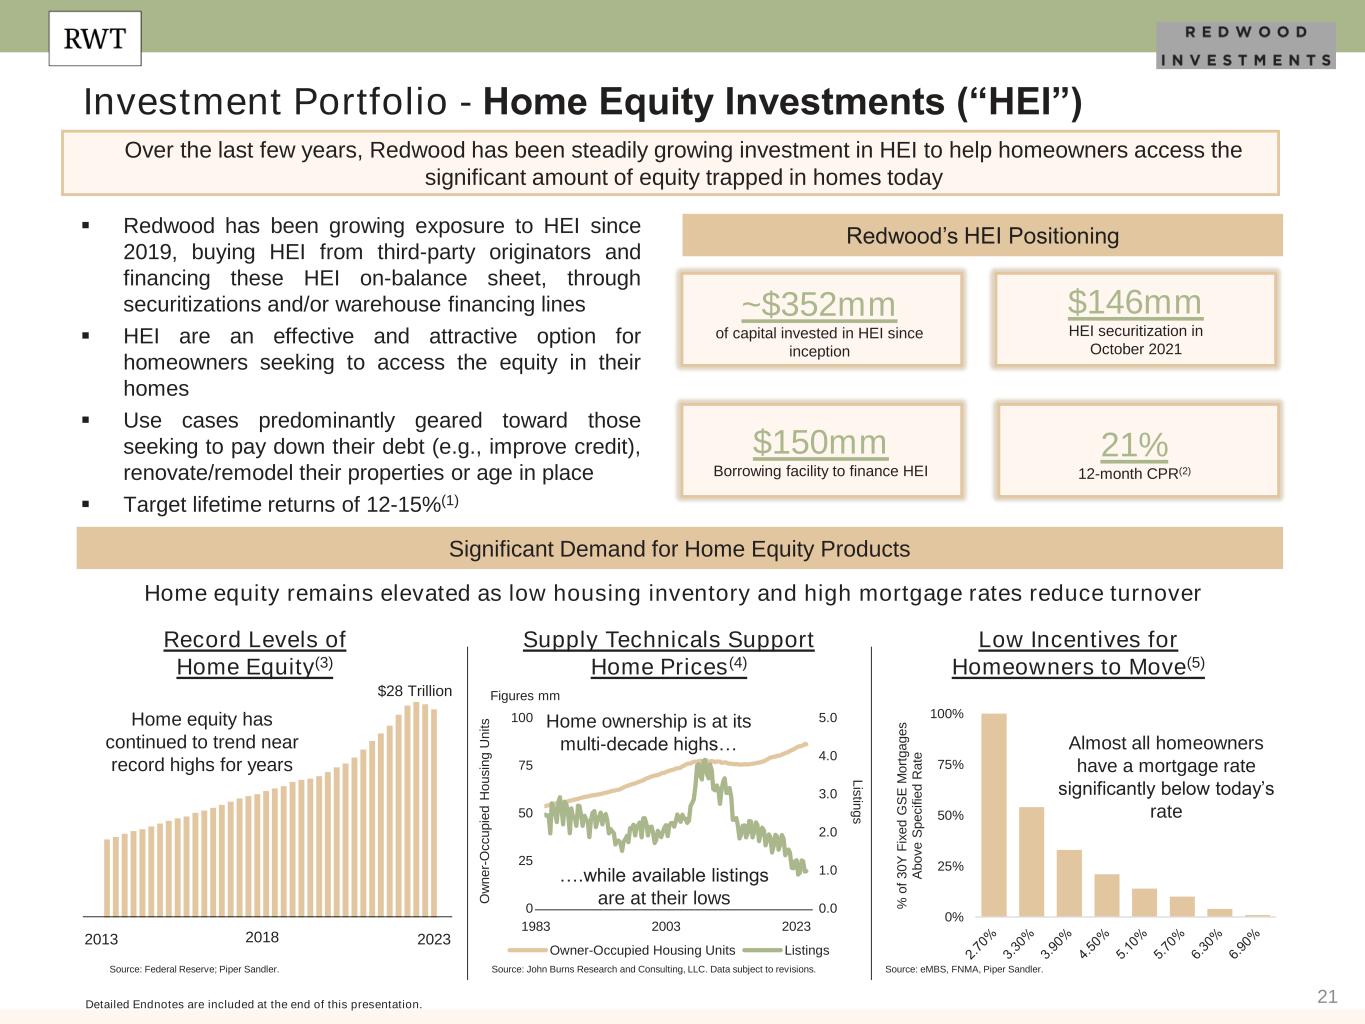
21 Investment Portfolio - Home Equity Investments (“HEI”) Over the last few years, Redwood has been steadily growing investment in HEI to help homeowners access the significant amount of equity trapped in homes today Detailed Endnotes are included at the end of this presentation. Significant Demand for Home Equity Products Redwood’s HEI Positioning Record Levels of Home Equity(3) Home equity has continued to trend near record highs for years $146mm HEI securitization in October 2021 21% 12-month CPR(2) ~$352mm of capital invested in HEI since inception $150mm Borrowing facility to finance HEI ▪ Redwood has been growing exposure to HEI since 2019, buying HEI from third-party originators and financing these HEI on-balance sheet, through securitizations and/or warehouse financing lines ▪ HEI are an effective and attractive option for homeowners seeking to access the equity in their homes ▪ Use cases predominantly geared toward those seeking to pay down their debt (e.g., improve credit), renovate/remodel their properties or age in place ▪ Target lifetime returns of 12-15%(1) Home equity remains elevated as low housing inventory and high mortgage rates reduce turnover $28 Trillion Low Incentives for Homeowners to Move(5) 2013 2018 2023 Supply Technicals Support Home Prices(4) Almost all homeowners have a mortgage rate significantly below today’s rate 0.0 1.0 2.0 3.0 4.0 5.0 0 25 50 75 100 Owner-Occupied Housing Units Listings Home ownership is at its multi-decade highs… 0% 25% 50% 75% 100% % o f 3 0 Y F ix e d G S E M o rt g a g e s A b o v e S p e c if ie d R a te Figures mm L is tin g s O w n e r- O c c u p ie d H o u s in g U n it s 1983 20232003 Source: John Burns Research and Consulting, LLC. Data subject to revisions.Source: Federal Reserve; Piper Sandler. Source: eMBS, FNMA, Piper Sandler. ….while available listings are at their lows
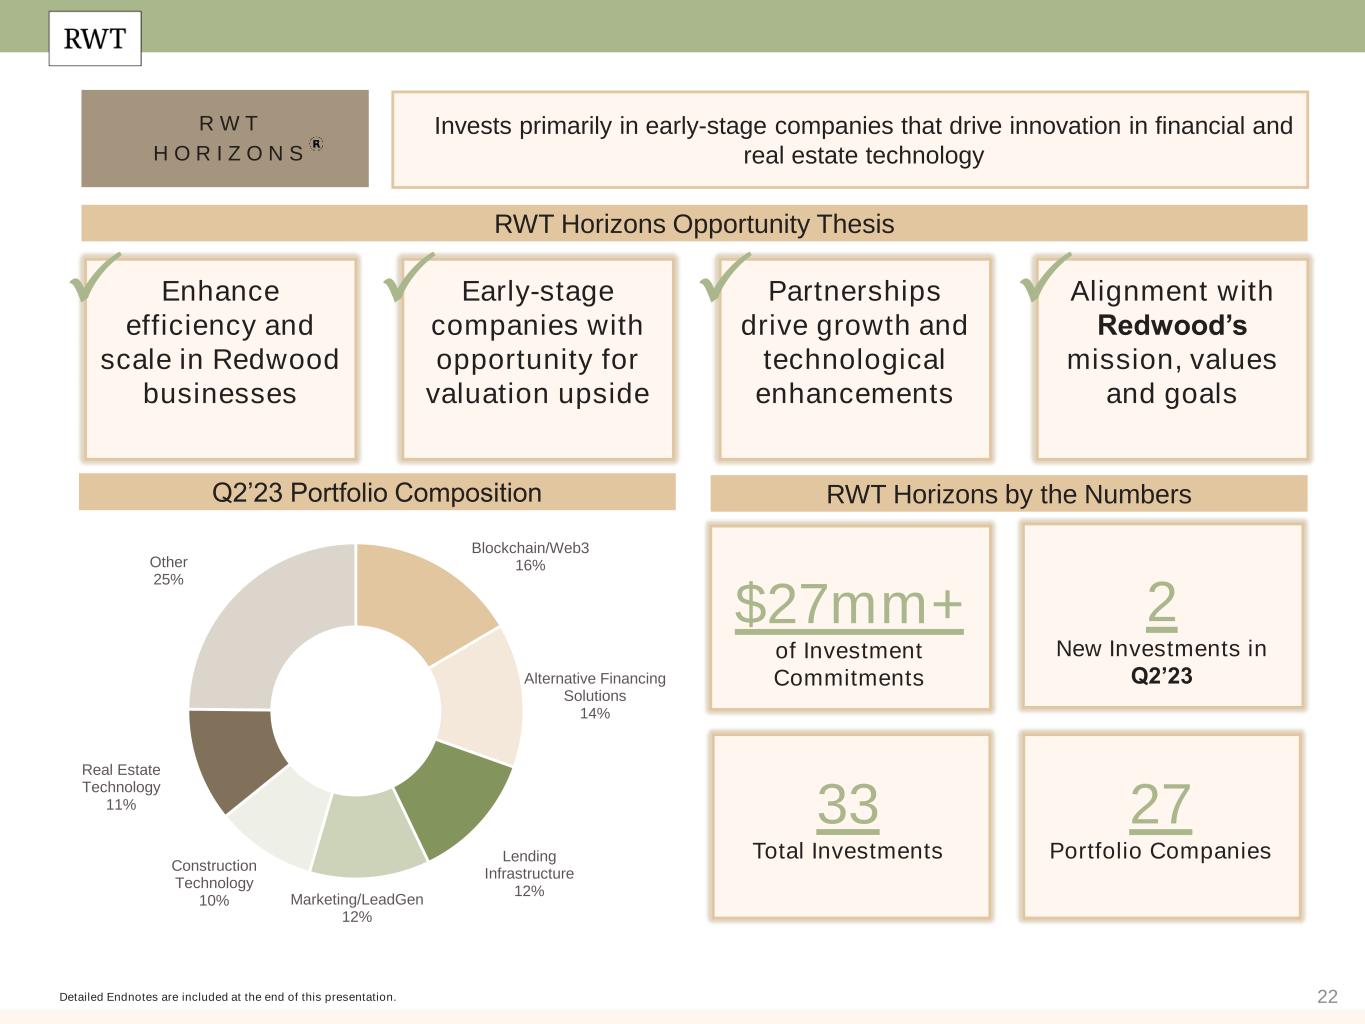
22 R W T H O R I Z O N S RWT Horizons by the Numbers Detailed Endnotes are included at the end of this presentation. Invests primarily in early-stage companies that drive innovation in financial and real estate technology RWT Horizons Opportunity Thesis Enhance efficiency and scale in Redwood businesses Early-stage companies with opportunity for valuation upside Partnerships drive growth and technological enhancements Alignment with Redwood’s mission, values and goals P P P P $27mm+ of Investment Commitments 33 Total Investments 27 Portfolio Companies Q2’23 Portfolio Composition 2 New Investments in Q2’23 Blockchain/Web3 16% Alternative Financing Solutions 14% Lending Infrastructure 12% Marketing/LeadGen 12% Construction Technology 10% Real Estate Technology 11% Other 25%

23 Financial Results
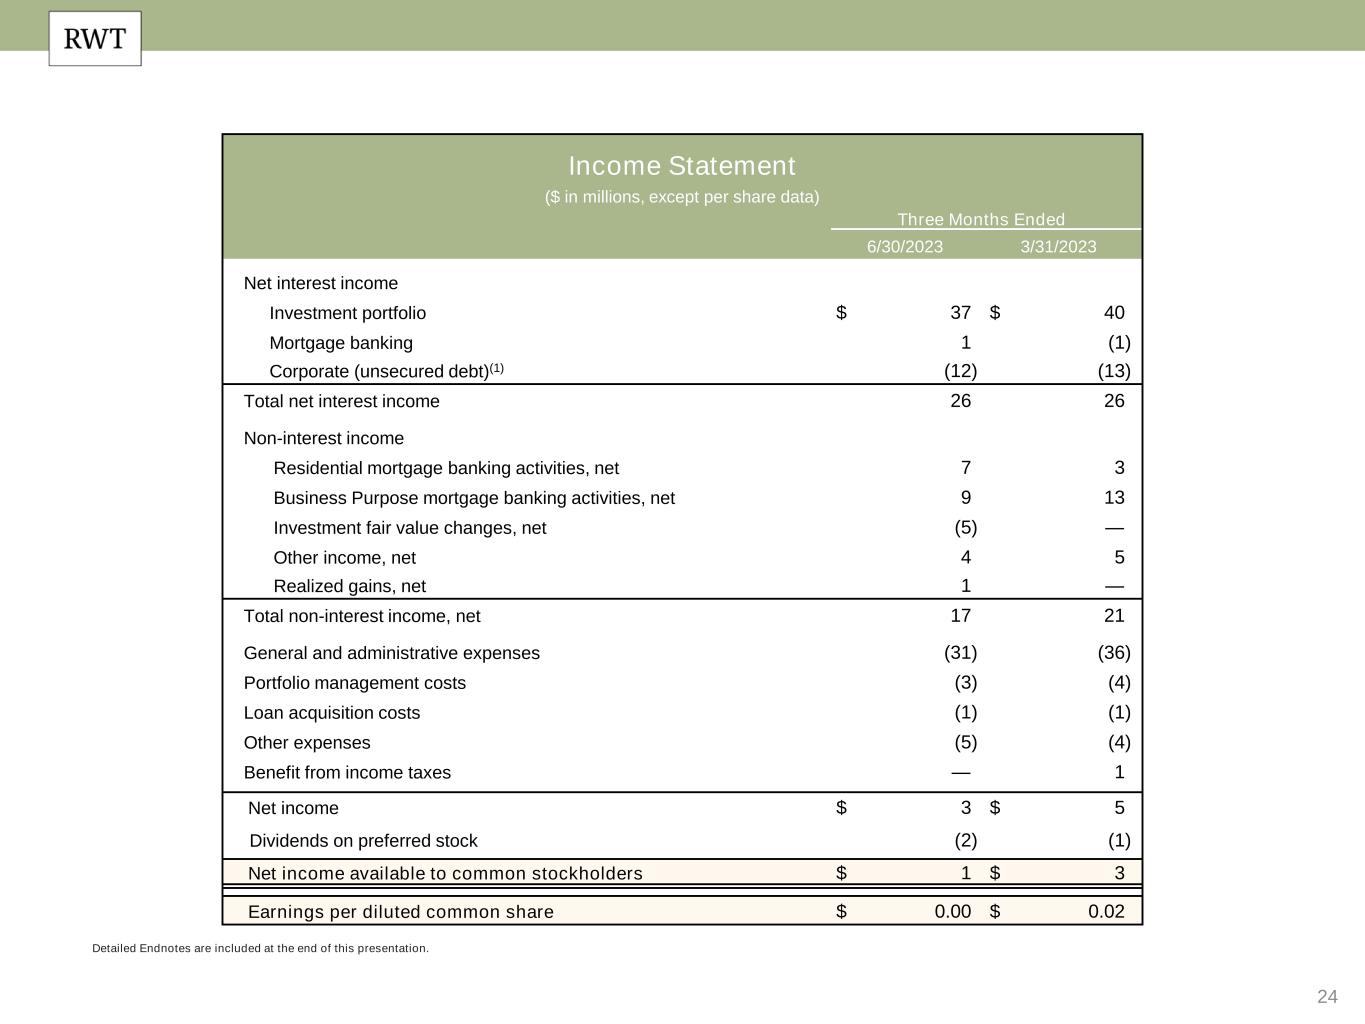
24 Detailed Endnotes are included at the end of this presentation. Income Statement ($ in millions, except per share data) Three Months Ended 6/30/2023 3/31/2023 Net interest income Investment portfolio $ 37 $ 40 Mortgage banking 1 (1) Corporate (unsecured debt)(1) (12) (13) Total net interest income 26 26 Non-interest income Residential mortgage banking activities, net 7 3 Business Purpose mortgage banking activities, net 9 13 Investment fair value changes, net (5) — Other income, net 4 5 Realized gains, net 1 — Total non-interest income, net 17 21 General and administrative expenses (31) (36) Portfolio management costs (3) (4) Loan acquisition costs (1) (1) Other expenses (5) (4) Benefit from income taxes — 1 Net income $ 3 $ 5 Dividends on preferred stock (2) (1) Net income available to common stockholders $ 1 $ 3 Earnings per diluted common share $ 0.00 $ 0.02
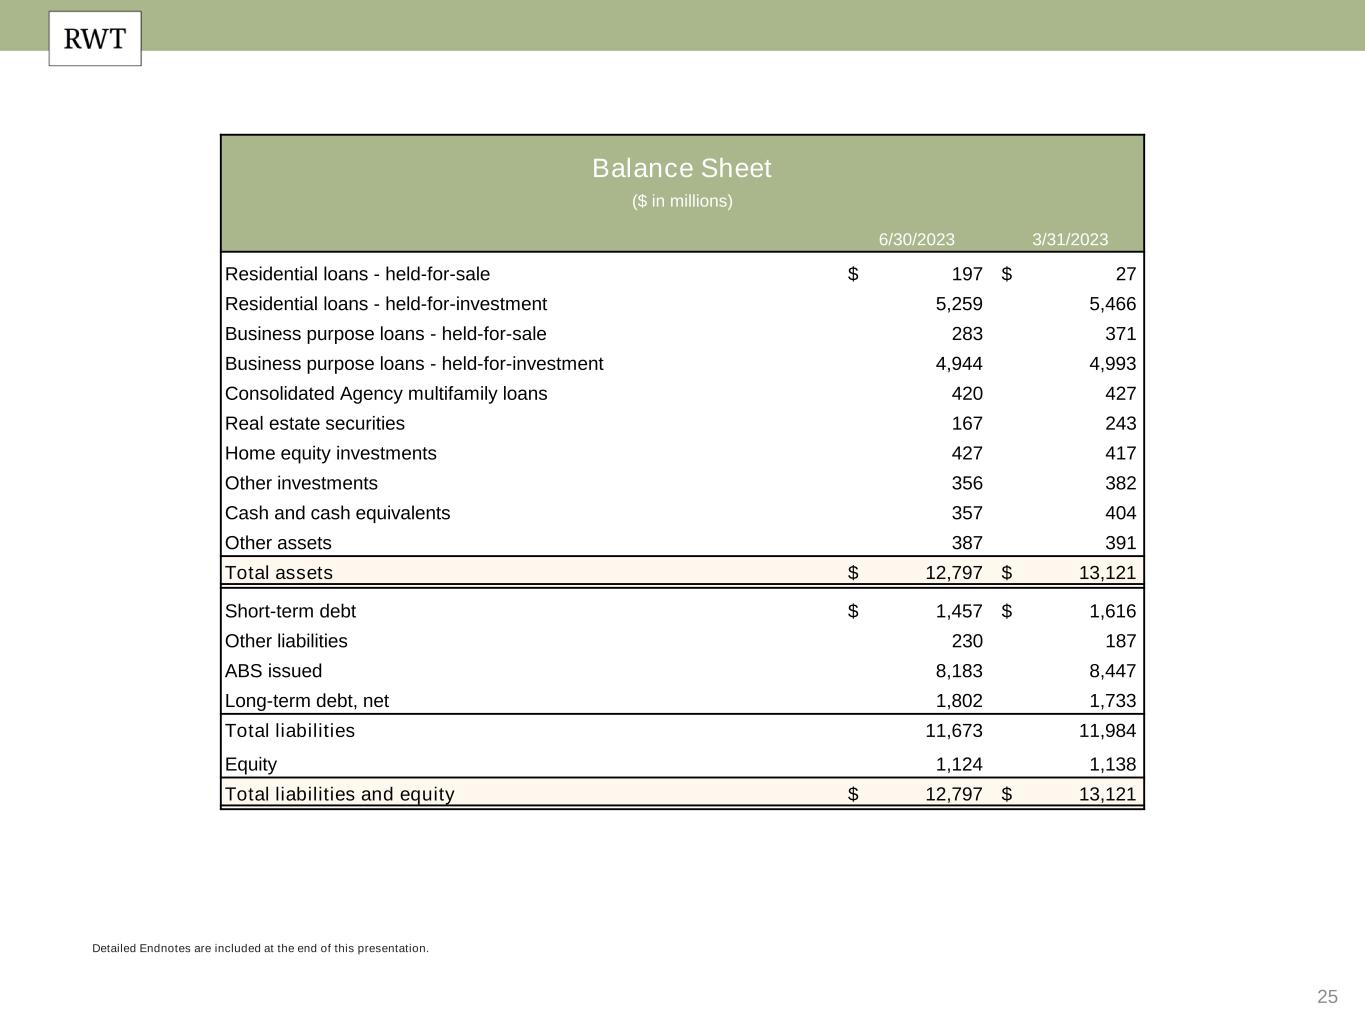
25 Balance Sheet ($ in millions) 6/30/2023 3/31/2023 Residential loans - held-for-sale $ 197 $ 27 Residential loans - held-for-investment 5,259 5,466 Business purpose loans - held-for-sale 283 371 Business purpose loans - held-for-investment 4,944 4,993 Consolidated Agency multifamily loans 420 427 Real estate securities 167 243 Home equity investments 427 417 Other investments 356 382 Cash and cash equivalents 357 404 Other assets 387 391 Total assets $ 12,797 $ 13,121 Short-term debt $ 1,457 $ 1,616 Other liabilities 230 187 ABS issued 8,183 8,447 Long-term debt, net 1,802 1,733 Total liabilities 11,673 11,984 Equity 1,124 1,138 Total liabilities and equity $ 12,797 $ 13,121 Detailed Endnotes are included at the end of this presentation.
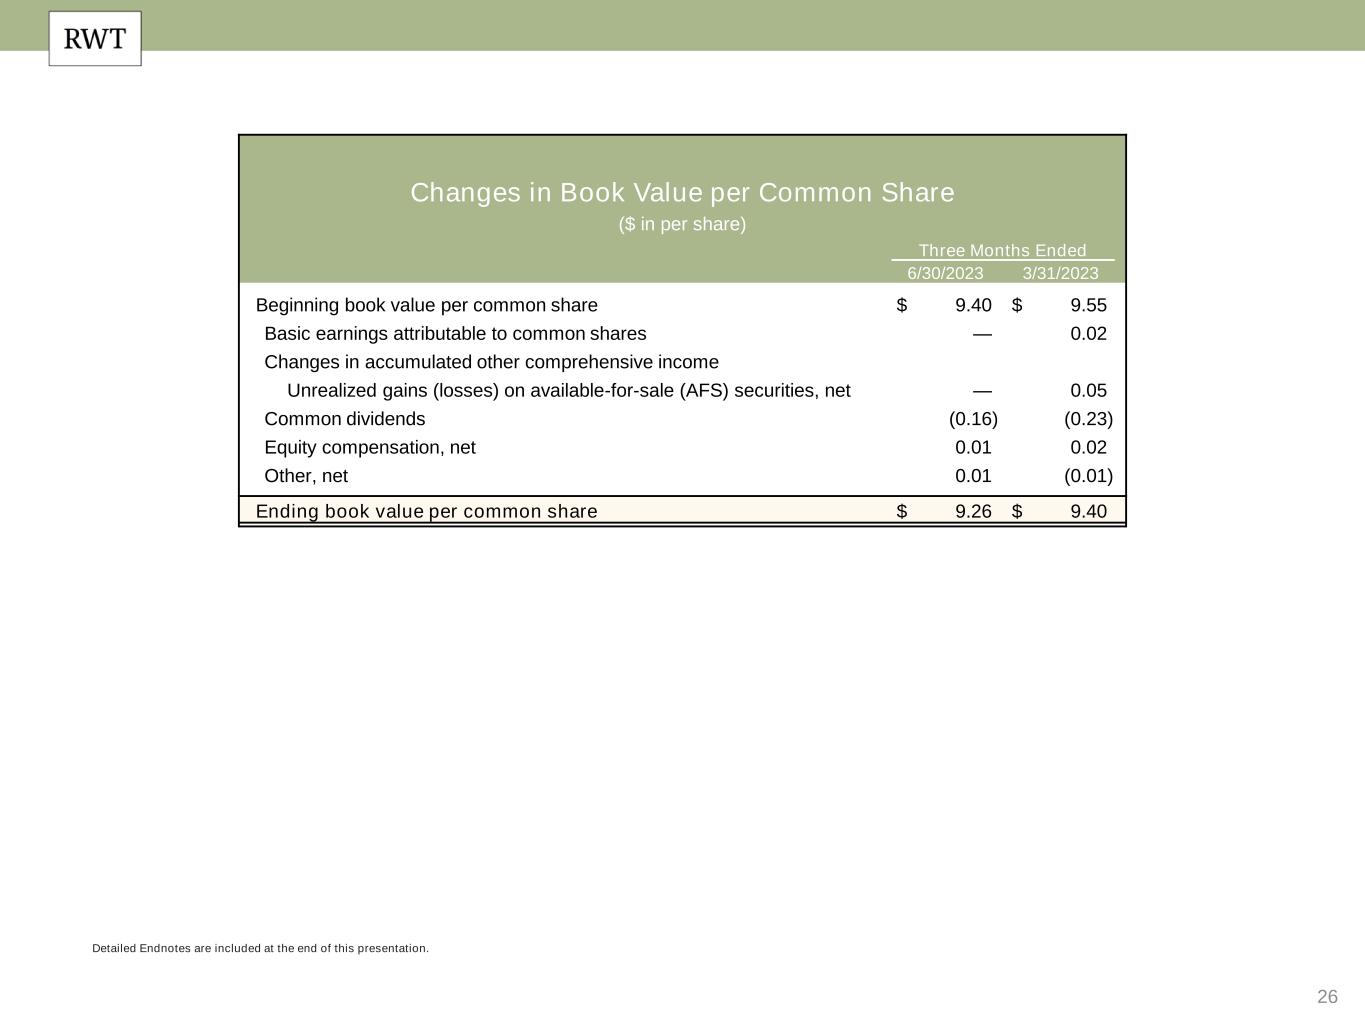
26 Detailed Endnotes are included at the end of this presentation. Changes in Book Value per Common Share ($ in per share) Three Months Ended 6/30/2023 3/31/2023 Beginning book value per common share $ 9.40 $ 9.55 Basic earnings attributable to common shares — 0.02 Changes in accumulated other comprehensive income Unrealized gains (losses) on available-for-sale (AFS) securities, net — 0.05 Common dividends (0.16) (0.23) Equity compensation, net 0.01 0.02 Other, net 0.01 (0.01) Ending book value per common share $ 9.26 $ 9.40
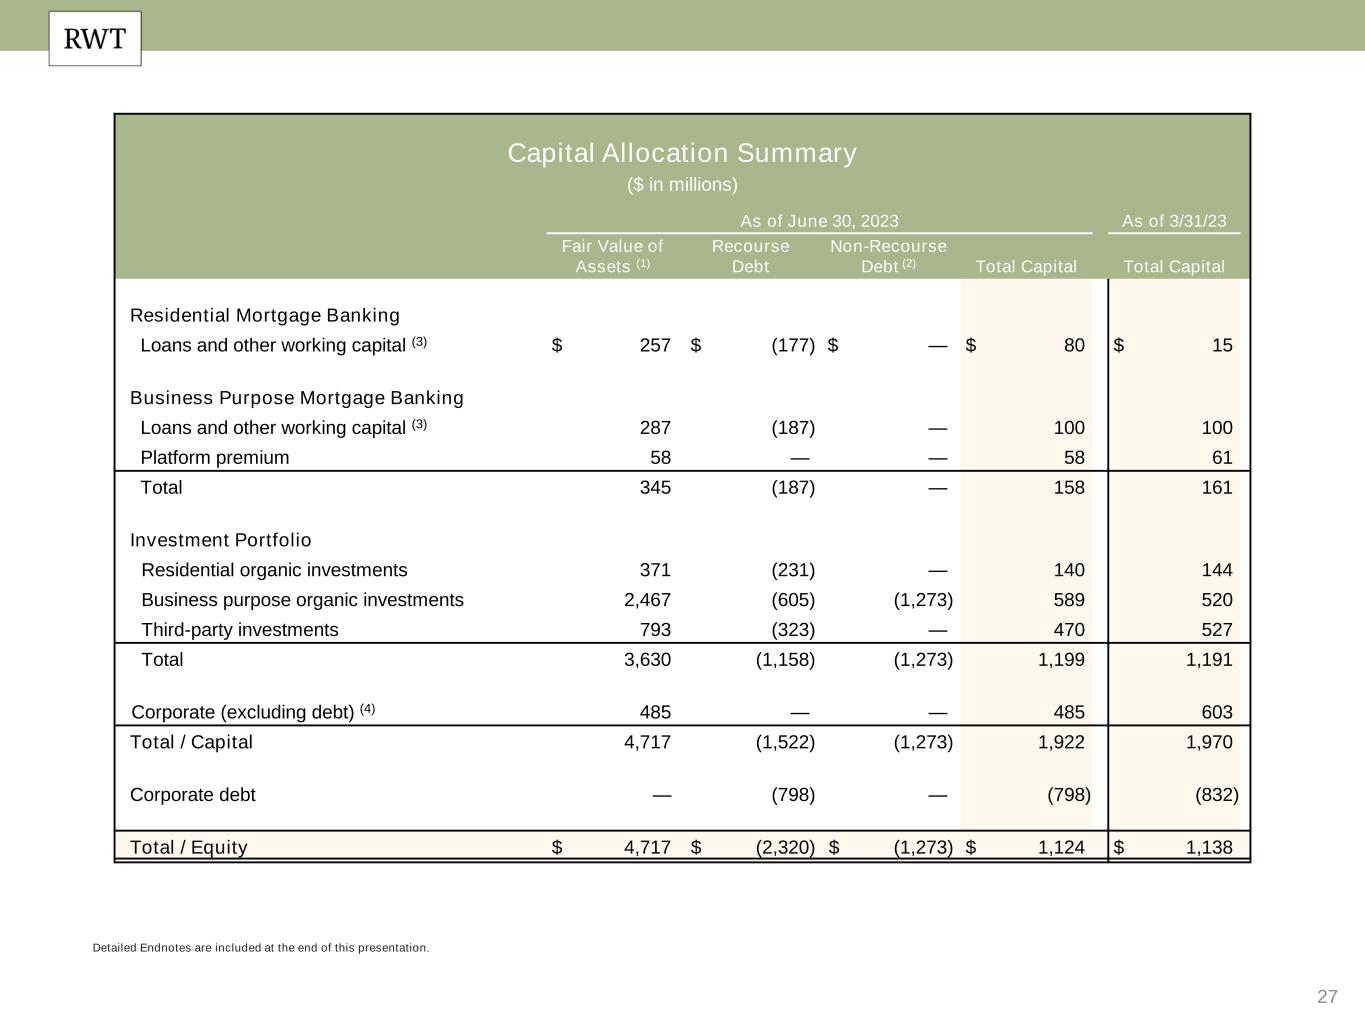
27 Detailed Endnotes are included at the end of this presentation. Capital Allocation Summary ($ in millions) As of June 30, 2023 As of 3/31/23 Fair Value of Assets (1) Recourse Debt Non-Recourse Debt (2) Total Capital Total Capital Residential Mortgage Banking Loans and other working capital (3) $ 257 $ (177) $ — $ 80 $ 15 Business Purpose Mortgage Banking Loans and other working capital (3) 287 (187) — 100 100 Platform premium 58 — — 58 61 Total 345 (187) — 158 161 Investment Portfolio Residential organic investments 371 (231) — 140 144 Business purpose organic investments 2,467 (605) (1,273) 589 520 Third-party investments 793 (323) — 470 527 Total 3,630 (1,158) (1,273) 1,199 1,191 Corporate (excluding debt) (4) 485 — — 485 603 Total / Capital 4,717 (1,522) (1,273) 1,922 1,970 Corporate debt — (798) — (798) (832) Total / Equity $ 4,717 $ (2,320) $ (1,273) $ 1,124 $ 1,138
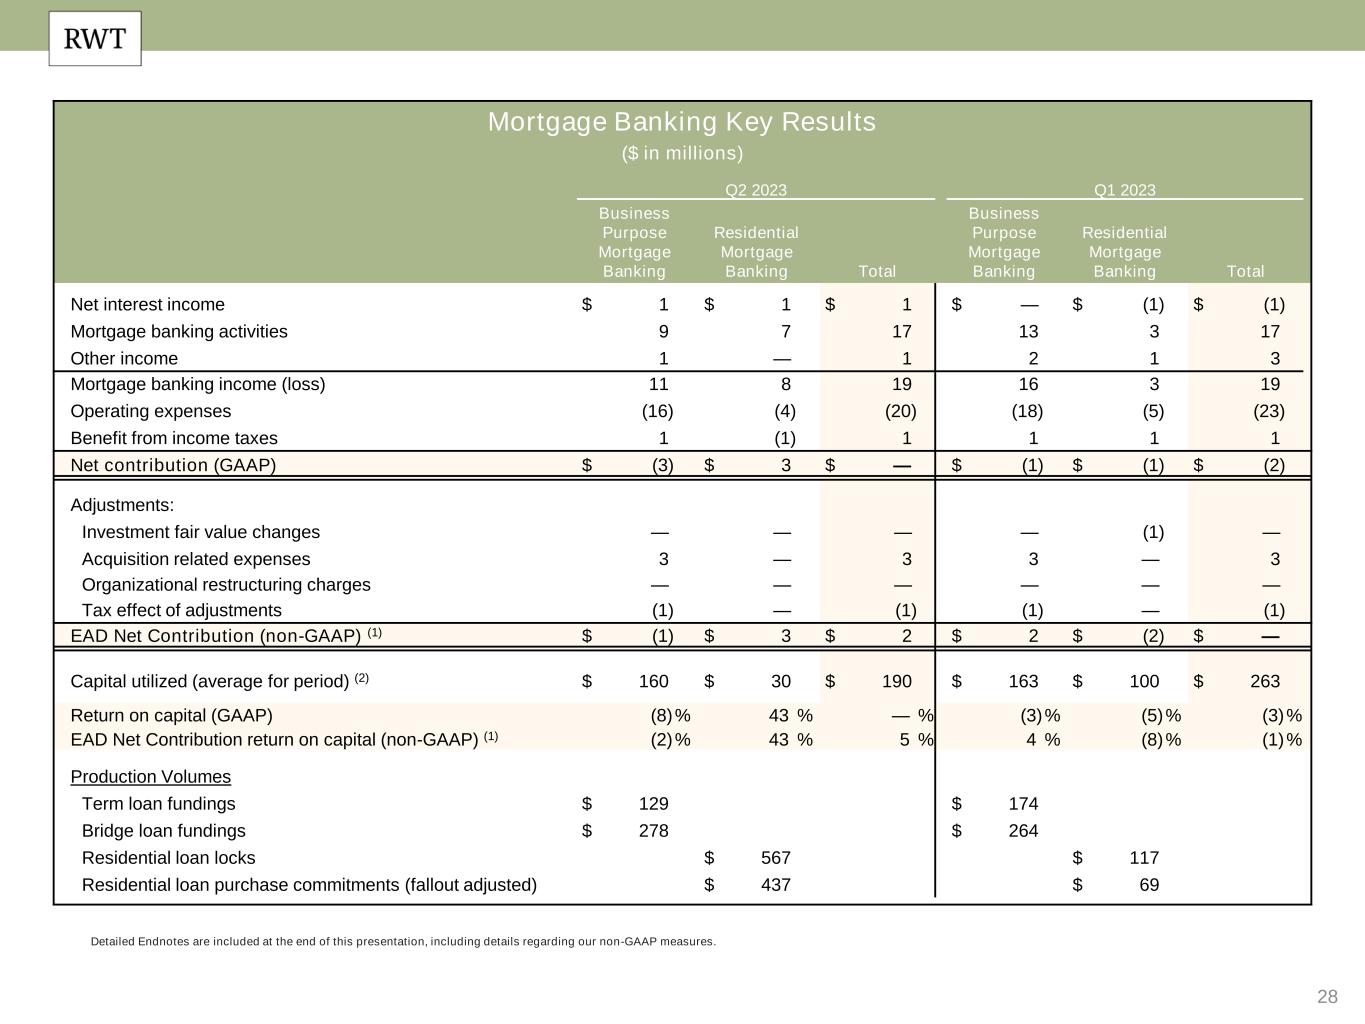
28 Detailed Endnotes are included at the end of this presentation, including details regarding our non-GAAP measures. Mortgage Banking Key Results ($ in millions) Q2 2023 Q1 2023 Business Purpose Mortgage Banking Residential Mortgage Banking Total Business Purpose Mortgage Banking Residential Mortgage Banking Total Net interest income $ 1 $ 1 $ 1 $ — $ (1) $ (1) Mortgage banking activities 9 7 17 13 3 17 Other income 1 — 1 2 1 3 Mortgage banking income (loss) 11 8 19 16 3 19 Operating expenses (16) (4) (20) (18) (5) (23) Benefit from income taxes 1 (1) 1 1 1 1 Net contribution (GAAP) $ (3) $ 3 $ — $ (1) $ (1) $ (2) Adjustments: Investment fair value changes — — — — (1) — Acquisition related expenses 3 — 3 3 — 3 Organizational restructuring charges — — — — — — Tax effect of adjustments (1) — (1) (1) — (1) EAD Net Contribution (non-GAAP) (1) $ (1) $ 3 $ 2 $ 2 $ (2) $ — Capital utilized (average for period) (2) $ 160 $ 30 $ 190 $ 163 $ 100 $ 263 Return on capital (GAAP) (8) % 43 % — % (3) % (5) % (3) % EAD Net Contribution return on capital (non-GAAP) (1) (2) % 43 % 5 % 4 % (8) % (1) % Production Volumes Term loan fundings $ 129 $ 174 Bridge loan fundings $ 278 $ 264 Residential loan locks $ 567 $ 117 Residential loan purchase commitments (fallout adjusted) $ 437 $ 69
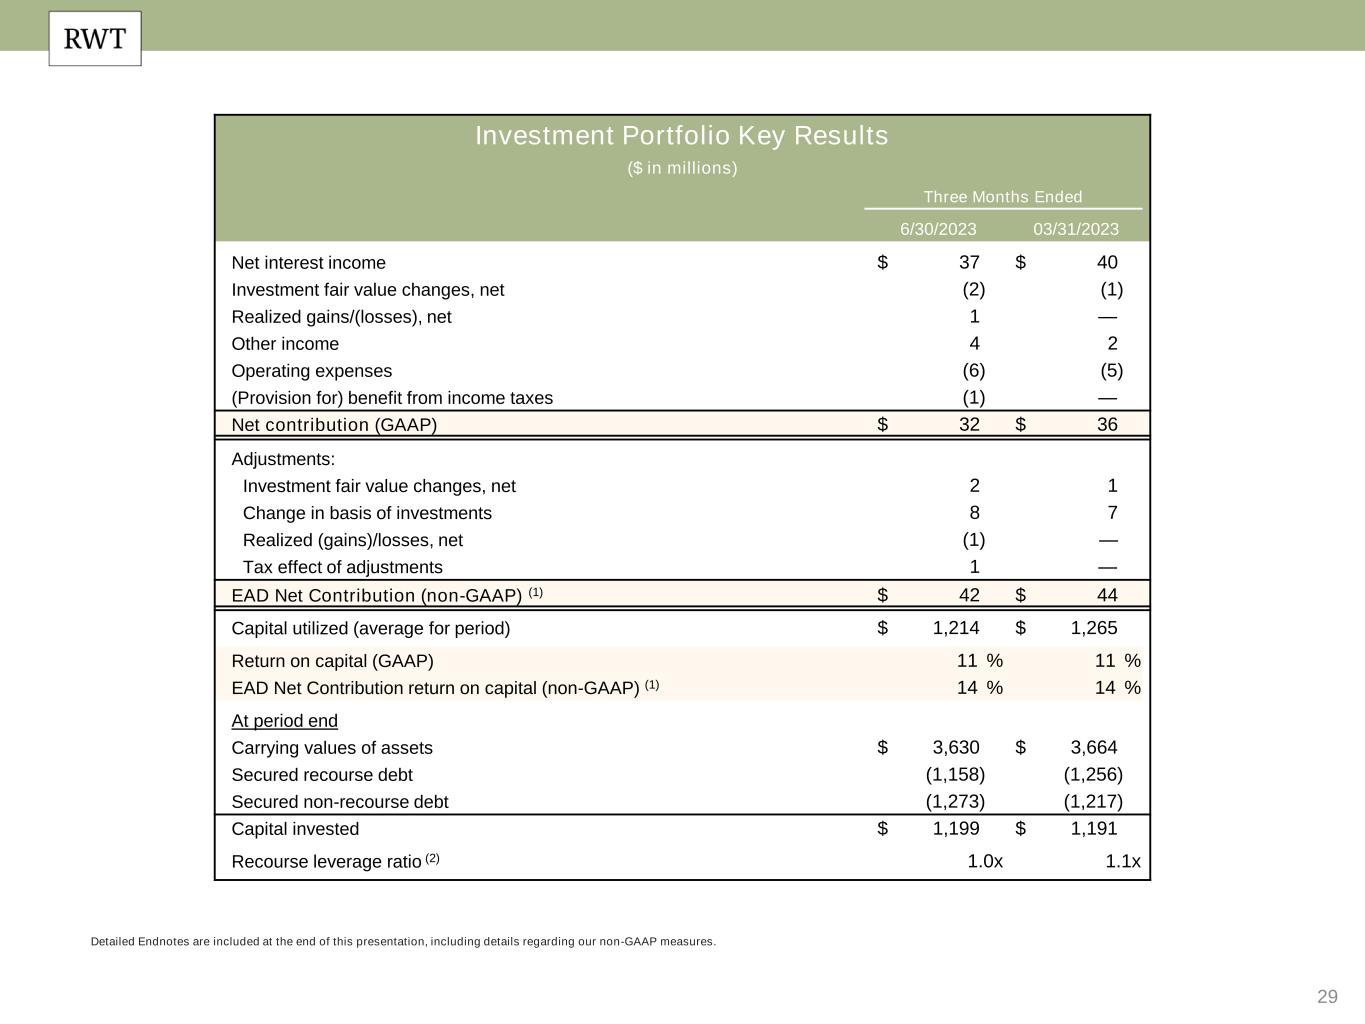
29 Detailed Endnotes are included at the end of this presentation, including details regarding our non-GAAP measures. Investment Portfolio Key Results ($ in millions) Three Months Ended 6/30/2023 03/31/2023 Net interest income $ 37 $ 40 Investment fair value changes, net (2) (1) Realized gains/(losses), net 1 — Other income 4 2 Operating expenses (6) (5) (Provision for) benefit from income taxes (1) — Net contribution (GAAP) $ 32 $ 36 Adjustments: Investment fair value changes, net 2 1 Change in basis of investments 8 7 Realized (gains)/losses, net (1) — Tax effect of adjustments 1 — EAD Net Contribution (non-GAAP) (1) $ 42 $ 44 Capital utilized (average for period) $ 1,214 $ 1,265 Return on capital (GAAP) 11 % 11 % EAD Net Contribution return on capital (non-GAAP) (1) 14 % 14 % At period end Carrying values of assets $ 3,630 $ 3,664 Secured recourse debt (1,158) (1,256) Secured non-recourse debt (1,273) (1,217) Capital invested $ 1,199 $ 1,191 Recourse leverage ratio (2) 1.0x 1.1x
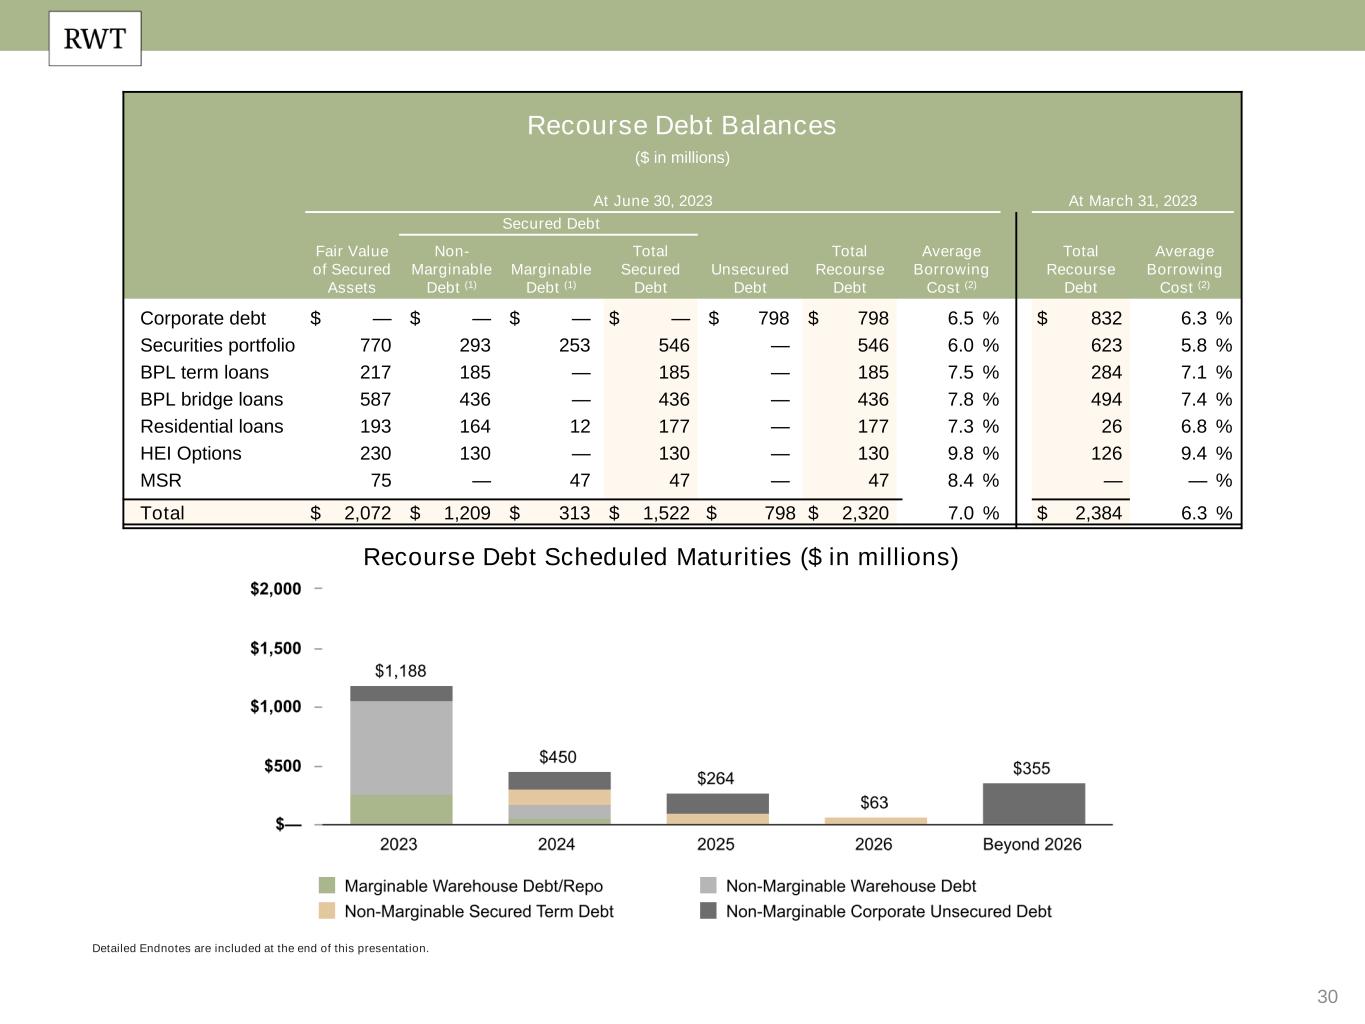
30 Detailed Endnotes are included at the end of this presentation. Recourse Debt Scheduled Maturities ($ in millions) Recourse Debt Balances ($ in millions) At June 30, 2023 At March 31, 2023 Secured Debt Fair Value of Secured Assets Non- Marginable Debt (1) Marginable Debt (1) Total Secured Debt Unsecured Debt Total Recourse Debt Average Borrowing Cost (2) Total Recourse Debt Average Borrowing Cost (2) Corporate debt $ — $ — $ — $ — $ 798 $ 798 6.5 % $ 832 6.3 % Securities portfolio 770 293 253 546 — 546 6.0 % 623 5.8 % BPL term loans 217 185 — 185 — 185 7.5 % 284 7.1 % BPL bridge loans 587 436 — 436 — 436 7.8 % 494 7.4 % Residential loans 193 164 12 177 — 177 7.3 % 26 6.8 % HEI Options 230 130 — 130 — 130 9.8 % 126 9.4 % MSR 75 — 47 47 — 47 8.4 % — — % Total $ 2,072 $ 1,209 $ 313 $ 1,522 $ 798 $ 2,320 7.0 % $ 2,384 6.3 %

31 Endnotes
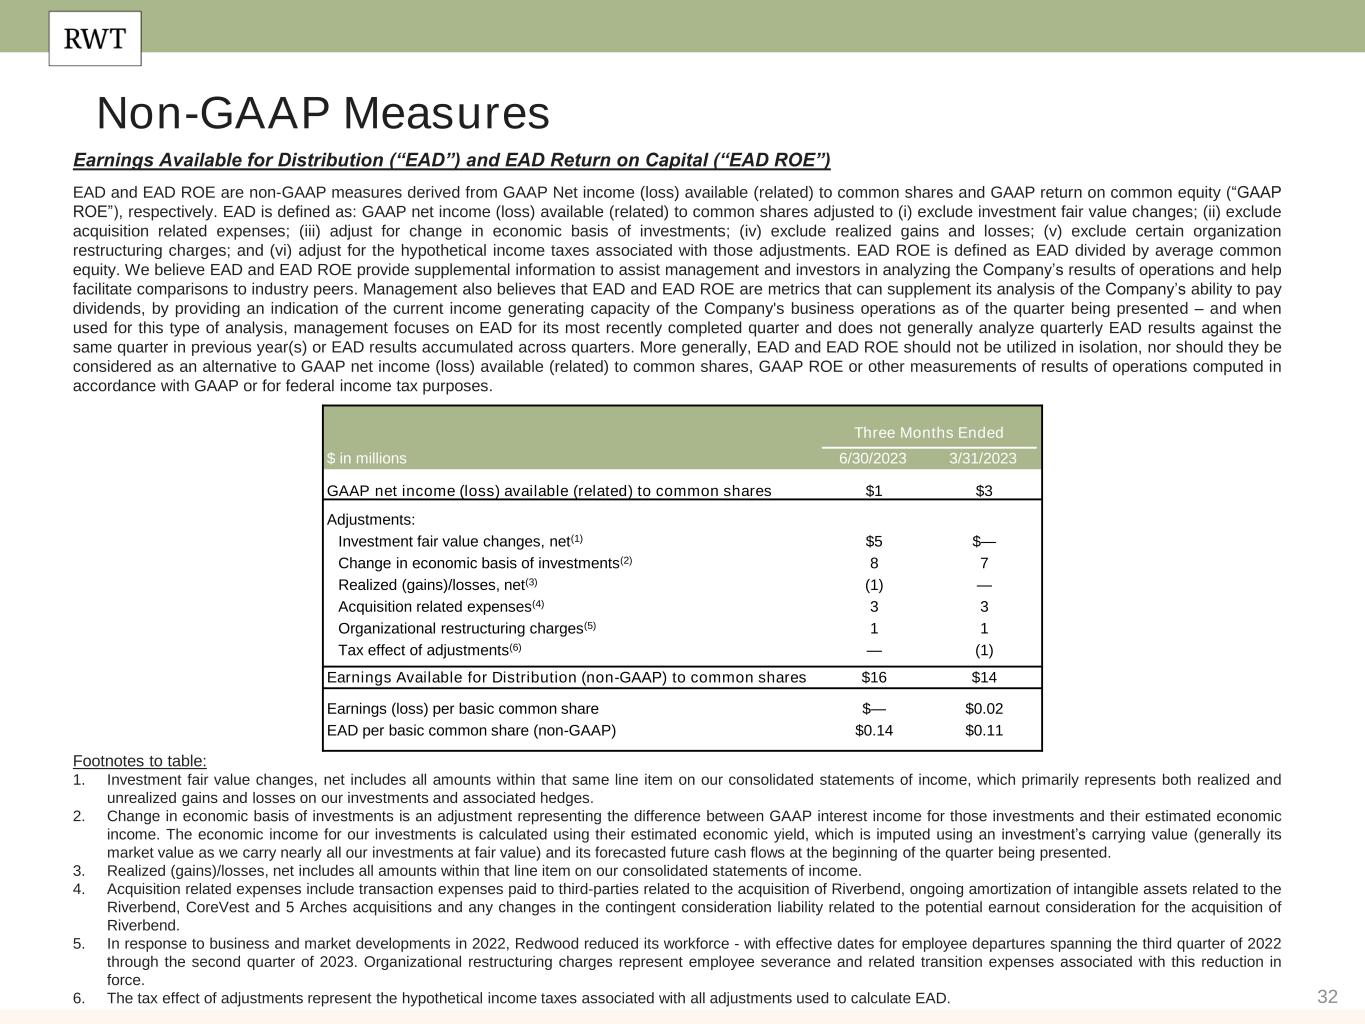
32 Non-GAAP Measures Earnings Available for Distribution (“EAD”) and EAD Return on Capital (“EAD ROE”) EAD and EAD ROE are non-GAAP measures derived from GAAP Net income (loss) available (related) to common shares and GAAP return on common equity (“GAAP ROE”), respectively. EAD is defined as: GAAP net income (loss) available (related) to common shares adjusted to (i) exclude investment fair value changes; (ii) exclude acquisition related expenses; (iii) adjust for change in economic basis of investments; (iv) exclude realized gains and losses; (v) exclude certain organization restructuring charges; and (vi) adjust for the hypothetical income taxes associated with those adjustments. EAD ROE is defined as EAD divided by average common equity. We believe EAD and EAD ROE provide supplemental information to assist management and investors in analyzing the Company’s results of operations and help facilitate comparisons to industry peers. Management also believes that EAD and EAD ROE are metrics that can supplement its analysis of the Company’s ability to pay dividends, by providing an indication of the current income generating capacity of the Company's business operations as of the quarter being presented – and when used for this type of analysis, management focuses on EAD for its most recently completed quarter and does not generally analyze quarterly EAD results against the same quarter in previous year(s) or EAD results accumulated across quarters. More generally, EAD and EAD ROE should not be utilized in isolation, nor should they be considered as an alternative to GAAP net income (loss) available (related) to common shares, GAAP ROE or other measurements of results of operations computed in accordance with GAAP or for federal income tax purposes. Footnotes to table: 1. Investment fair value changes, net includes all amounts within that same line item on our consolidated statements of income, which primarily represents both realized and unrealized gains and losses on our investments and associated hedges. 2. Change in economic basis of investments is an adjustment representing the difference between GAAP interest income for those investments and their estimated economic income. The economic income for our investments is calculated using their estimated economic yield, which is imputed using an investment’s carrying value (generally its market value as we carry nearly all our investments at fair value) and its forecasted future cash flows at the beginning of the quarter being presented. 3. Realized (gains)/losses, net includes all amounts within that line item on our consolidated statements of income. 4. Acquisition related expenses include transaction expenses paid to third-parties related to the acquisition of Riverbend, ongoing amortization of intangible assets related to the Riverbend, CoreVest and 5 Arches acquisitions and any changes in the contingent consideration liability related to the potential earnout consideration for the acquisition of Riverbend. 5. In response to business and market developments in 2022, Redwood reduced its workforce - with effective dates for employee departures spanning the third quarter of 2022 through the second quarter of 2023. Organizational restructuring charges represent employee severance and related transition expenses associated with this reduction in force. 6. The tax effect of adjustments represent the hypothetical income taxes associated with all adjustments used to calculate EAD. Three Months Ended $ in millions 6/30/2023 3/31/2023 GAAP net income (loss) available (related) to common shares $1 $3 Adjustments: Investment fair value changes, net(1) $5 $— Change in economic basis of investments(2) 8 7 Realized (gains)/losses, net(3) (1) — Acquisition related expenses(4) 3 3 Organizational restructuring charges(5) 1 1 Tax effect of adjustments(6) — (1) Earnings Available for Distribution (non-GAAP) to common shares $16 $14 Earnings (loss) per basic common share $— $0.02 EAD per basic common share (non-GAAP) $0.14 $0.11
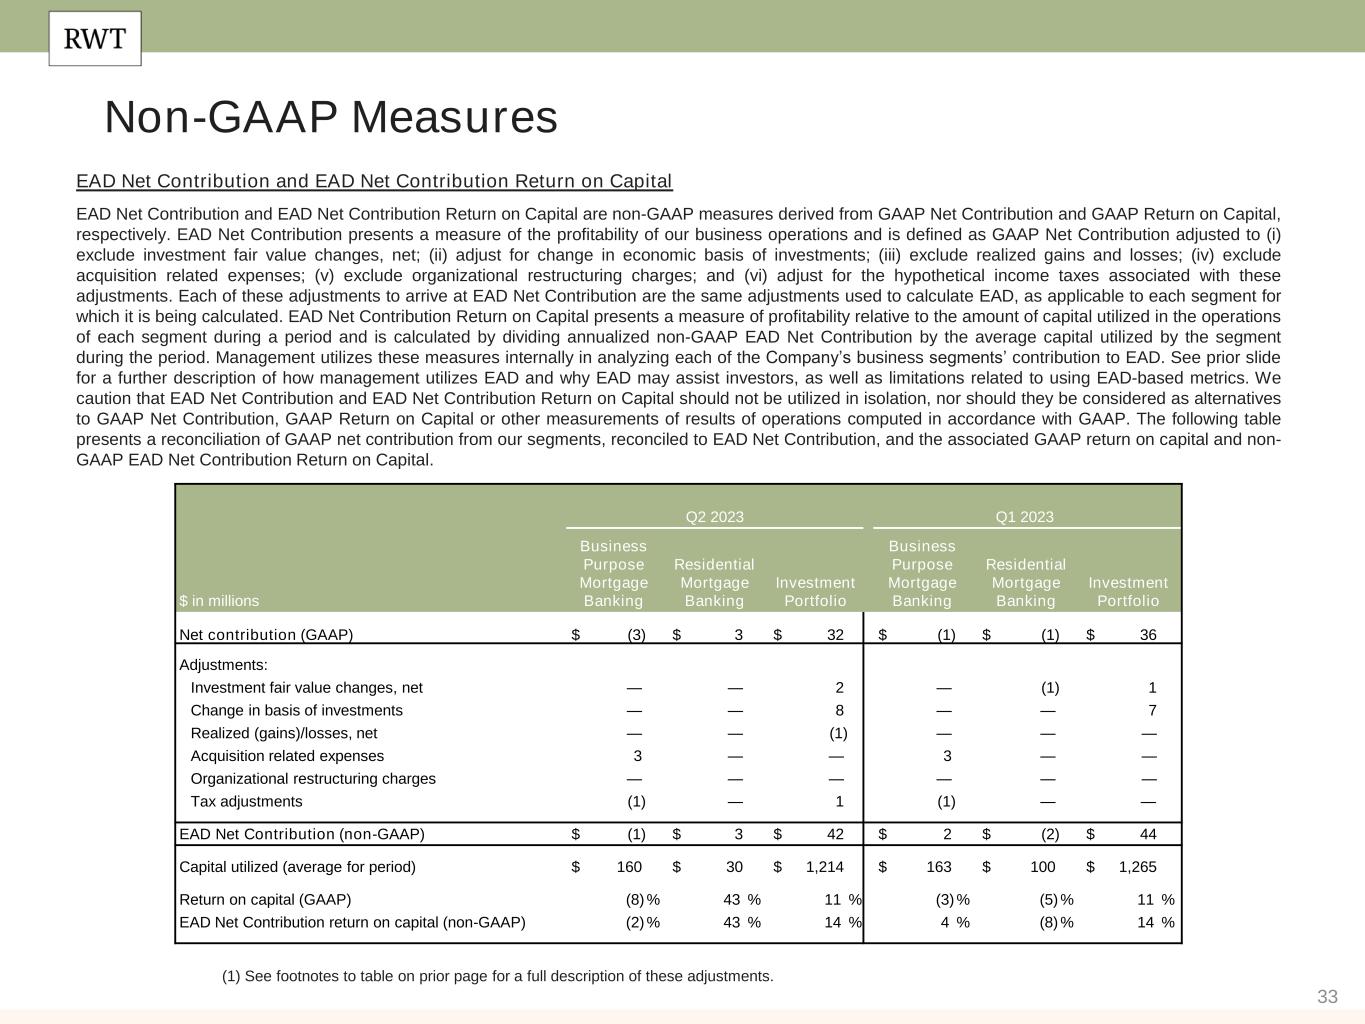
33 Non-GAAP Measures EAD Net Contribution and EAD Net Contribution Return on Capital EAD Net Contribution and EAD Net Contribution Return on Capital are non-GAAP measures derived from GAAP Net Contribution and GAAP Return on Capital, respectively. EAD Net Contribution presents a measure of the profitability of our business operations and is defined as GAAP Net Contribution adjusted to (i) exclude investment fair value changes, net; (ii) adjust for change in economic basis of investments; (iii) exclude realized gains and losses; (iv) exclude acquisition related expenses; (v) exclude organizational restructuring charges; and (vi) adjust for the hypothetical income taxes associated with these adjustments. Each of these adjustments to arrive at EAD Net Contribution are the same adjustments used to calculate EAD, as applicable to each segment for which it is being calculated. EAD Net Contribution Return on Capital presents a measure of profitability relative to the amount of capital utilized in the operations of each segment during a period and is calculated by dividing annualized non-GAAP EAD Net Contribution by the average capital utilized by the segment during the period. Management utilizes these measures internally in analyzing each of the Company’s business segments’ contribution to EAD. See prior slide for a further description of how management utilizes EAD and why EAD may assist investors, as well as limitations related to using EAD-based metrics. We caution that EAD Net Contribution and EAD Net Contribution Return on Capital should not be utilized in isolation, nor should they be considered as alternatives to GAAP Net Contribution, GAAP Return on Capital or other measurements of results of operations computed in accordance with GAAP. The following table presents a reconciliation of GAAP net contribution from our segments, reconciled to EAD Net Contribution, and the associated GAAP return on capital and non- GAAP EAD Net Contribution Return on Capital. (1) See footnotes to table on prior page for a full description of these adjustments. Q2 2023 Q1 2023 $ in millions Business Purpose Mortgage Banking Residential Mortgage Banking Investment Portfolio Business Purpose Mortgage Banking Residential Mortgage Banking Investment Portfolio Net contribution (GAAP) $ (3) $ 3 $ 32 $ (1) $ (1) $ 36 Adjustments: Investment fair value changes, net — — 2 — (1) 1 Change in basis of investments — — 8 — — 7 Realized (gains)/losses, net — — (1) — — — Acquisition related expenses 3 — — 3 — — Organizational restructuring charges — — — — — — Tax adjustments (1) — 1 (1) — — EAD Net Contribution (non-GAAP) $ (1) $ 3 $ 42 $ 2 $ (2) $ 44 Capital utilized (average for period) $ 160 $ 30 $ 1,214 $ 163 $ 100 $ 1,265 Return on capital (GAAP) (8) % 43 % 11 % (3) % (5) % 11 % EAD Net Contribution return on capital (non-GAAP) (2) % 43 % 14 % 4 % (8) % 14 %
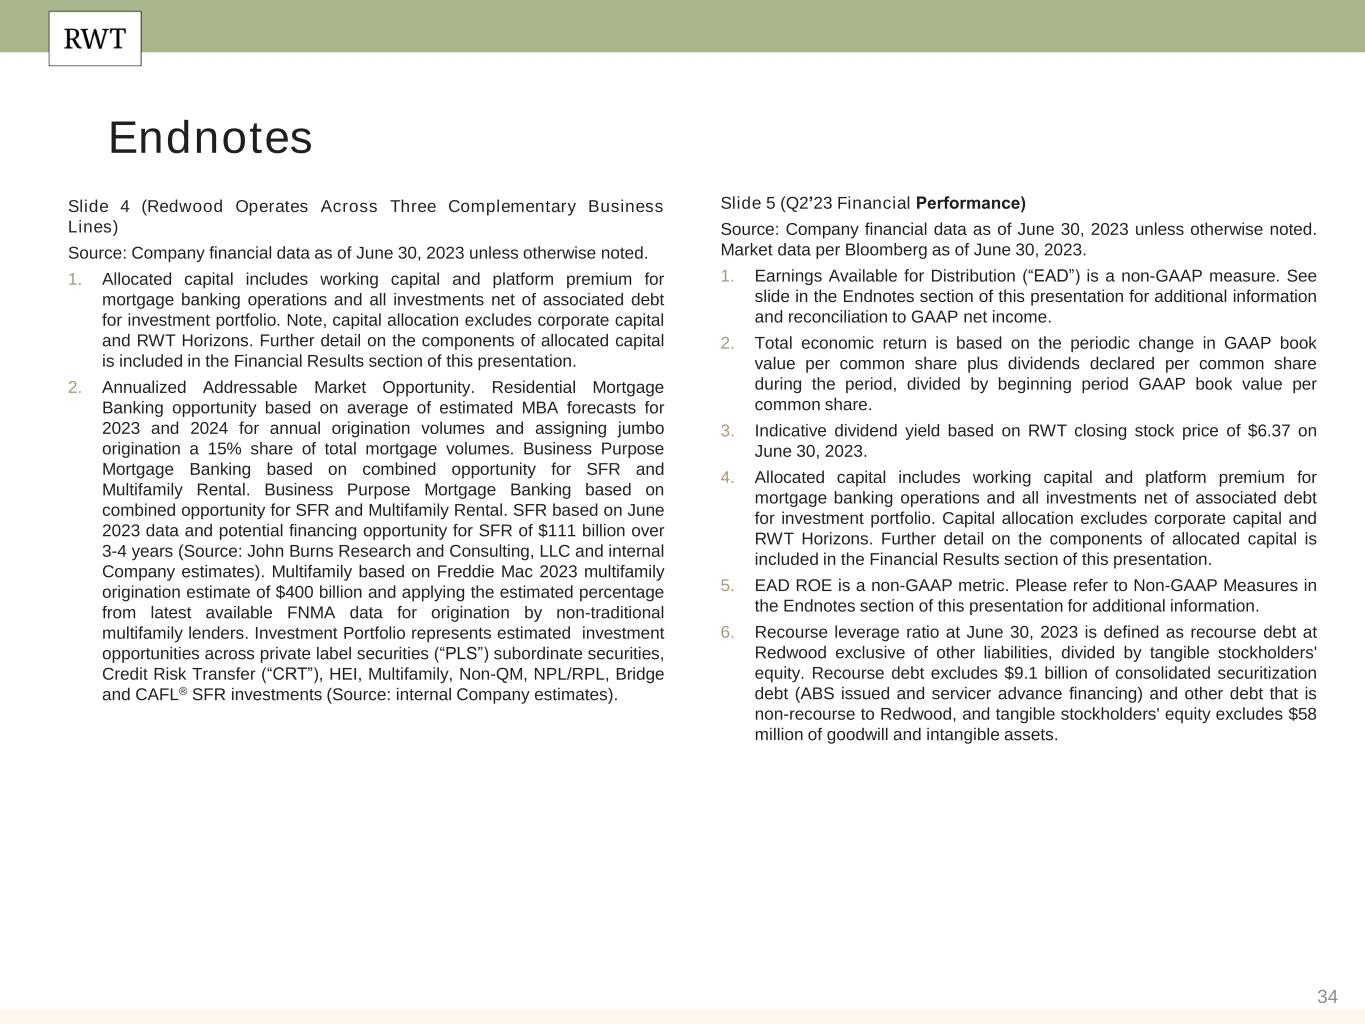
34 Slide 4 (Redwood Operates Across Three Complementary Business Lines) Source: Company financial data as of June 30, 2023 unless otherwise noted. 1. Allocated capital includes working capital and platform premium for mortgage banking operations and all investments net of associated debt for investment portfolio. Note, capital allocation excludes corporate capital and RWT Horizons. Further detail on the components of allocated capital is included in the Financial Results section of this presentation. 2. Annualized Addressable Market Opportunity. Residential Mortgage Banking opportunity based on average of estimated MBA forecasts for 2023 and 2024 for annual origination volumes and assigning jumbo origination a 15% share of total mortgage volumes. Business Purpose Mortgage Banking based on combined opportunity for SFR and Multifamily Rental. Business Purpose Mortgage Banking based on combined opportunity for SFR and Multifamily Rental. SFR based on June 2023 data and potential financing opportunity for SFR of $111 billion over 3-4 years (Source: John Burns Research and Consulting, LLC and internal Company estimates). Multifamily based on Freddie Mac 2023 multifamily origination estimate of $400 billion and applying the estimated percentage from latest available FNMA data for origination by non-traditional multifamily lenders. Investment Portfolio represents estimated investment opportunities across private label securities (“PLS”) subordinate securities, Credit Risk Transfer (“CRT”), HEI, Multifamily, Non-QM, NPL/RPL, Bridge and CAFL® SFR investments (Source: internal Company estimates). Endnotes Slide 5 (Q2’23 Financial Performance) Source: Company financial data as of June 30, 2023 unless otherwise noted. Market data per Bloomberg as of June 30, 2023. 1. Earnings Available for Distribution (“EAD”) is a non-GAAP measure. See slide in the Endnotes section of this presentation for additional information and reconciliation to GAAP net income. 2. Total economic return is based on the periodic change in GAAP book value per common share plus dividends declared per common share during the period, divided by beginning period GAAP book value per common share. 3. Indicative dividend yield based on RWT closing stock price of $6.37 on June 30, 2023. 4. Allocated capital includes working capital and platform premium for mortgage banking operations and all investments net of associated debt for investment portfolio. Capital allocation excludes corporate capital and RWT Horizons. Further detail on the components of allocated capital is included in the Financial Results section of this presentation. 5. EAD ROE is a non-GAAP metric. Please refer to Non-GAAP Measures in the Endnotes section of this presentation for additional information. 6. Recourse leverage ratio at June 30, 2023 is defined as recourse debt at Redwood exclusive of other liabilities, divided by tangible stockholders' equity. Recourse debt excludes $9.1 billion of consolidated securitization debt (ABS issued and servicer advance financing) and other debt that is non-recourse to Redwood, and tangible stockholders' equity excludes $58 million of goodwill and intangible assets.
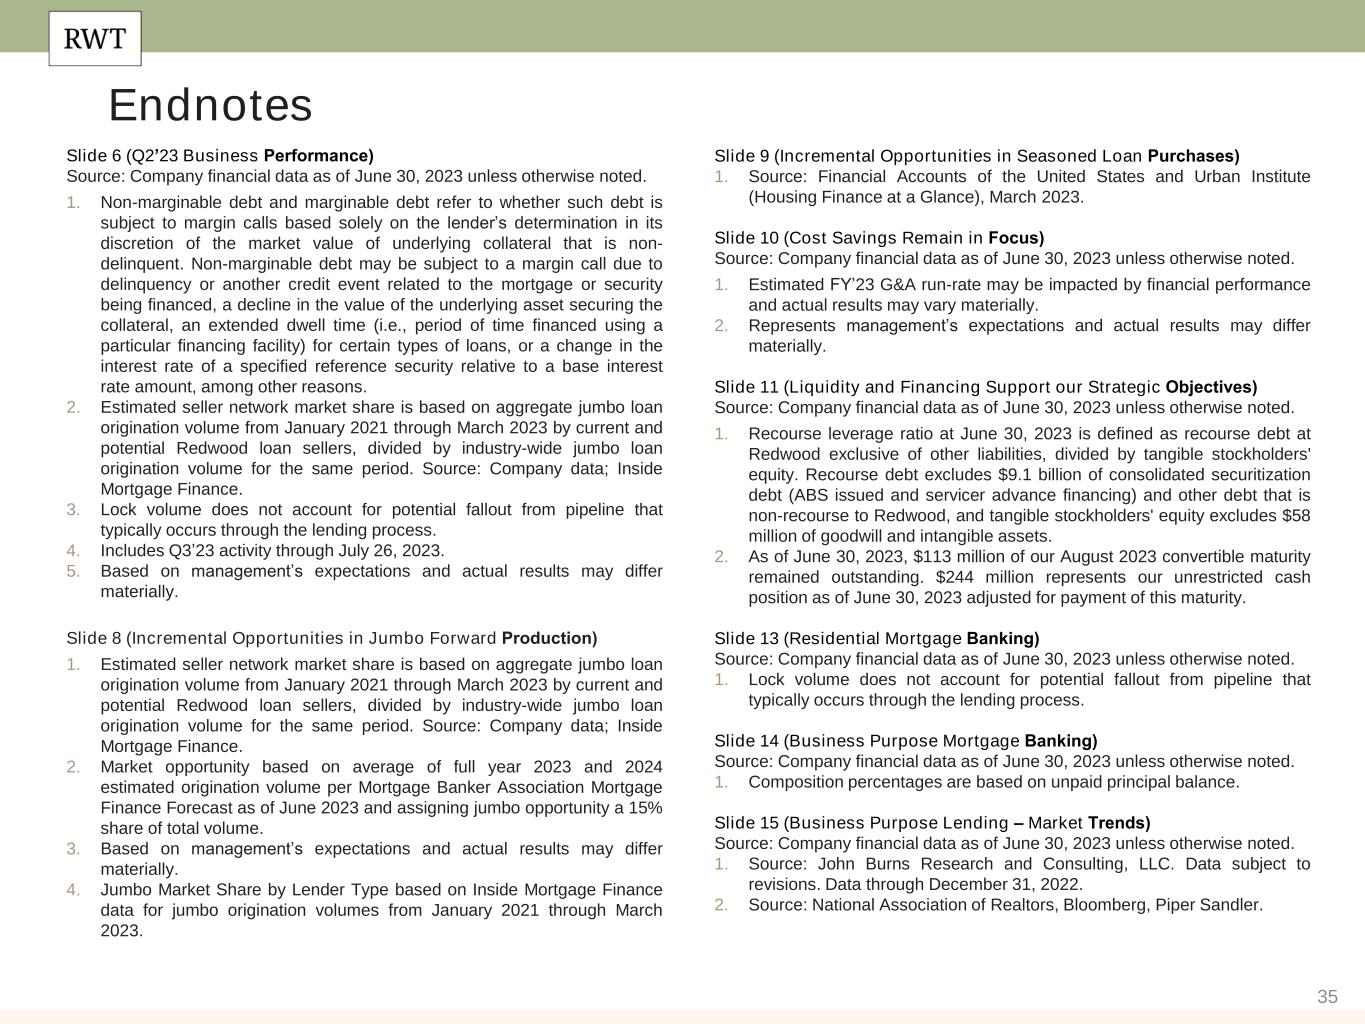
35 Endnotes Slide 6 (Q2’23 Business Performance) Source: Company financial data as of June 30, 2023 unless otherwise noted. 1. Non-marginable debt and marginable debt refer to whether such debt is subject to margin calls based solely on the lender’s determination in its discretion of the market value of underlying collateral that is non- delinquent. Non-marginable debt may be subject to a margin call due to delinquency or another credit event related to the mortgage or security being financed, a decline in the value of the underlying asset securing the collateral, an extended dwell time (i.e., period of time financed using a particular financing facility) for certain types of loans, or a change in the interest rate of a specified reference security relative to a base interest rate amount, among other reasons. 2. Estimated seller network market share is based on aggregate jumbo loan origination volume from January 2021 through March 2023 by current and potential Redwood loan sellers, divided by industry-wide jumbo loan origination volume for the same period. Source: Company data; Inside Mortgage Finance. 3. Lock volume does not account for potential fallout from pipeline that typically occurs through the lending process. 4. Includes Q3’23 activity through July 26, 2023. 5. Based on management’s expectations and actual results may differ materially. Slide 8 (Incremental Opportunities in Jumbo Forward Production) 1. Estimated seller network market share is based on aggregate jumbo loan origination volume from January 2021 through March 2023 by current and potential Redwood loan sellers, divided by industry-wide jumbo loan origination volume for the same period. Source: Company data; Inside Mortgage Finance. 2. Market opportunity based on average of full year 2023 and 2024 estimated origination volume per Mortgage Banker Association Mortgage Finance Forecast as of June 2023 and assigning jumbo opportunity a 15% share of total volume. 3. Based on management’s expectations and actual results may differ materially. 4. Jumbo Market Share by Lender Type based on Inside Mortgage Finance data for jumbo origination volumes from January 2021 through March 2023. Slide 9 (Incremental Opportunities in Seasoned Loan Purchases) 1. Source: Financial Accounts of the United States and Urban Institute (Housing Finance at a Glance), March 2023. Slide 10 (Cost Savings Remain in Focus) Source: Company financial data as of June 30, 2023 unless otherwise noted. 1. Estimated FY’23 G&A run-rate may be impacted by financial performance and actual results may vary materially. 2. Represents management’s expectations and actual results may differ materially. Slide 11 (Liquidity and Financing Support our Strategic Objectives) Source: Company financial data as of June 30, 2023 unless otherwise noted. 1. Recourse leverage ratio at June 30, 2023 is defined as recourse debt at Redwood exclusive of other liabilities, divided by tangible stockholders' equity. Recourse debt excludes $9.1 billion of consolidated securitization debt (ABS issued and servicer advance financing) and other debt that is non-recourse to Redwood, and tangible stockholders' equity excludes $58 million of goodwill and intangible assets. 2. As of June 30, 2023, $113 million of our August 2023 convertible maturity remained outstanding. $244 million represents our unrestricted cash position as of June 30, 2023 adjusted for payment of this maturity. Slide 13 (Residential Mortgage Banking) Source: Company financial data as of June 30, 2023 unless otherwise noted. 1. Lock volume does not account for potential fallout from pipeline that typically occurs through the lending process. Slide 14 (Business Purpose Mortgage Banking) Source: Company financial data as of June 30, 2023 unless otherwise noted. 1. Composition percentages are based on unpaid principal balance. Slide 15 (Business Purpose Lending – Market Trends) Source: Company financial data as of June 30, 2023 unless otherwise noted. 1. Source: John Burns Research and Consulting, LLC. Data subject to revisions. Data through December 31, 2022. 2. Source: National Association of Realtors, Bloomberg, Piper Sandler.
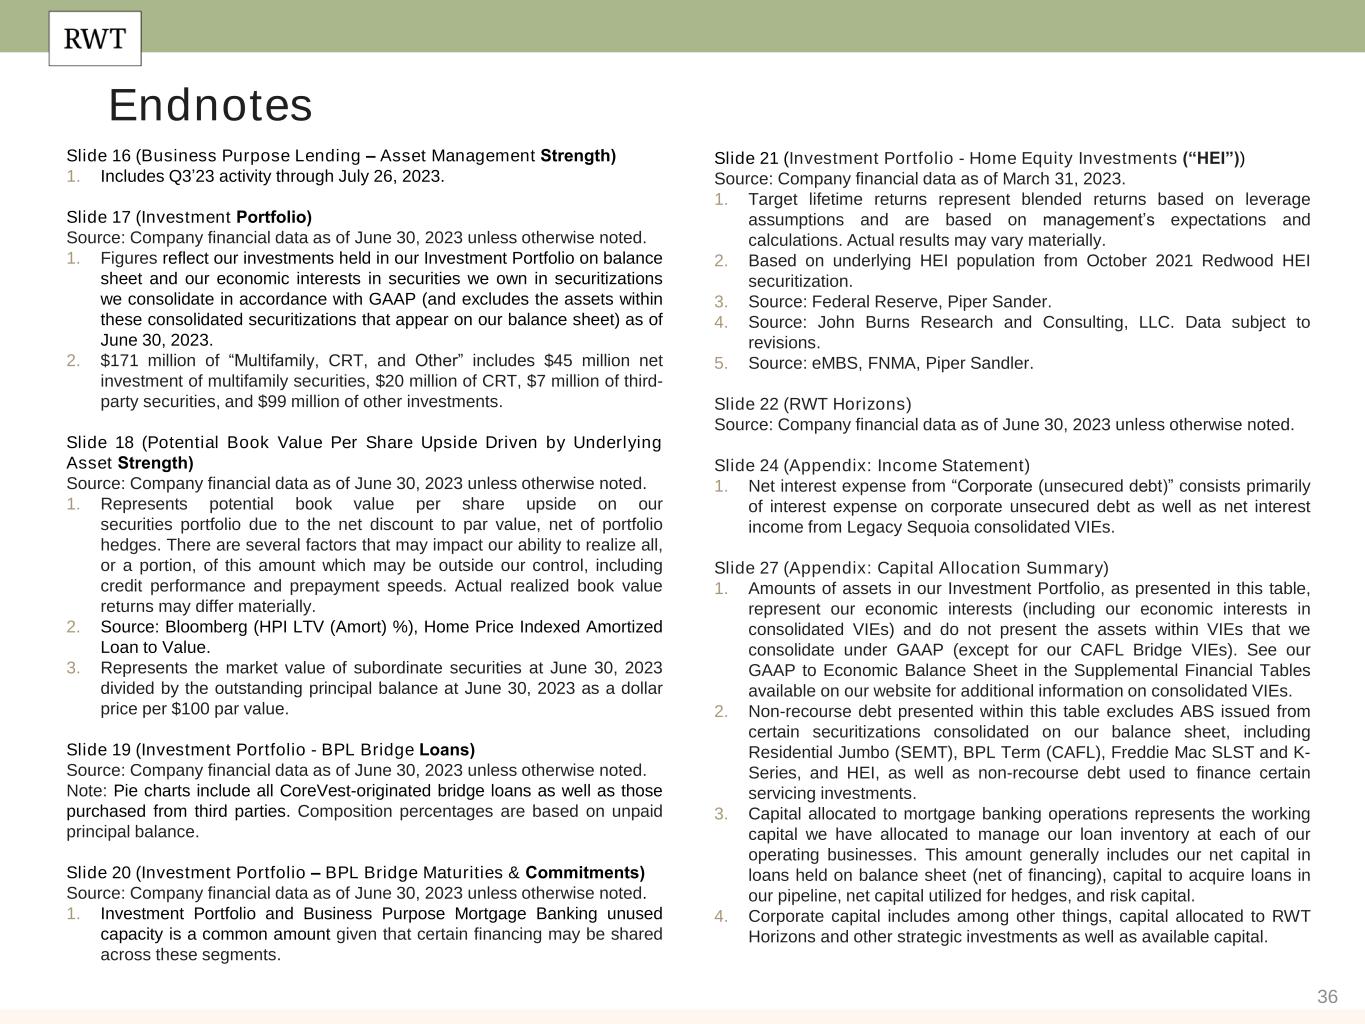
36 Endnotes Slide 16 (Business Purpose Lending – Asset Management Strength) 1. Includes Q3’23 activity through July 26, 2023. Slide 17 (Investment Portfolio) Source: Company financial data as of June 30, 2023 unless otherwise noted. 1. Figures reflect our investments held in our Investment Portfolio on balance sheet and our economic interests in securities we own in securitizations we consolidate in accordance with GAAP (and excludes the assets within these consolidated securitizations that appear on our balance sheet) as of June 30, 2023. 2. $171 million of “Multifamily, CRT, and Other” includes $45 million net investment of multifamily securities, $20 million of CRT, $7 million of third- party securities, and $99 million of other investments. Slide 18 (Potential Book Value Per Share Upside Driven by Underlying Asset Strength) Source: Company financial data as of June 30, 2023 unless otherwise noted. 1. Represents potential book value per share upside on our securities portfolio due to the net discount to par value, net of portfolio hedges. There are several factors that may impact our ability to realize all, or a portion, of this amount which may be outside our control, including credit performance and prepayment speeds. Actual realized book value returns may differ materially. 2. Source: Bloomberg (HPI LTV (Amort) %), Home Price Indexed Amortized Loan to Value. 3. Represents the market value of subordinate securities at June 30, 2023 divided by the outstanding principal balance at June 30, 2023 as a dollar price per $100 par value. Slide 19 (Investment Portfolio - BPL Bridge Loans) Source: Company financial data as of June 30, 2023 unless otherwise noted. Note: Pie charts include all CoreVest-originated bridge loans as well as those purchased from third parties. Composition percentages are based on unpaid principal balance. Slide 20 (Investment Portfolio – BPL Bridge Maturities & Commitments) Source: Company financial data as of June 30, 2023 unless otherwise noted. 1. Investment Portfolio and Business Purpose Mortgage Banking unused capacity is a common amount given that certain financing may be shared across these segments. Slide 21 (Investment Portfolio - Home Equity Investments (“HEI”)) Source: Company financial data as of March 31, 2023. 1. Target lifetime returns represent blended returns based on leverage assumptions and are based on management’s expectations and calculations. Actual results may vary materially. 2. Based on underlying HEI population from October 2021 Redwood HEI securitization. 3. Source: Federal Reserve, Piper Sander. 4. Source: John Burns Research and Consulting, LLC. Data subject to revisions. 5. Source: eMBS, FNMA, Piper Sandler. Slide 22 (RWT Horizons) Source: Company financial data as of June 30, 2023 unless otherwise noted. Slide 24 (Appendix: Income Statement) 1. Net interest expense from “Corporate (unsecured debt)” consists primarily of interest expense on corporate unsecured debt as well as net interest income from Legacy Sequoia consolidated VIEs. Slide 27 (Appendix: Capital Allocation Summary) 1. Amounts of assets in our Investment Portfolio, as presented in this table, represent our economic interests (including our economic interests in consolidated VIEs) and do not present the assets within VIEs that we consolidate under GAAP (except for our CAFL Bridge VIEs). See our GAAP to Economic Balance Sheet in the Supplemental Financial Tables available on our website for additional information on consolidated VIEs. 2. Non-recourse debt presented within this table excludes ABS issued from certain securitizations consolidated on our balance sheet, including Residential Jumbo (SEMT), BPL Term (CAFL), Freddie Mac SLST and K- Series, and HEI, as well as non-recourse debt used to finance certain servicing investments. 3. Capital allocated to mortgage banking operations represents the working capital we have allocated to manage our loan inventory at each of our operating businesses. This amount generally includes our net capital in loans held on balance sheet (net of financing), capital to acquire loans in our pipeline, net capital utilized for hedges, and risk capital. 4. Corporate capital includes among other things, capital allocated to RWT Horizons and other strategic investments as well as available capital.

37 Endnotes Slide 28 (Appendix: Mortgage Banking Key Results) 1. EAD Net Contribution and EAD Net Contribution Return on Capital are non-GAAP measures. Please refer to Non-GAAP Measures in the Endnotes section of this presentation for additional information on these measures. 2. Capital utilized for business purpose mortgage banking operations includes platform premium. Slide 29 (Appendix: Investment Portfolio Key Results) 1. EAD Net Contribution and EAD Net Contribution Return on Capital are non-GAAP measures. Please refer to Non-GAAP Measures in the Endnotes section of this presentation for more information on these measures. 2. Recourse Leverage ratio is calculated as Secured recourse debt balances divided by Capital invested, as presented within this table. Slide 30 (Appendix: Recourse Debt Balances) 1. Non-marginable debt and marginable debt refers to whether such debt is subject to margin calls based solely on the lender’s determination in its discretion of the market value of underlying collateral that is non- delinquent. Non-marginable debt may be subject to a margin call due to delinquency or another credit event related to the mortgage or security being financed, a decline in the value of the underlying asset securing the collateral, an extended dwell time (i.e., period of time financed using a particular financing facility) for certain types of loans, or a change in the interest rate of a specified reference security relative to a base interest rate amount, among other reasons. 2. Average borrowing cost represents the weighted average contractual cost of recourse debt outstanding at the end of each period presented and does not include deferred issuance costs or debt discounts.