
1 Q4 2022 Redwood Review February 9, 2023 Exhibit 99.3
2 Cautionary Statement; Forward-Looking Statements This presentation contains forward-looking statements, including statements regarding our 2023 forward outlook, statements related to available and potential sources of liquidity, estimates of upside and potential earnings in our investment portfolio from embedded discounts to par value on securities, our projected run-rate G&A expense and the impact on overall profitability, target yields on investment opportunities and estimated forward-looking economic yields on our Investment Portfolio. Forward-looking statements involve numerous risks and uncertainties. Our actual results may differ from our beliefs, expectations, estimates, and projections and, consequently, you should not rely on these forward-looking statements as predictions of future events. Forward-looking statements are not historical in nature and can be identified by words such as “anticipate,” “estimate,” “will,” “should,” “expect,” “believe,” “intend,” “seek,” “plan” and similar expressions or their negative forms, or by references to strategy, plans, or intentions. These forward-looking statements are subject to risks and uncertainties, including, among other things, those described in the Company’s Annual Report on Form 10-K for the year ended December 31, 2021, the Company’s Current Report on Form 8-K filed with the SEC on January 9, 2023 and any subsequent Quarterly Reports on Form 10-Q and Annual Reports on Form 10-K under the caption “Risk Factors.” Other risks, uncertainties, and factors that could cause actual results to differ materially from those projected may be described from time to time in reports the Company files with the Securities and Exchange Commission, including reports on Form 8-K. In addition, the Company’s financial statement audit for the year ended December 31, 2022 is not yet complete, and the quarterly and full year 2022 results reported herein are unaudited and may vary from our audited financial results for the year ended December 31, 2022, presented in the Company’s Annual Report on Form 10-K for 2022 that will be filed with the SEC. The Company’s 2022 annual financial statement audit is scheduled to conclude in late February 2023 in connection with the Company’s Form 10-K filing and it should be noted, and considered in the context of the “Risk Factor” set forth in the Company’s Current Report on Form 8-K filed with the SEC on January 9, 2023, that the year-end 2022 book value reported herein includes a $0.37 per share deferred tax asset. As the Company’s 2022 financial statement audit is completed, the Company will determine whether, under GAAP, any non-cash valuation allowance should be applied against the Company’s deferred tax assets, which would reduce the value of these deferred tax assets and correspondingly result in a lower level of earnings and book value being reported in the Company’s Annual Report on Form 10-K for 2022 than is reported herein for the Company’s fourth quarter and full year 2022. Additionally, this presentation contains estimates and information concerning our industry, including market size and growth rates of the markets in which we participate, that are based on industry publications and reports. This information involves many assumptions and limitations, and you are cautioned not to give undue weight to these estimates. We have not independently verified the accuracy or completeness of the data contained in these industry publications and reports. The industry in which we operate is subject to a high degree of uncertainty and risk due to a variety of factors, including those referred to above, that could cause results to differ materially from those expressed in these publications and reports.
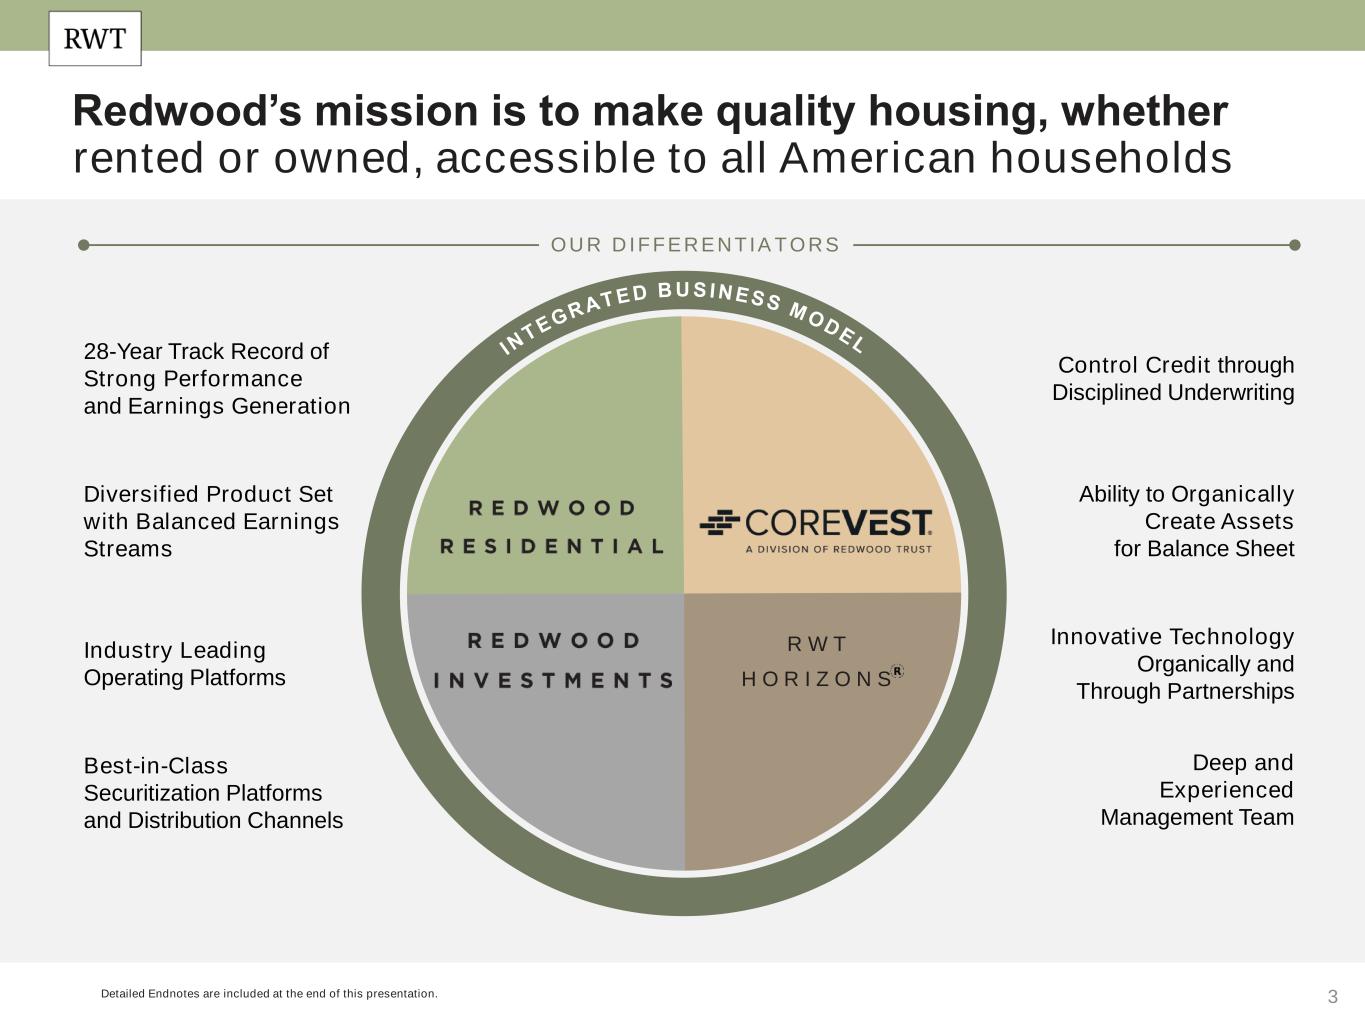
3 Redwood’s mission is to make quality housing, whether rented or owned, accessible to all American households Detailed Endnotes are included at the end of this presentation. 28-Year Track Record of Strong Performance and Earnings Generation Diversified Product Set with Balanced Earnings Streams Industry Leading Operating Platforms Best-in-Class Securitization Platforms and Distribution Channels Control Credit through Disciplined Underwriting Ability to Organically Create Assets for Balance Sheet Innovative Technology Organically and Through Partnerships Deep and Experienced Management Team O U R D I FFER EN TIAT O R S R W T H O R I Z O N S
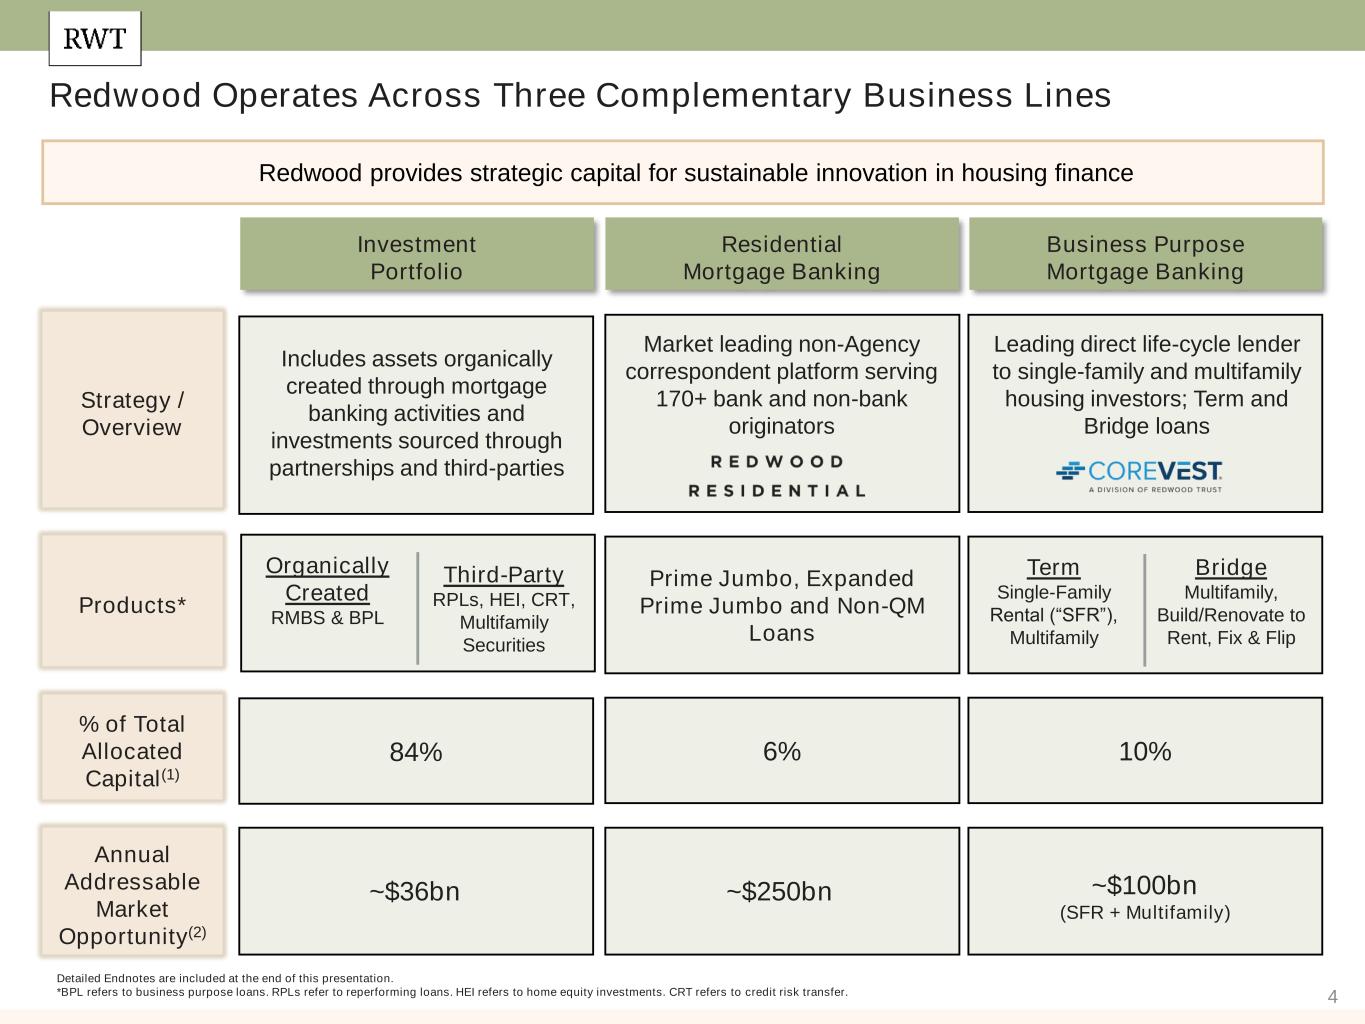
4 Detailed Endnotes are included at the end of this presentation. *BPL refers to business purpose loans. RPLs refer to reperforming loans. HEI refers to home equity investments. CRT refers to credit risk transfer. Redwood Operates Across Three Complementary Business Lines Redwood provides strategic capital for sustainable innovation in housing finance Residential Mortgage Banking Business Purpose Mortgage Banking Strategy / Overview ~$250bn ~$100bn (SFR + Multifamily) 6% 10% % of Total Allocated Capital(1) Annual Addressable Market Opportunity(2) Prime Jumbo, Expanded Prime Jumbo and Non-QM Loans Products* Market leading non-Agency correspondent platform serving 170+ bank and non-bank originators Leading direct life-cycle lender to single-family and multifamily housing investors; Term and Bridge loans Investment Portfolio ~$36bn 84% Includes assets organically created through mortgage banking activities and investments sourced through partnerships and third-parties Term Single-Family Rental (“SFR”), Multifamily Bridge Multifamily, Build/Renovate to Rent, Fix & Flip Organically Created RMBS & BPL Third-Party RPLs, HEI, CRT, Multifamily Securities
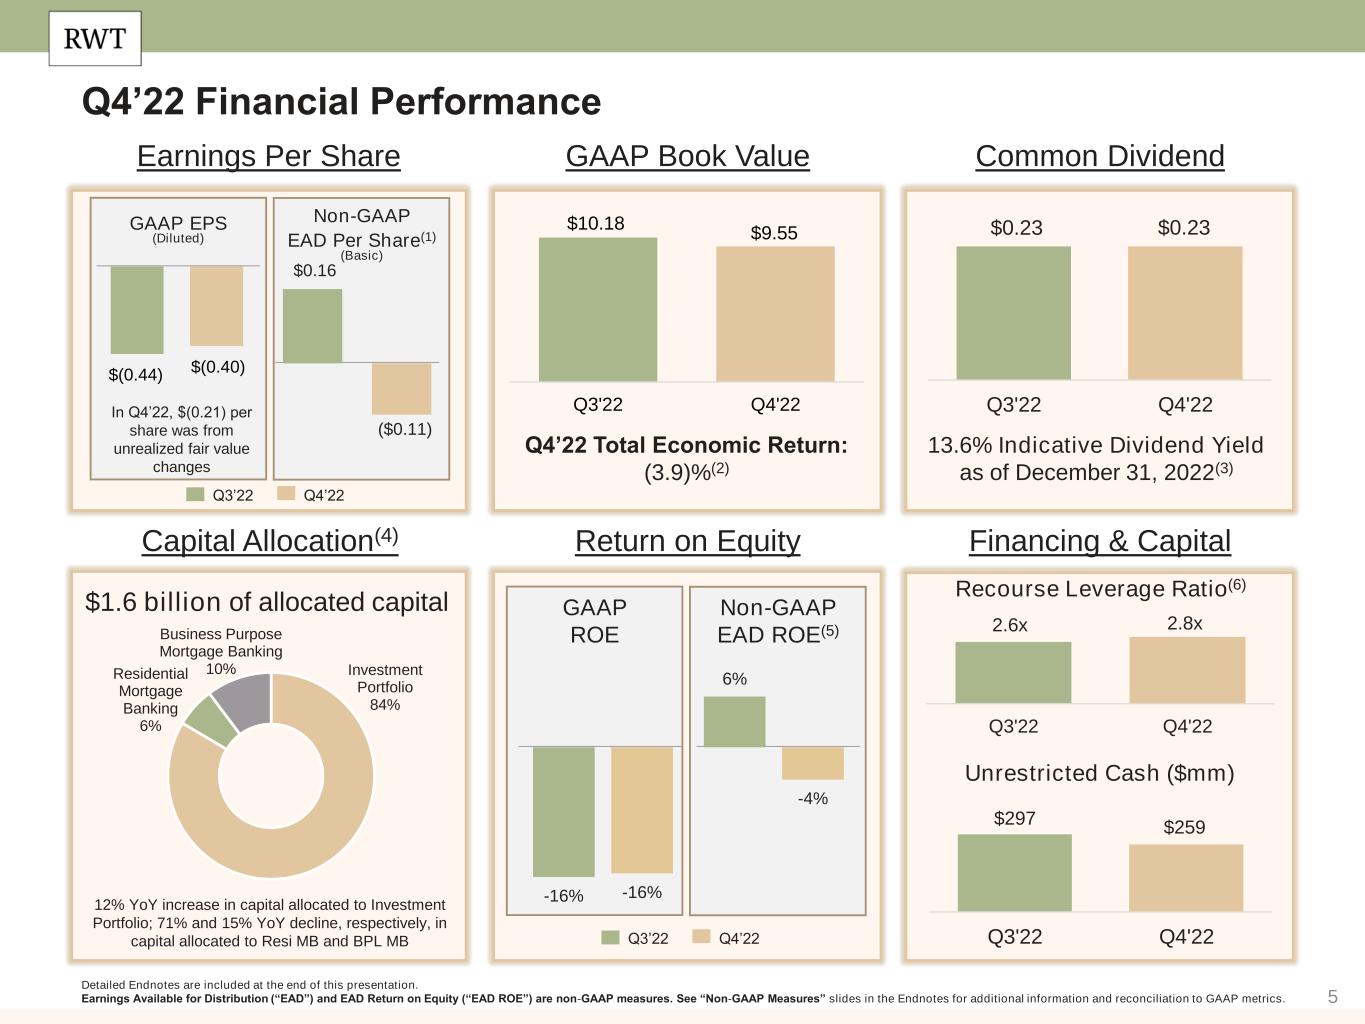
5 Q4’22 Financial Performance $1.6 billion of allocated capital Detailed Endnotes are included at the end of this presentation. Earnings Available for Distribution (“EAD”) and EAD Return on Equity (“EAD ROE”) are non-GAAP measures. See “Non-GAAP Measures” slides in the Endnotes for additional information and reconciliation to GAAP metrics. Earnings Per Share GAAP Book Value Common Dividend Capital Allocation(4) Return on Equity Financing & Capital Recourse Leverage Ratio(6) Unrestricted Cash ($mm) Q4’22 Total Economic Return: (3.9)%(2) 13.6% Indicative Dividend Yield as of December 31, 2022(3) GAAP ROE Non-GAAP EAD ROE(5) In Q4’22, $(0.21) per share was from unrealized fair value changes GAAP EPS (Diluted) Non-GAAP EAD Per Share(1) (Basic) $10.18 $9.55 Q3'22 Q4'22 $0.23 $0.23 Q3'22 Q4'22 2.6x 2.8x Q3'22 Q4'22 $297 $259 Q3'22 Q4'22 $0.16 ($0.11) $(0.44) $(0.40) Investment Portfolio 84% Residential Mortgage Banking 6% Business Purpose Mortgage Banking 10% Q3’22 Q4’22 Q3’22 Q4’22 12% YoY increase in capital allocated to Investment Portfolio; 71% and 15% YoY decline, respectively, in capital allocated to Resi MB and BPL MB -16% 6% -16% -4%
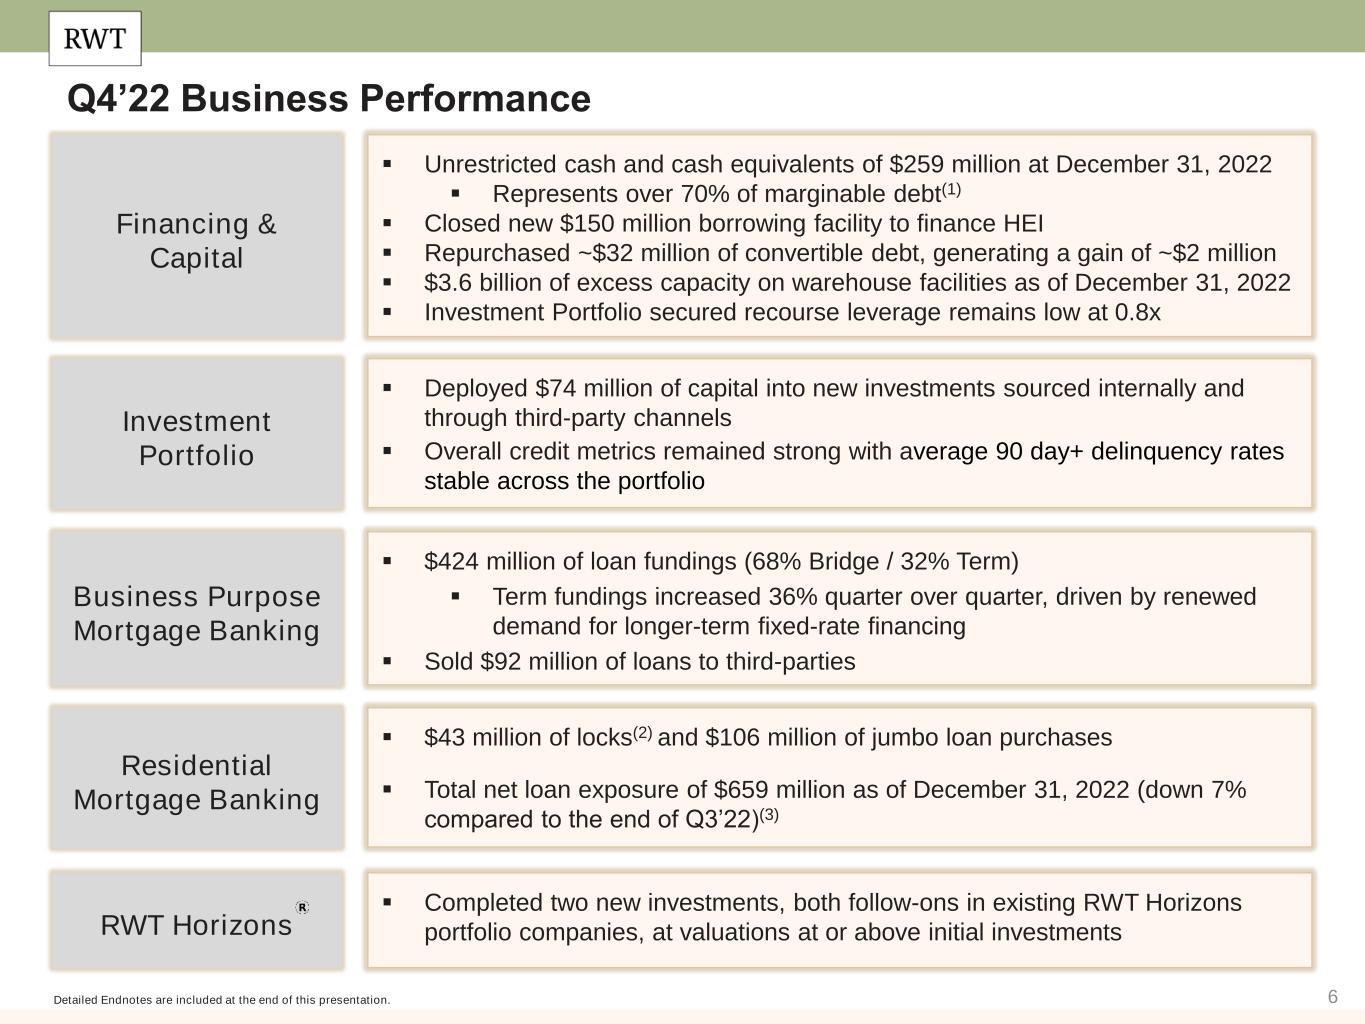
6 Q4’22 Business Performance Detailed Endnotes are included at the end of this presentation. ▪ $43 million of locks(2) and $106 million of jumbo loan purchases ▪ Total net loan exposure of $659 million as of December 31, 2022 (down 7% compared to the end of Q3’22)(3) Residential Mortgage Banking ▪ Completed two new investments, both follow-ons in existing RWT Horizons portfolio companies, at valuations at or above initial investmentsRWT Horizons ▪ $424 million of loan fundings (68% Bridge / 32% Term) ▪ Term fundings increased 36% quarter over quarter, driven by renewed demand for longer-term fixed-rate financing ▪ Sold $92 million of loans to third-parties Business Purpose Mortgage Banking ▪ Deployed $74 million of capital into new investments sourced internally and through third-party channels ▪ Overall credit metrics remained strong with average 90 day+ delinquency rates stable across the portfolio Investment Portfolio ▪ Unrestricted cash and cash equivalents of $259 million at December 31, 2022 ▪ Represents over 70% of marginable debt(1) ▪ Closed new $150 million borrowing facility to finance HEI ▪ Repurchased ~$32 million of convertible debt, generating a gain of ~$2 million ▪ $3.6 billion of excess capacity on warehouse facilities as of December 31, 2022 ▪ Investment Portfolio secured recourse leverage remains low at 0.8x Financing & Capital
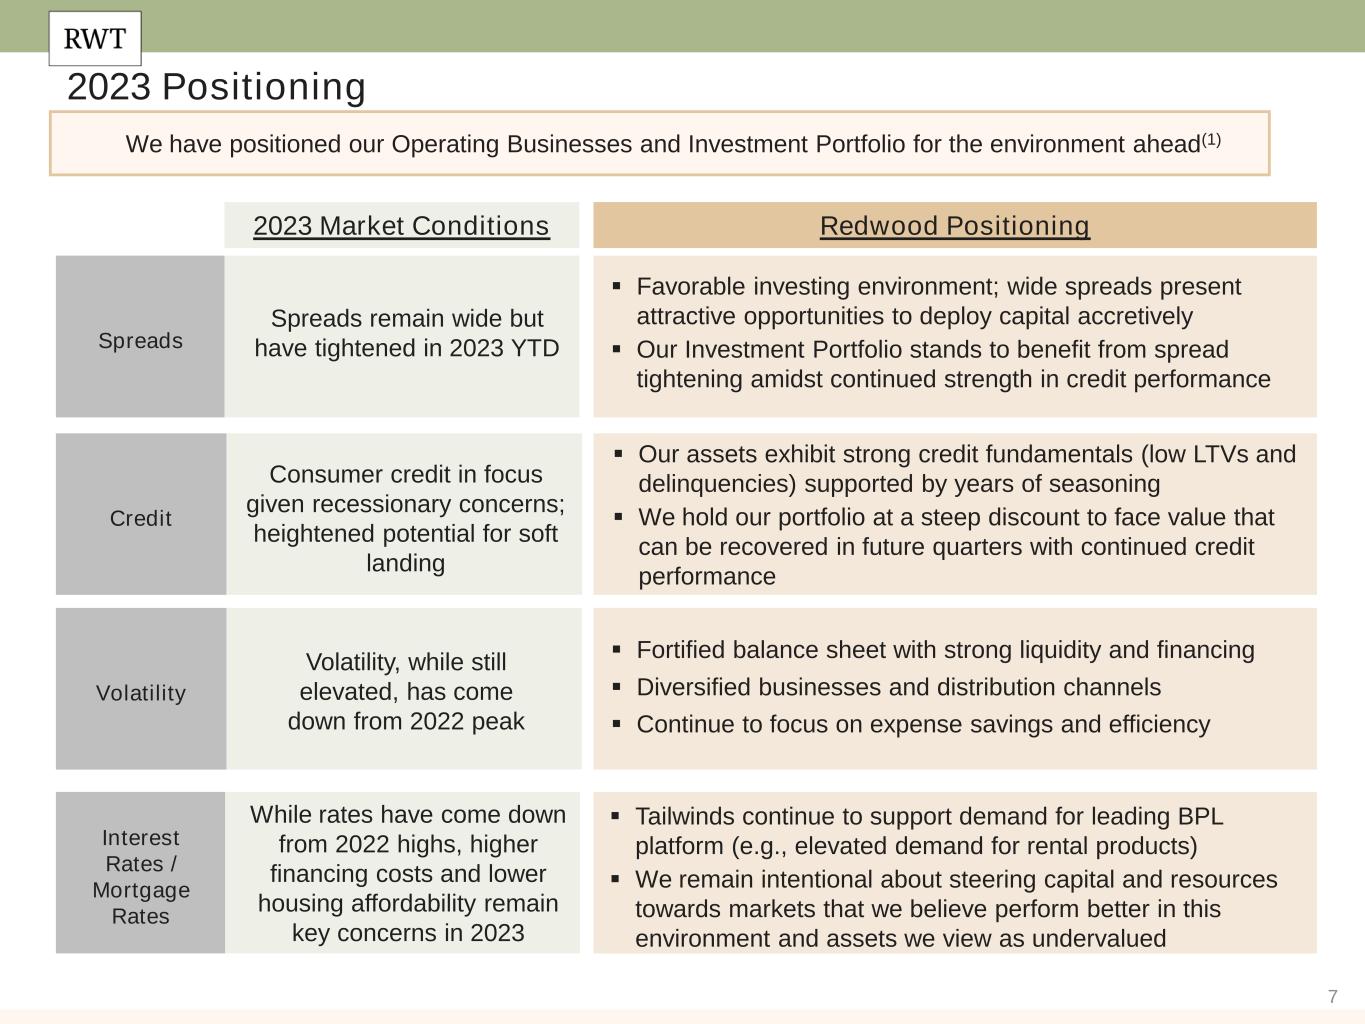
7 2023 Positioning We have positioned our Operating Businesses and Investment Portfolio for the environment ahead(1) 2023 Market Conditions Spreads Credit Volatility Interest Rates / Mortgage Rates Volatility, while still elevated, has come down from 2022 peak Redwood Positioning ▪ Favorable investing environment; wide spreads present attractive opportunities to deploy capital accretively ▪ Our Investment Portfolio stands to benefit from spread tightening amidst continued strength in credit performance ▪ Our assets exhibit strong credit fundamentals (low LTVs and delinquencies) supported by years of seasoning ▪ We hold our portfolio at a steep discount to face value that can be recovered in future quarters with continued credit performance ▪ Fortified balance sheet with strong liquidity and financing ▪ Diversified businesses and distribution channels ▪ Continue to focus on expense savings and efficiency ▪ Tailwinds continue to support demand for leading BPL platform (e.g., elevated demand for rental products) ▪ We remain intentional about steering capital and resources towards markets that we believe perform better in this environment and assets we view as undervalued Spreads remain wide but have tightened in 2023 YTD Consumer credit in focus given recessionary concerns; heightened potential for soft landing While rates have come down from 2022 highs, higher financing costs and lower housing affordability remain key concerns in 2023
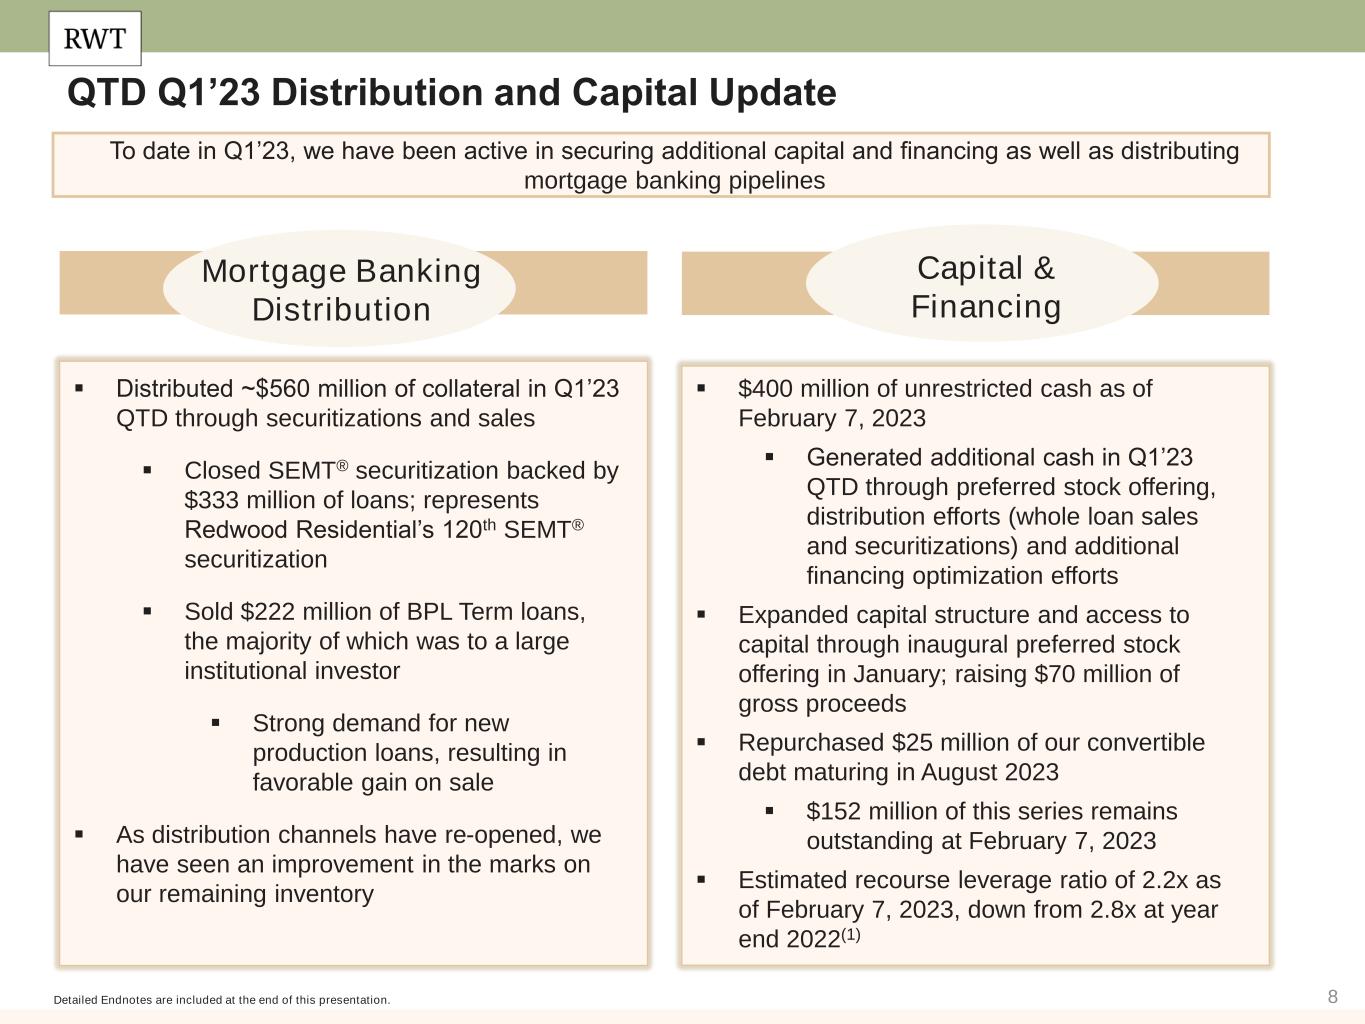
8 QTD Q1’23 Distribution and Capital Update Detailed Endnotes are included at the end of this presentation. To date in Q1’23, we have been active in securing additional capital and financing as well as distributing mortgage banking pipelines Mortgage Banking Distribution ▪ Distributed ~$560 million of collateral in Q1’23 QTD through securitizations and sales ▪ Closed SEMT® securitization backed by $333 million of loans; represents Redwood Residential’s 120th SEMT® securitization ▪ Sold $222 million of BPL Term loans, the majority of which was to a large institutional investor ▪ Strong demand for new production loans, resulting in favorable gain on sale ▪ As distribution channels have re-opened, we have seen an improvement in the marks on our remaining inventory ▪ $400 million of unrestricted cash as of February 7, 2023 ▪ Generated additional cash in Q1’23 QTD through preferred stock offering, distribution efforts (whole loan sales and securitizations) and additional financing optimization efforts ▪ Expanded capital structure and access to capital through inaugural preferred stock offering in January; raising $70 million of gross proceeds ▪ Repurchased $25 million of our convertible debt maturing in August 2023 ▪ $152 million of this series remains outstanding at February 7, 2023 ▪ Estimated recourse leverage ratio of 2.2x as of February 7, 2023, down from 2.8x at year end 2022(1) Capital & Financing
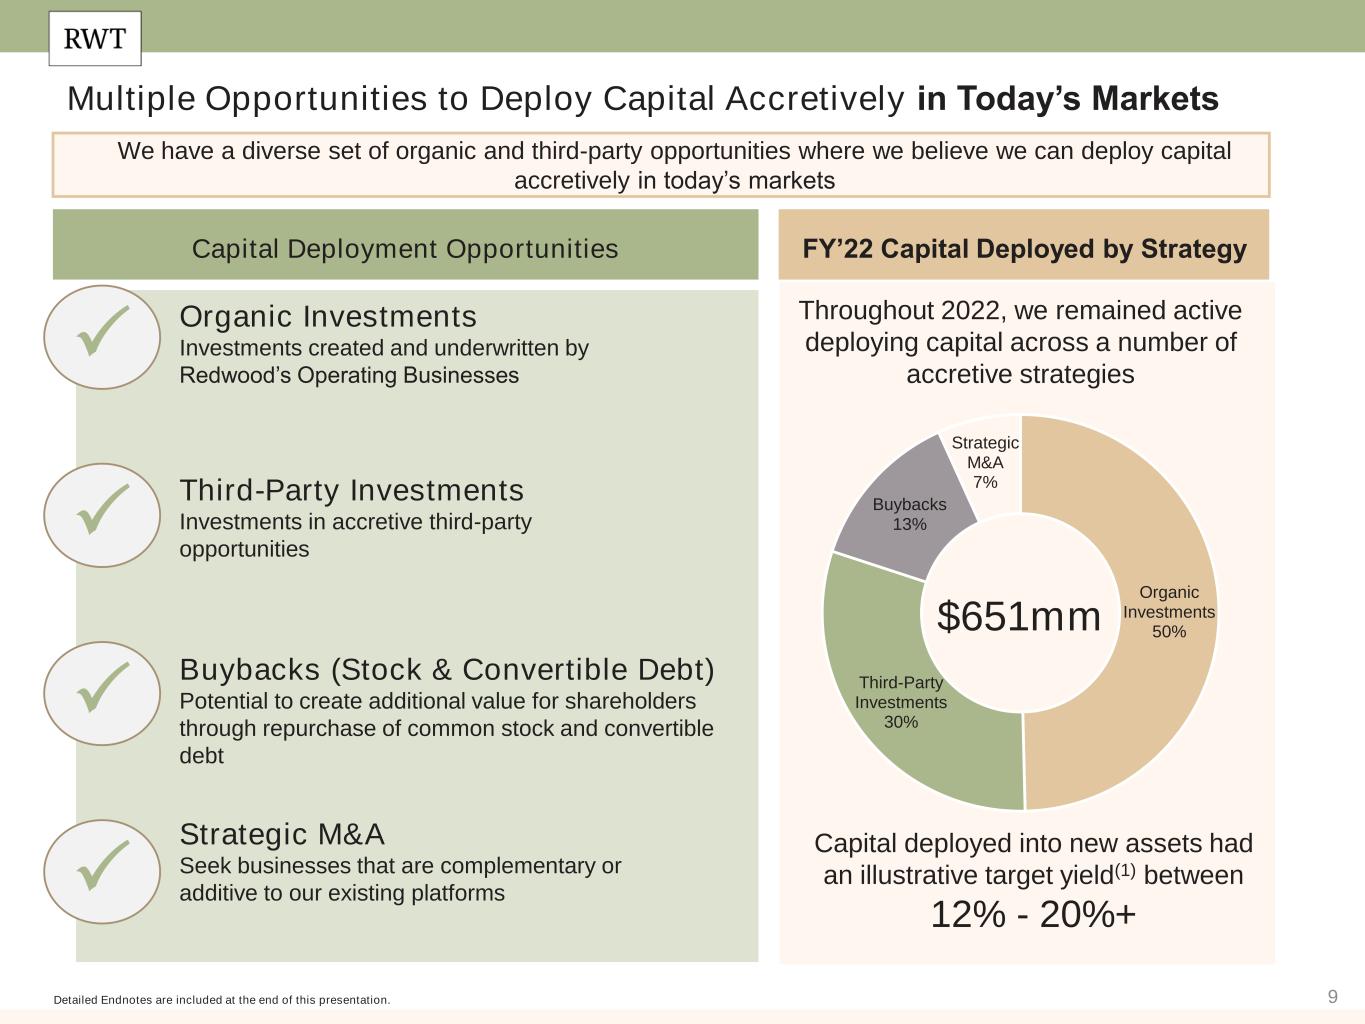
9 Multiple Opportunities to Deploy Capital Accretively in Today’s Markets Detailed Endnotes are included at the end of this presentation. We have a diverse set of organic and third-party opportunities where we believe we can deploy capital accretively in today’s markets P P P P Capital Deployment Opportunities Organic Investments Investments created and underwritten by Redwood’s Operating Businesses Third-Party Investments Investments in accretive third-party opportunities Buybacks (Stock & Convertible Debt) Potential to create additional value for shareholders through repurchase of common stock and convertible debt Strategic M&A Seek businesses that are complementary or additive to our existing platforms FY’22 Capital Deployed by Strategy $651mm Throughout 2022, we remained active deploying capital across a number of accretive strategies Capital deployed into new assets had an illustrative target yield(1) between 12% - 20%+ Organic Investments 50% Third-Party Investments 30% Buybacks 13% Strategic M&A 7%
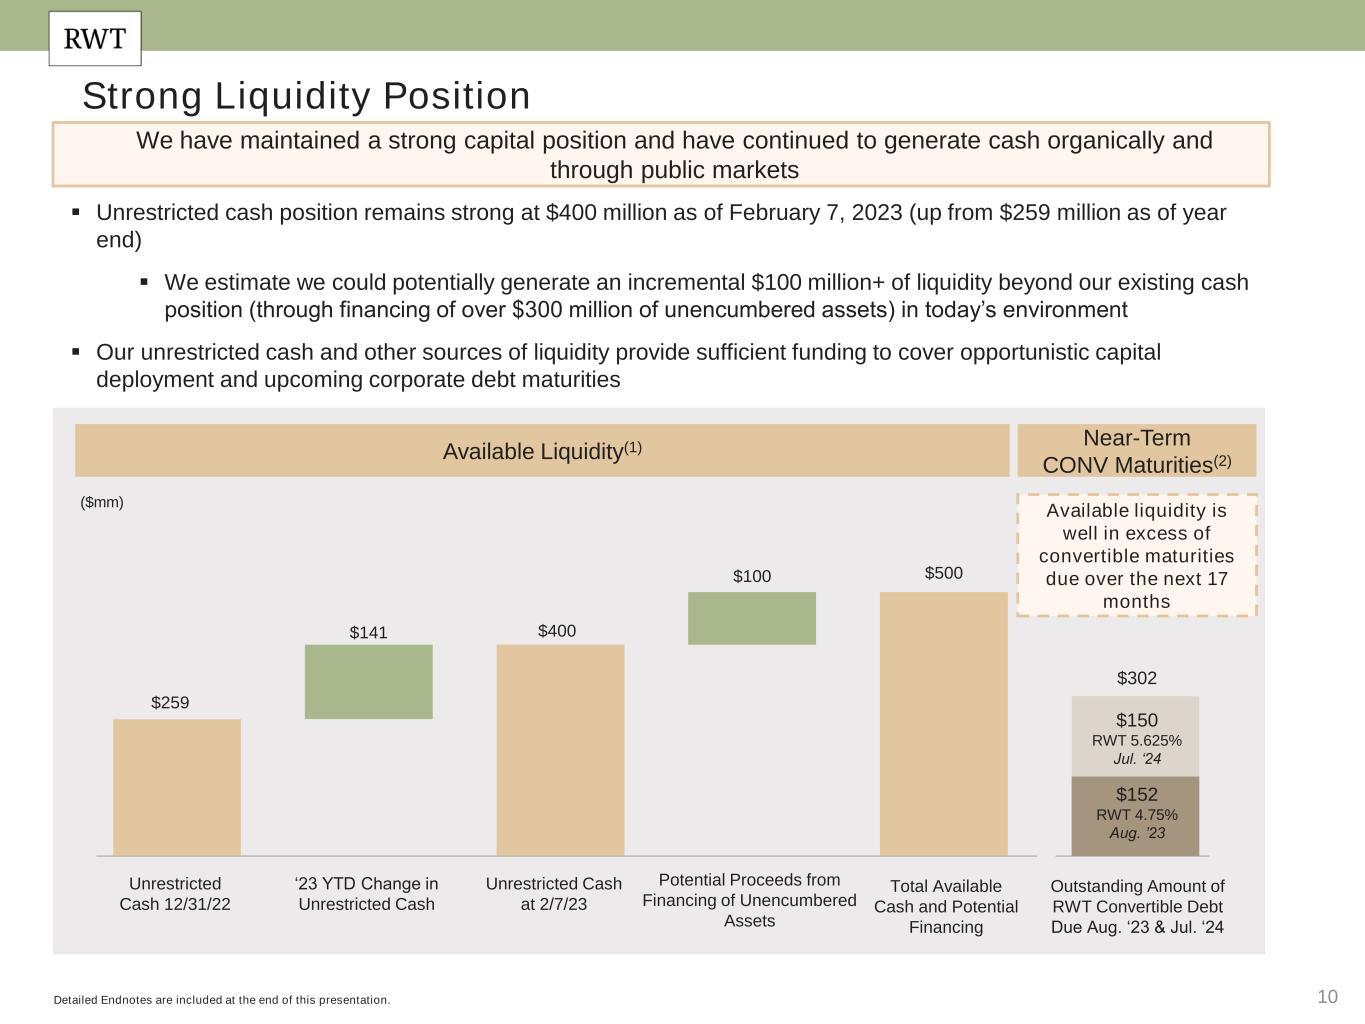
10 Strong Liquidity Position Available Liquidity(1) We have maintained a strong capital position and have continued to generate cash organically and through public markets Detailed Endnotes are included at the end of this presentation. ($mm) ▪ Unrestricted cash position remains strong at $400 million as of February 7, 2023 (up from $259 million as of year end) ▪ We estimate we could potentially generate an incremental $100 million+ of liquidity beyond our existing cash position (through financing of over $300 million of unencumbered assets) in today’s environment ▪ Our unrestricted cash and other sources of liquidity provide sufficient funding to cover opportunistic capital deployment and upcoming corporate debt maturities Near-Term CONV Maturities(2) Available liquidity is well in excess of convertible maturities due over the next 17 months Unrestricted Cash 12/31/22 ‘23 YTD Change in Unrestricted Cash Unrestricted Cash at 2/7/23 Potential Proceeds from Financing of Unencumbered Assets Total Available Cash and Potential Financing Outstanding Amount of RWT Convertible Debt Due Aug. ‘23 & Jul. ‘24 $302 $259 $400 $500 $141 $100 $150 RWT 5.625% Jul. ‘24 $152 RWT 4.75% Aug. ’23
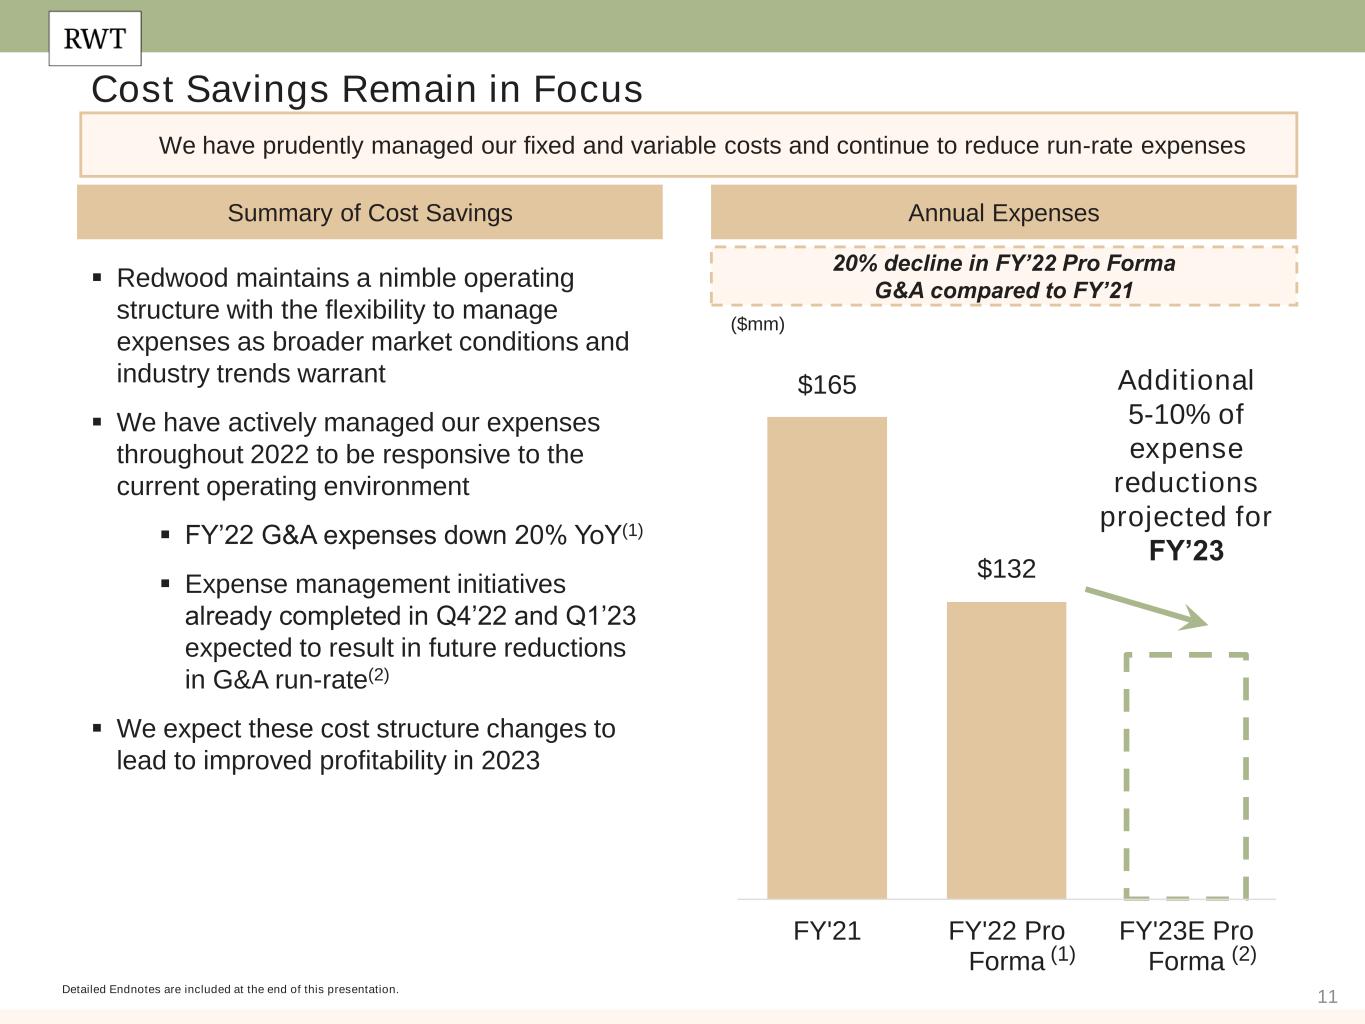
11 Cost Savings Remain in Focus We have prudently managed our fixed and variable costs and continue to reduce run-rate expenses Detailed Endnotes are included at the end of this presentation. Annual Expenses 20% decline in FY’22 Pro Forma G&A compared to FY’21 ▪ Redwood maintains a nimble operating structure with the flexibility to manage expenses as broader market conditions and industry trends warrant ▪ We have actively managed our expenses throughout 2022 to be responsive to the current operating environment ▪ FY’22 G&A expenses down 20% YoY(1) ▪ Expense management initiatives already completed in Q4’22 and Q1’23 expected to result in future reductions in G&A run-rate(2) ▪ We expect these cost structure changes to lead to improved profitability in 2023 ($mm) $165 $132 FY'21 FY'22 Pro Forma FY'23E Pro Forma Summary of Cost Savings Additional 5-10% of expense reductions projected for FY’23 (1) (2)
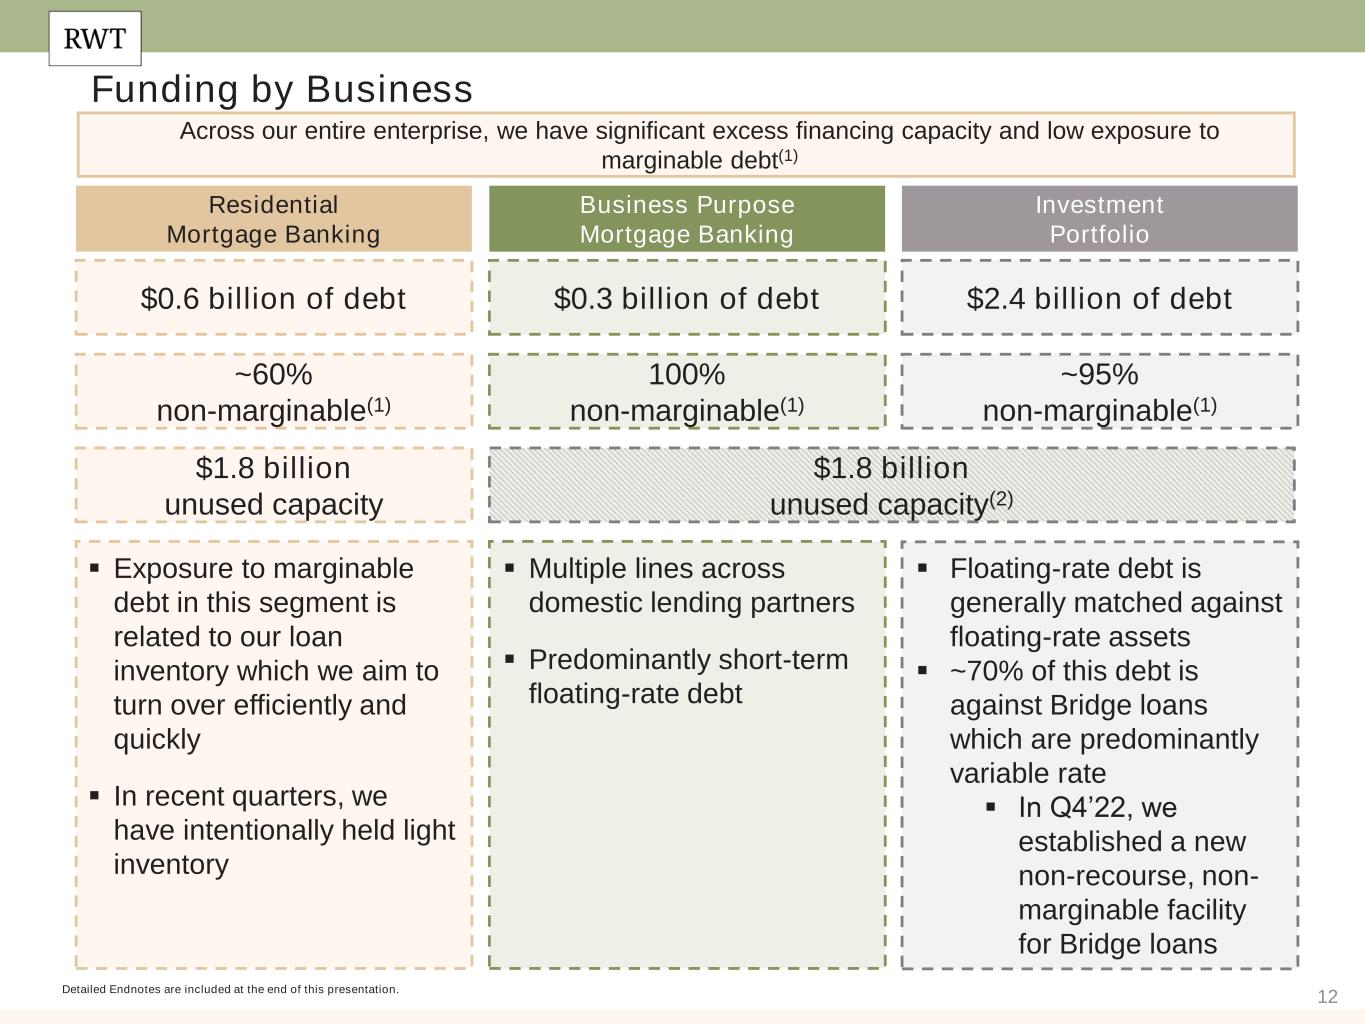
12 Funding by Business Across our entire enterprise, we have significant excess financing capacity and low exposure to marginable debt(1) Detailed Endnotes are included at the end of this presentation. Residential Mortgage Banking Business Purpose Mortgage Banking ~60% non-marginable(1) 100% non-marginable(1) $1.8 billion unused capacity $1.8 billion unused capacity(2) ▪ Exposure to marginable debt in this segment is related to our loan inventory which we aim to turn over efficiently and quickly ▪ In recent quarters, we have intentionally held light inventory ▪ Multiple lines across domestic lending partners ▪ Predominantly short-term floating-rate debt $0.6 billion of debt $0.3 billion of debt Investment Portfolio ~95% non-marginable(1) ▪ Floating-rate debt is generally matched against floating-rate assets ▪ ~70% of this debt is against Bridge loans which are predominantly variable rate ▪ In Q4’22, we established a new non-recourse, non- marginable facility for Bridge loans $2.4 billion of debt

13 Investment Portfolio & Operating Businesses
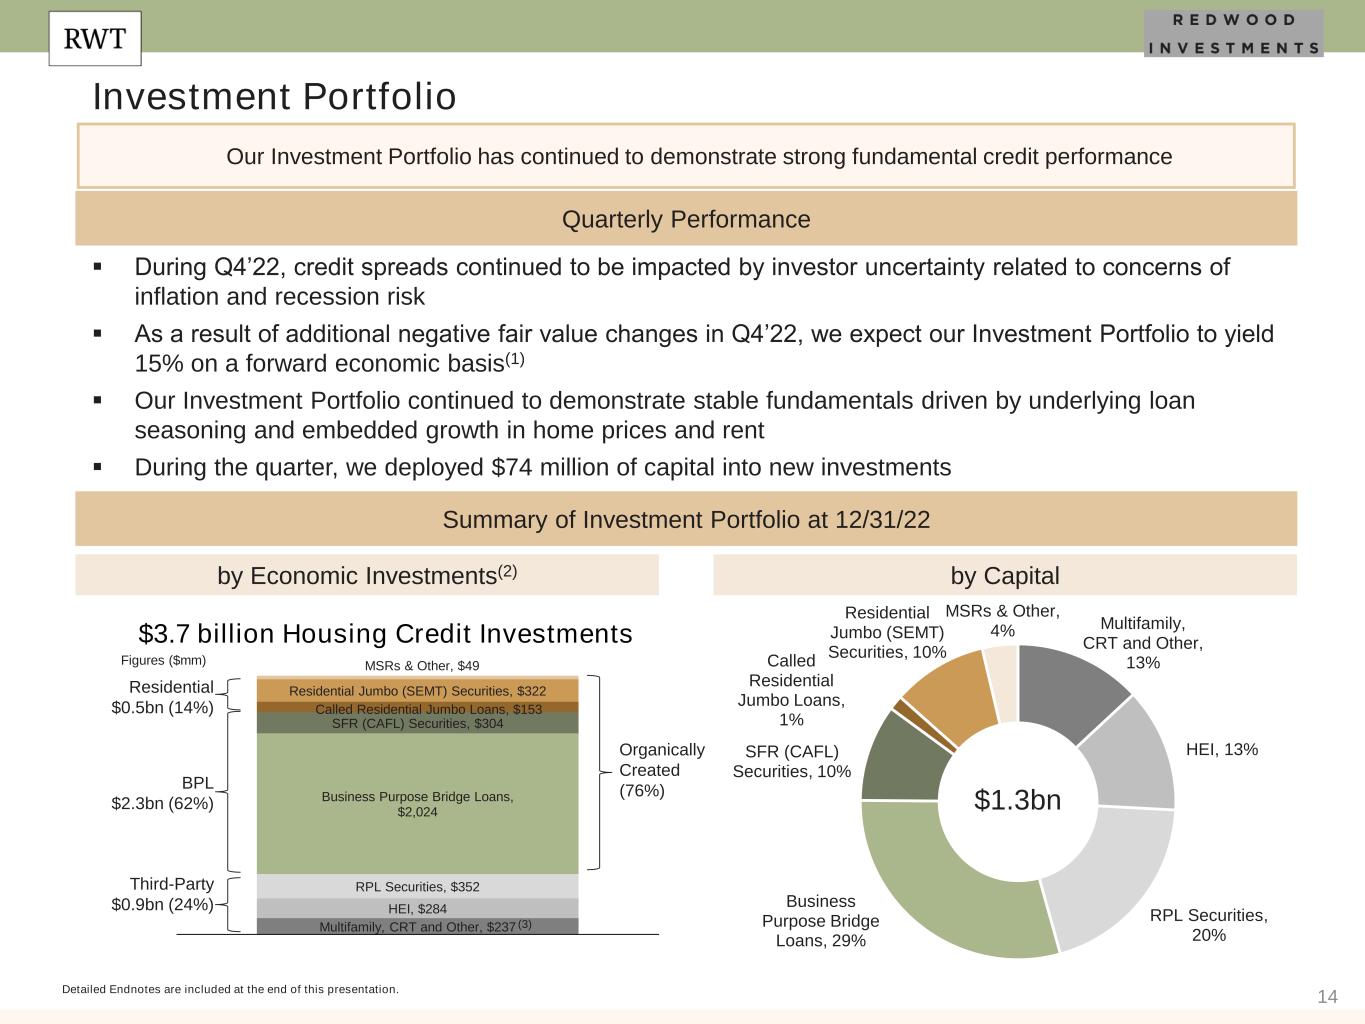
14 Multifamily, CRT and Other, $237 HEI, $284 RPL Securities, $352 Business Purpose Bridge Loans, $2,024 SFR (CAFL) Securities, $304 Called Residential Jumbo Loans, $153 Residential Jumbo (SEMT) Securities, $322 MSRs & Other, $49 Multifamily, CRT and Other, 13% HEI, 13% RPL Securities, 20% Business Purpose Bridge Loans, 29% SFR (CAFL) Securities, 10% Called Residential Jumbo Loans, 1% Residential Jumbo (SEMT) Securities, 10% MSRs & Other, 4% Investment Portfolio Quarterly Performance $3.7 billion Housing Credit Investments Organically Created (76%) Detailed Endnotes are included at the end of this presentation. Our Investment Portfolio has continued to demonstrate strong fundamental credit performance $1.3bn Third-Party $0.9bn (24%) BPL $2.3bn (62%) Residential $0.5bn (14%) Figures ($mm) ▪ During Q4’22, credit spreads continued to be impacted by investor uncertainty related to concerns of inflation and recession risk ▪ As a result of additional negative fair value changes in Q4’22, we expect our Investment Portfolio to yield 15% on a forward economic basis(1) ▪ Our Investment Portfolio continued to demonstrate stable fundamentals driven by underlying loan seasoning and embedded growth in home prices and rent ▪ During the quarter, we deployed $74 million of capital into new investments Summary of Investment Portfolio at 12/31/22 by Economic Investments(2) by Capital (3)
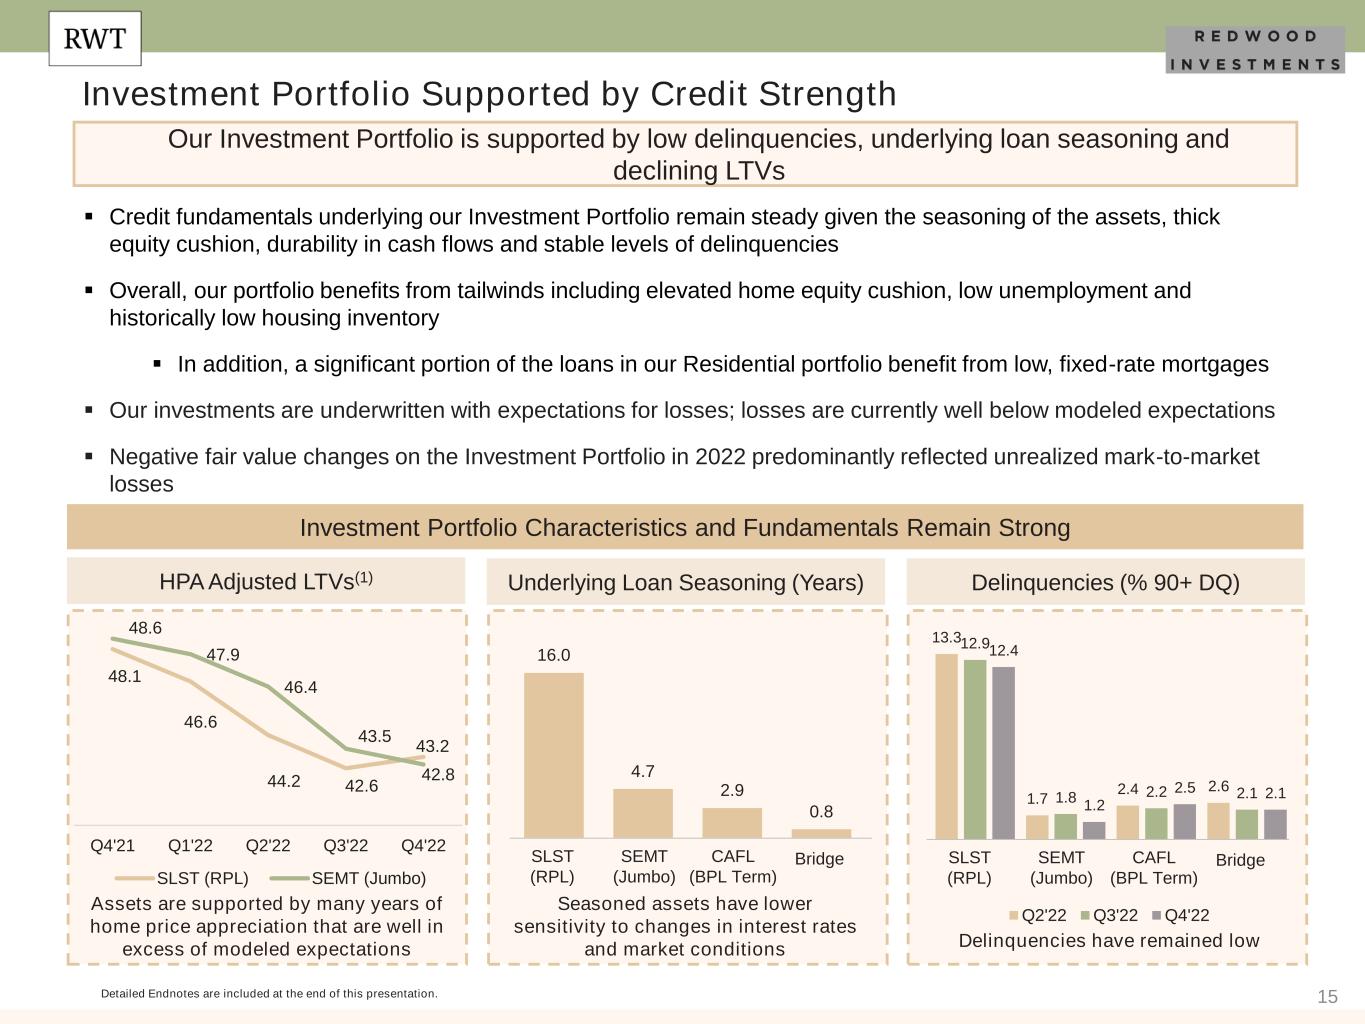
15 Our Investment Portfolio is supported by low delinquencies, underlying loan seasoning and declining LTVs Investment Portfolio Supported by Credit Strength Underlying Loan Seasoning (Years) Delinquencies (% 90+ DQ) Seasoned assets have lower sensitivity to changes in interest rates and market conditions Delinquencies have remained low HPA Adjusted LTVs(1) Assets are supported by many years of home price appreciation that are well in excess of modeled expectations Investment Portfolio Characteristics and Fundamentals Remain Strong ▪ Credit fundamentals underlying our Investment Portfolio remain steady given the seasoning of the assets, thick equity cushion, durability in cash flows and stable levels of delinquencies ▪ Overall, our portfolio benefits from tailwinds including elevated home equity cushion, low unemployment and historically low housing inventory ▪ In addition, a significant portion of the loans in our Residential portfolio benefit from low, fixed-rate mortgages ▪ Our investments are underwritten with expectations for losses; losses are currently well below modeled expectations ▪ Negative fair value changes on the Investment Portfolio in 2022 predominantly reflected unrealized mark-to-market losses Detailed Endnotes are included at the end of this presentation. 48.1 46.6 44.2 42.6 43.2 48.6 47.9 46.4 43.5 42.8 Q4'21 Q1'22 Q2'22 Q3'22 Q4'22 SLST (RPL) SEMT (Jumbo) 16.0 4.7 2.9 0.8 13.3 1.7 2.4 2.6 12.9 1.8 2.2 2.1 12.4 1.2 2.5 2.1 Q2'22 Q3'22 Q4'22 SLST (RPL) SEMT (Jumbo) CAFL (BPL Term) Bridge SLST (RPL) SEMT (Jumbo) CAFL (BPL Term) Bridge
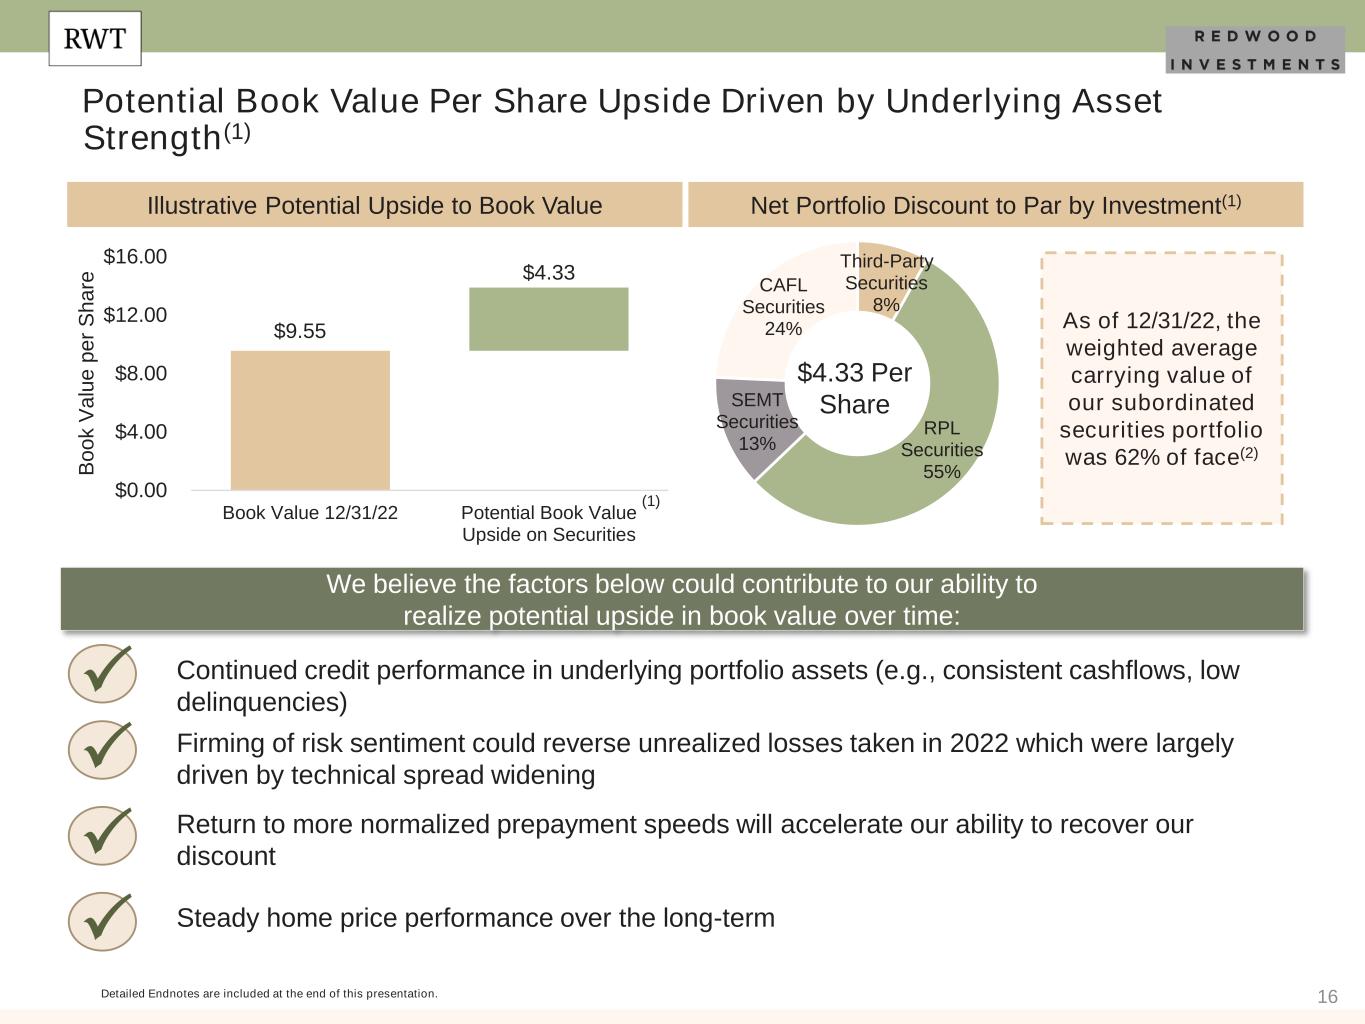
16 (1) Net Portfolio Discount to Par by Investment(1) $4.33 Per Share Illustrative Potential Upside to Book Value P Continued credit performance in underlying portfolio assets (e.g., consistent cashflows, low delinquencies) P Firming of risk sentiment could reverse unrealized losses taken in 2022 which were largely driven by technical spread widening P Return to more normalized prepayment speeds will accelerate our ability to recover our discount P Steady home price performance over the long-term We believe the factors below could contribute to our ability to realize potential upside in book value over time: Detailed Endnotes are included at the end of this presentation. Potential Book Value Per Share Upside Driven by Underlying Asset Strength(1) As of 12/31/22, the weighted average carrying value of our subordinated securities portfolio was 62% of face(2) Third-Party Securities 8% RPL Securities 55% SEMT Securities 13% CAFL Securities 24%$9.55 $4.33 $0.00 $4.00 $8.00 $12.00 $16.00 Book Value 12/31/22 Potential Book Value Upside on Securities B o o k V a lu e p e r S h a re
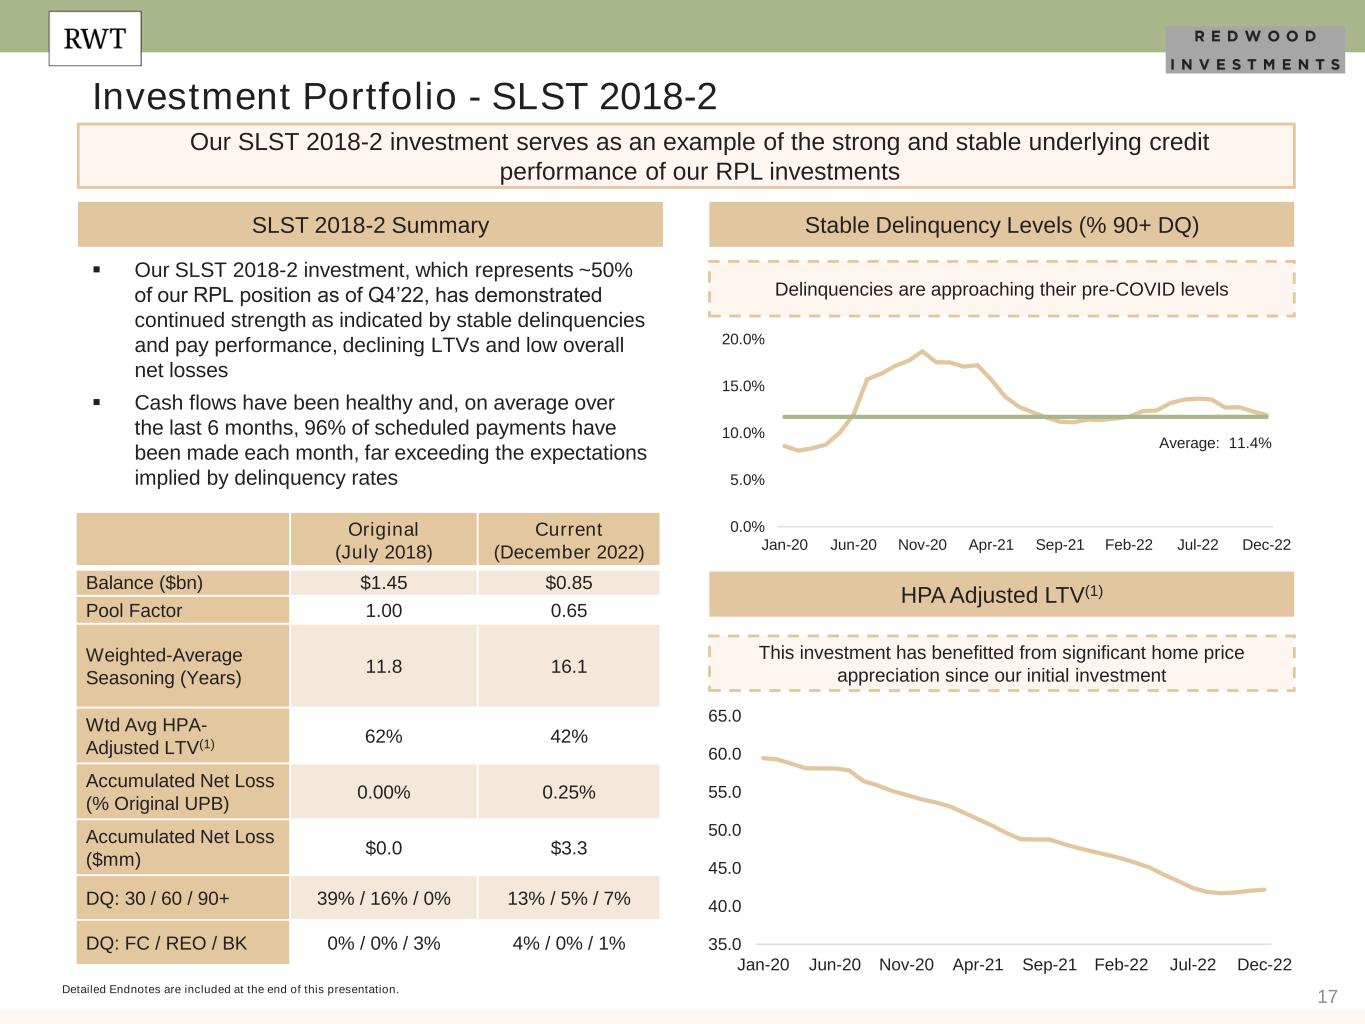
17 0.0% 5.0% 10.0% 15.0% 20.0% Jan-20 Jun-20 Nov-20 Apr-21 Sep-21 Feb-22 Jul-22 Dec-22 Investment Portfolio - SLST 2018-2 Detailed Endnotes are included at the end of this presentation. Our SLST 2018-2 investment serves as an example of the strong and stable underlying credit performance of our RPL investments Original (July 2018) Current (December 2022) Balance ($bn) $1.45 $0.85 Pool Factor 1.00 0.65 Weighted-Average Seasoning (Years) 11.8 16.1 Wtd Avg HPA- Adjusted LTV(1) 62% 42% Accumulated Net Loss (% Original UPB) 0.00% 0.25% Accumulated Net Loss ($mm) $0.0 $3.3 DQ: 30 / 60 / 90+ 39% / 16% / 0% 13% / 5% / 7% DQ: FC / REO / BK 0% / 0% / 3% 4% / 0% / 1% SLST 2018-2 Summary ▪ Our SLST 2018-2 investment, which represents ~50% of our RPL position as of Q4’22, has demonstrated continued strength as indicated by stable delinquencies and pay performance, declining LTVs and low overall net losses ▪ Cash flows have been healthy and, on average over the last 6 months, 96% of scheduled payments have been made each month, far exceeding the expectations implied by delinquency rates Stable Delinquency Levels (% 90+ DQ) HPA Adjusted LTV(1) This investment has benefitted from significant home price appreciation since our initial investment Delinquencies are approaching their pre-COVID levels Average: 11.4% 35.0 40.0 45.0 50.0 55.0 60.0 65.0 Jan-20 Jun-20 Nov-20 Apr-21 Sep-21 Feb-22 Jul-22 Dec-22
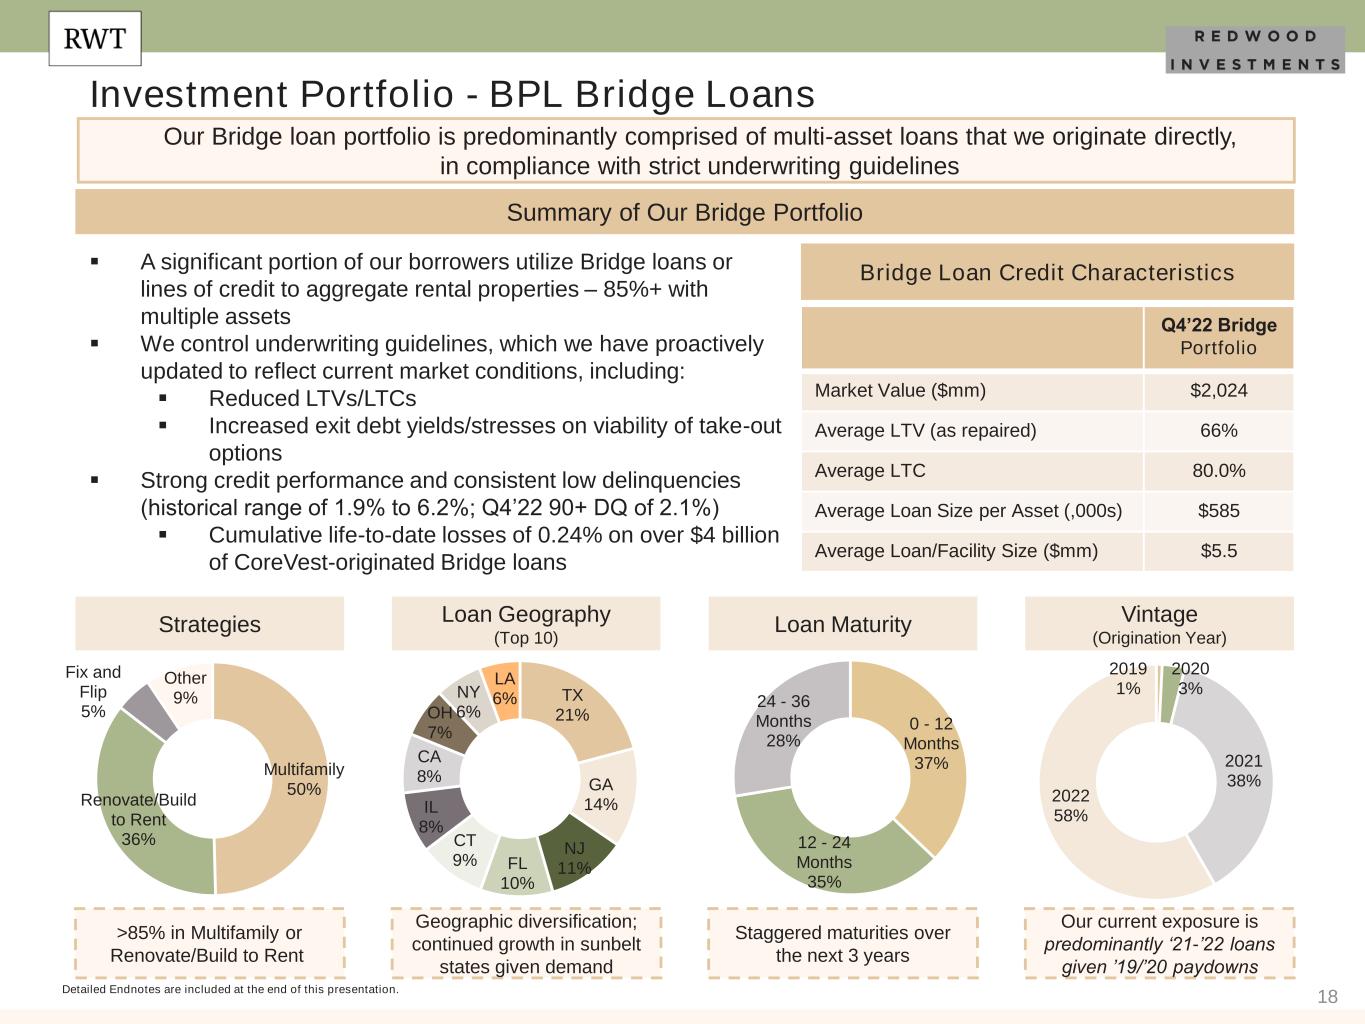
18 Investment Portfolio - BPL Bridge Loans Detailed Endnotes are included at the end of this presentation. Our Bridge loan portfolio is predominantly comprised of multi-asset loans that we originate directly, in compliance with strict underwriting guidelines ▪ A significant portion of our borrowers utilize Bridge loans or lines of credit to aggregate rental properties – 85%+ with multiple assets ▪ We control underwriting guidelines, which we have proactively updated to reflect current market conditions, including: ▪ Reduced LTVs/LTCs ▪ Increased exit debt yields/stresses on viability of take-out options ▪ Strong credit performance and consistent low delinquencies (historical range of 1.9% to 6.2%; Q4’22 90+ DQ of 2.1%) ▪ Cumulative life-to-date losses of 0.24% on over $4 billion of CoreVest-originated Bridge loans Vintage (Origination Year) Our current exposure is predominantly ‘21-’22 loans given ’19/’20 paydowns Loan Maturity Staggered maturities over the next 3 years Summary of Our Bridge Portfolio 0 - 12 Months 37% 12 - 24 Months 35% 24 - 36 Months 28% 2019 1% 2020 3% 2021 38% 2022 58% Bridge Loan Credit Characteristics Q4’22 Bridge Portfolio Market Value ($mm) $2,024 Average LTV (as repaired) 66% Average LTC 80.0% Average Loan Size per Asset (,000s) $585 Average Loan/Facility Size ($mm) $5.5 Strategies Loan Geography (Top 10) Geographic diversification; continued growth in sunbelt states given demand >85% in Multifamily or Renovate/Build to Rent TX 21% GA 14% NJ 11%FL 10% CT 9% IL 8% CA 8% OH 7% NY 6% LA 6% Multifamily 50% Renovate/Build to Rent 36% Fix and Flip 5% Other 9%
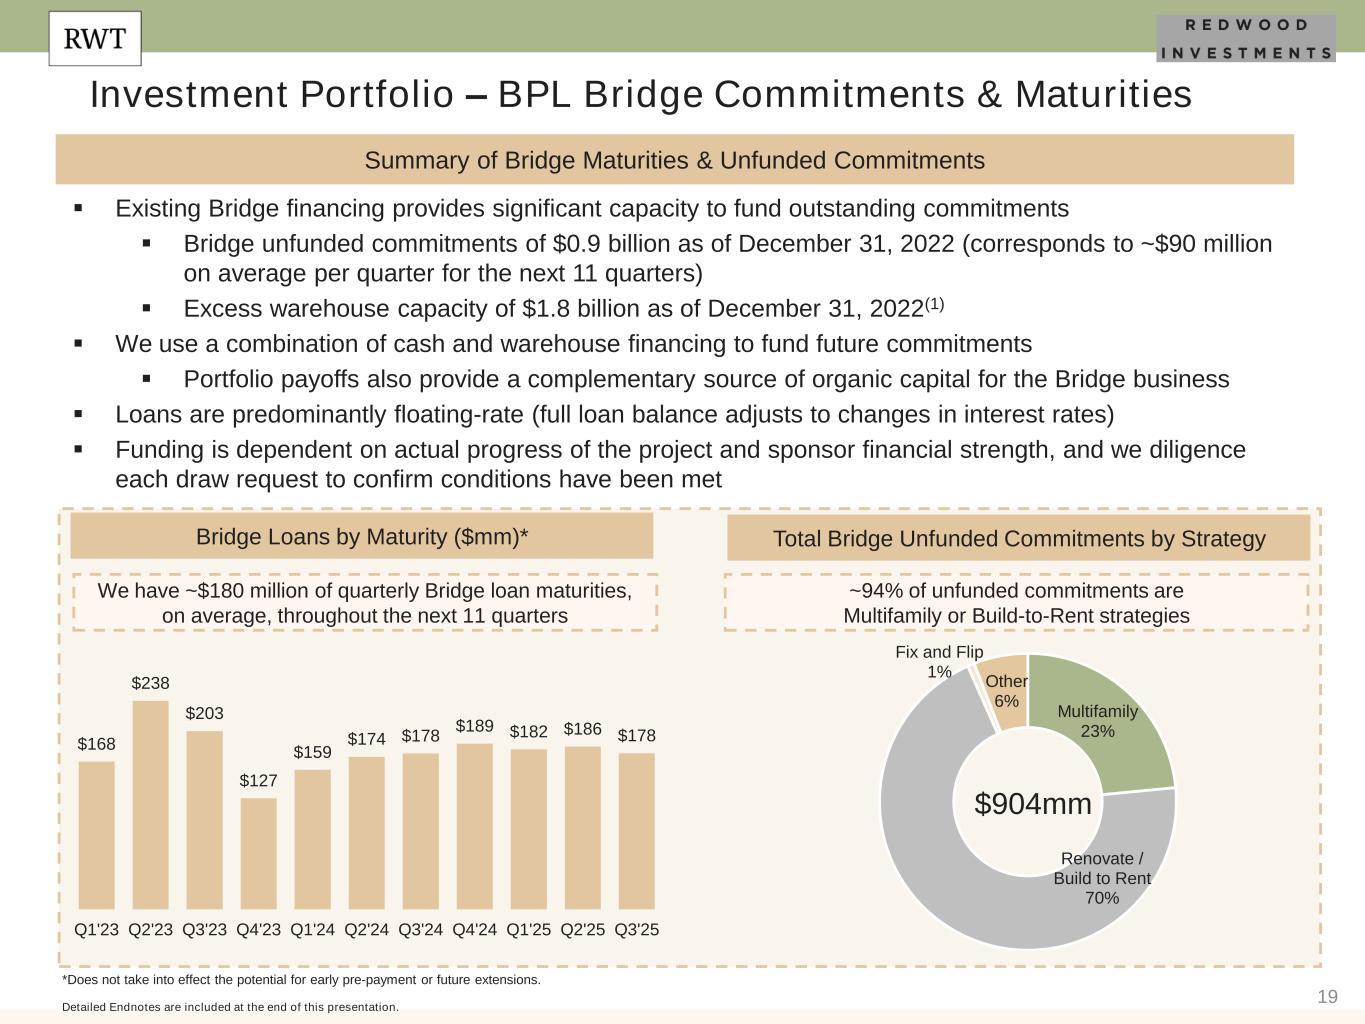
19 Investment Portfolio – BPL Bridge Commitments & Maturities Detailed Endnotes are included at the end of this presentation. Summary of Bridge Maturities & Unfunded Commitments ▪ Existing Bridge financing provides significant capacity to fund outstanding commitments ▪ Bridge unfunded commitments of $0.9 billion as of December 31, 2022 (corresponds to ~$90 million on average per quarter for the next 11 quarters) ▪ Excess warehouse capacity of $1.8 billion as of December 31, 2022(1) ▪ We use a combination of cash and warehouse financing to fund future commitments ▪ Portfolio payoffs also provide a complementary source of organic capital for the Bridge business ▪ Loans are predominantly floating-rate (full loan balance adjusts to changes in interest rates) ▪ Funding is dependent on actual progress of the project and sponsor financial strength, and we diligence each draw request to confirm conditions have been met Bridge Loans by Maturity ($mm)* We have ~$180 million of quarterly Bridge loan maturities, on average, throughout the next 11 quarters *Does not take into effect the potential for early pre-payment or future extensions. Total Bridge Unfunded Commitments by Strategy ~94% of unfunded commitments are Multifamily or Build-to-Rent strategies $168 $238 $203 $127 $159 $174 $178 $189 $182 $186 $178 Q1'23 Q2'23 Q3'23 Q4'23 Q1'24 Q2'24 Q3'24 Q4'24 Q1'25 Q2'25 Q3'25 $904mm Multifamily 23% Renovate / Build to Rent 70% Fix and Flip 1% Other 6%
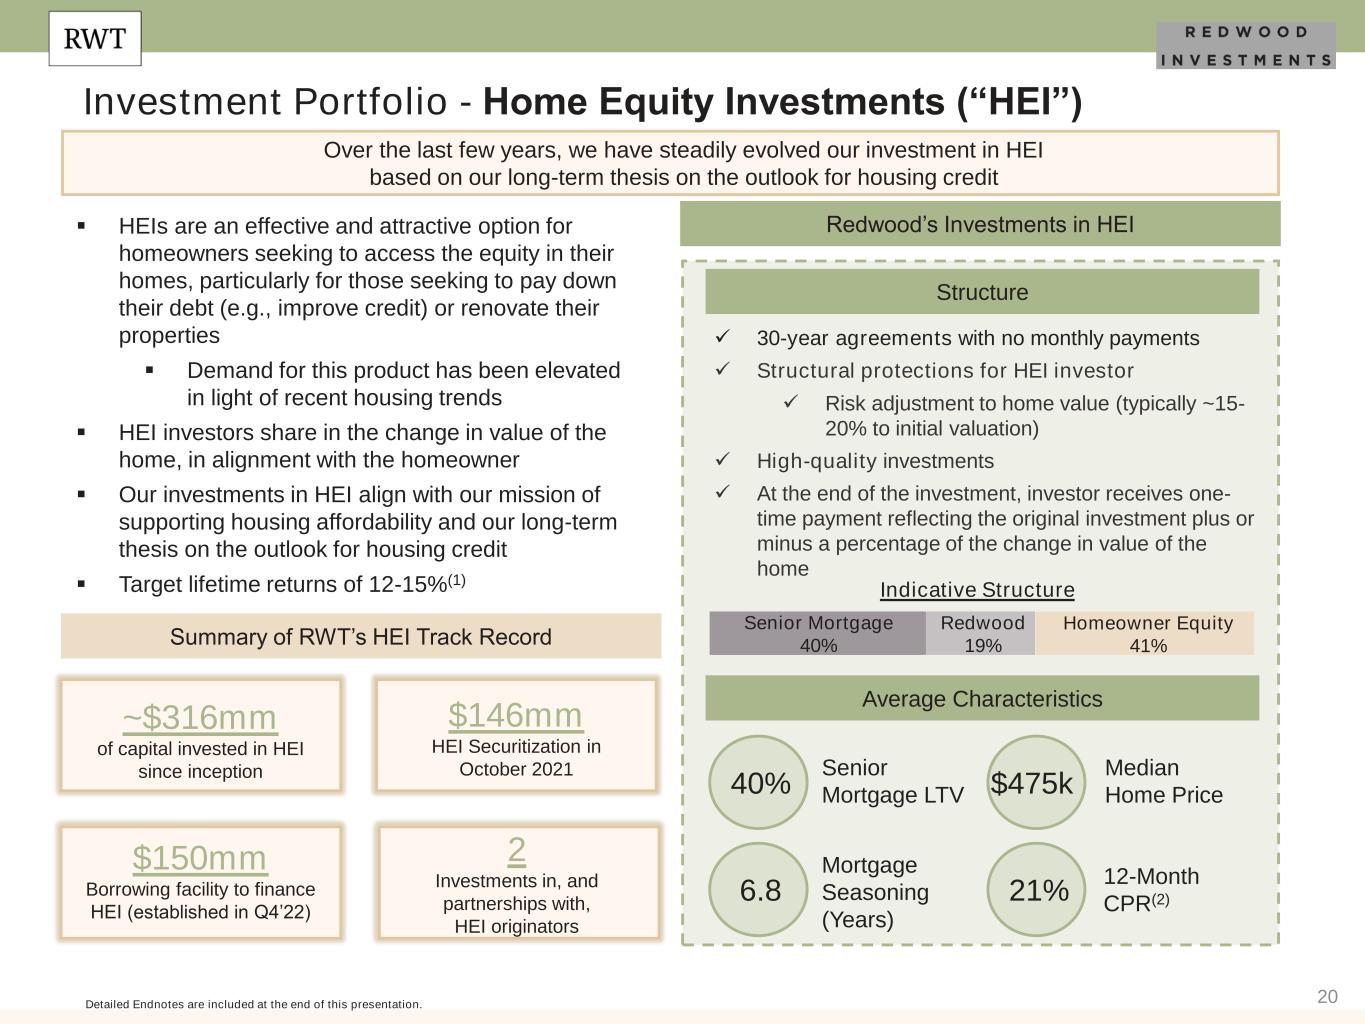
20 Investment Portfolio - Home Equity Investments (“HEI”) Over the last few years, we have steadily evolved our investment in HEI based on our long-term thesis on the outlook for housing credit Structure ▪ HEIs are an effective and attractive option for homeowners seeking to access the equity in their homes, particularly for those seeking to pay down their debt (e.g., improve credit) or renovate their properties ▪ Demand for this product has been elevated in light of recent housing trends ▪ HEI investors share in the change in value of the home, in alignment with the homeowner ▪ Our investments in HEI align with our mission of supporting housing affordability and our long-term thesis on the outlook for housing credit ▪ Target lifetime returns of 12-15%(1) Detailed Endnotes are included at the end of this presentation. Average Characteristics $146mm HEI Securitization in October 2021 ✓ 30-year agreements with no monthly payments ✓ Structural protections for HEI investor ✓ Risk adjustment to home value (typically ~15- 20% to initial valuation) ✓ High-quality investments ✓ At the end of the investment, investor receives one- time payment reflecting the original investment plus or minus a percentage of the change in value of the home Summary of RWT’s HEI Track Record 2 Investments in, and partnerships with, HEI originators Redwood’s Investments in HEI 40% 6.8 $475k 21% Senior Mortgage LTV Mortgage Seasoning (Years) Median Home Price 12-Month CPR(2) Indicative Structure Senior Mortgage 40% Homeowner Equity 41% Redwood 19% ~$316mm of capital invested in HEI since inception $150mm Borrowing facility to finance HEI (established in Q4’22)
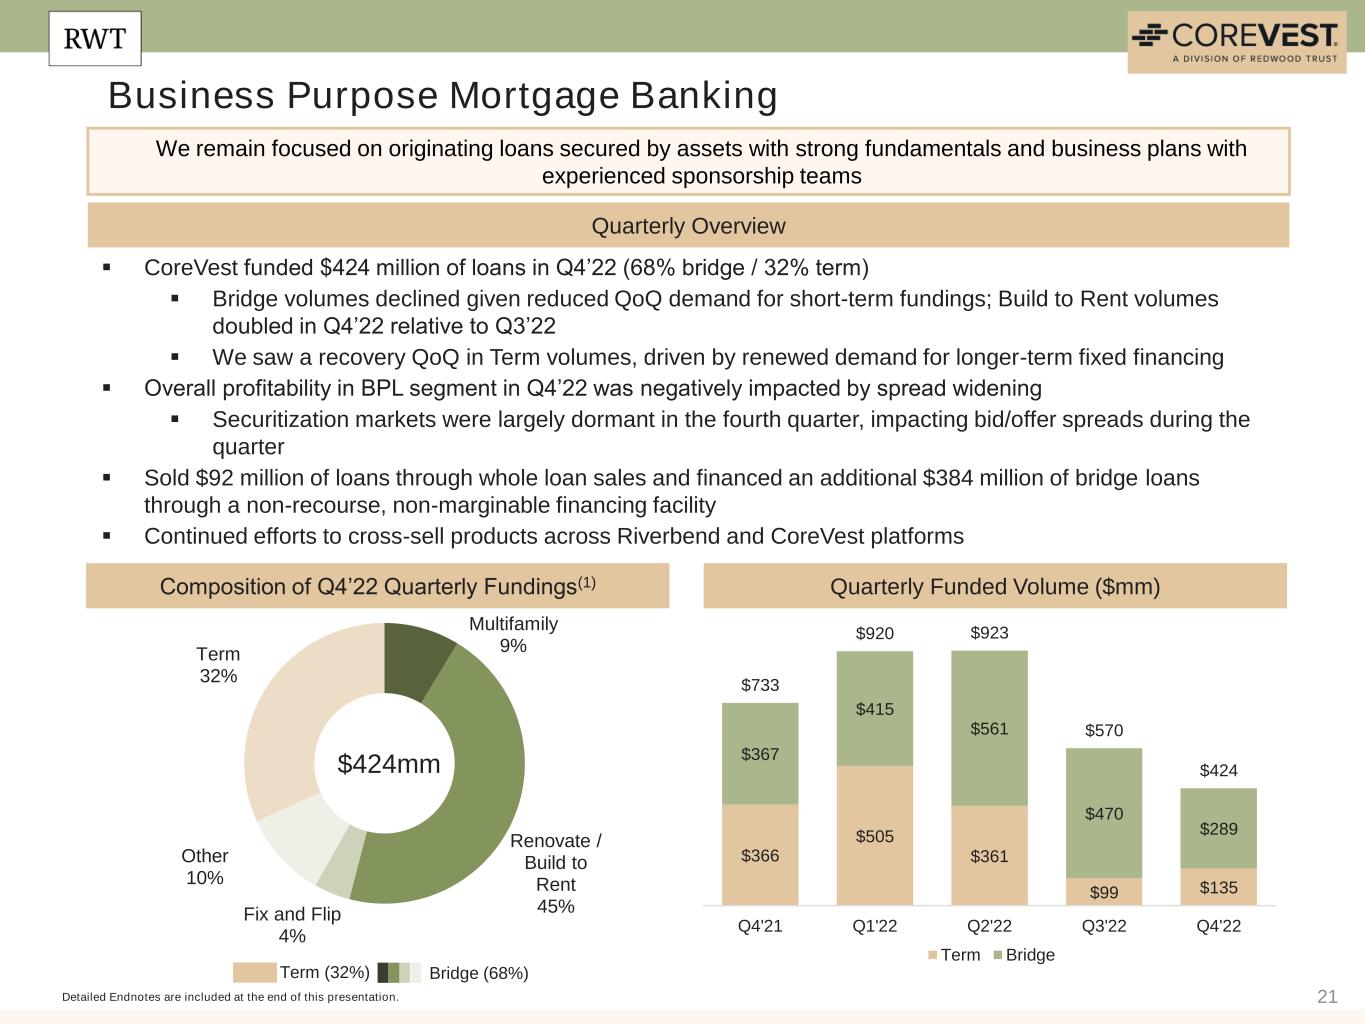
21 Business Purpose Mortgage Banking Quarterly Overview Composition of Q4’22 Quarterly Fundings(1) Detailed Endnotes are included at the end of this presentation. We remain focused on originating loans secured by assets with strong fundamentals and business plans with experienced sponsorship teams Quarterly Funded Volume ($mm) Term (32%) Bridge (68%) ▪ CoreVest funded $424 million of loans in Q4’22 (68% bridge / 32% term) ▪ Bridge volumes declined given reduced QoQ demand for short-term fundings; Build to Rent volumes doubled in Q4’22 relative to Q3’22 ▪ We saw a recovery QoQ in Term volumes, driven by renewed demand for longer-term fixed financing ▪ Overall profitability in BPL segment in Q4’22 was negatively impacted by spread widening ▪ Securitization markets were largely dormant in the fourth quarter, impacting bid/offer spreads during the quarter ▪ Sold $92 million of loans through whole loan sales and financed an additional $384 million of bridge loans through a non-recourse, non-marginable financing facility ▪ Continued efforts to cross-sell products across Riverbend and CoreVest platforms $366 $505 $361 $99 $135 $367 $415 $561 $470 $289 $733 $920 $923 $570 $424 Q4'21 Q1'22 Q2'22 Q3'22 Q4'22 Term Bridge Multifamily 9% Renovate / Build to Rent 45%Fix and Flip 4% Other 10% Term 32% $424mm
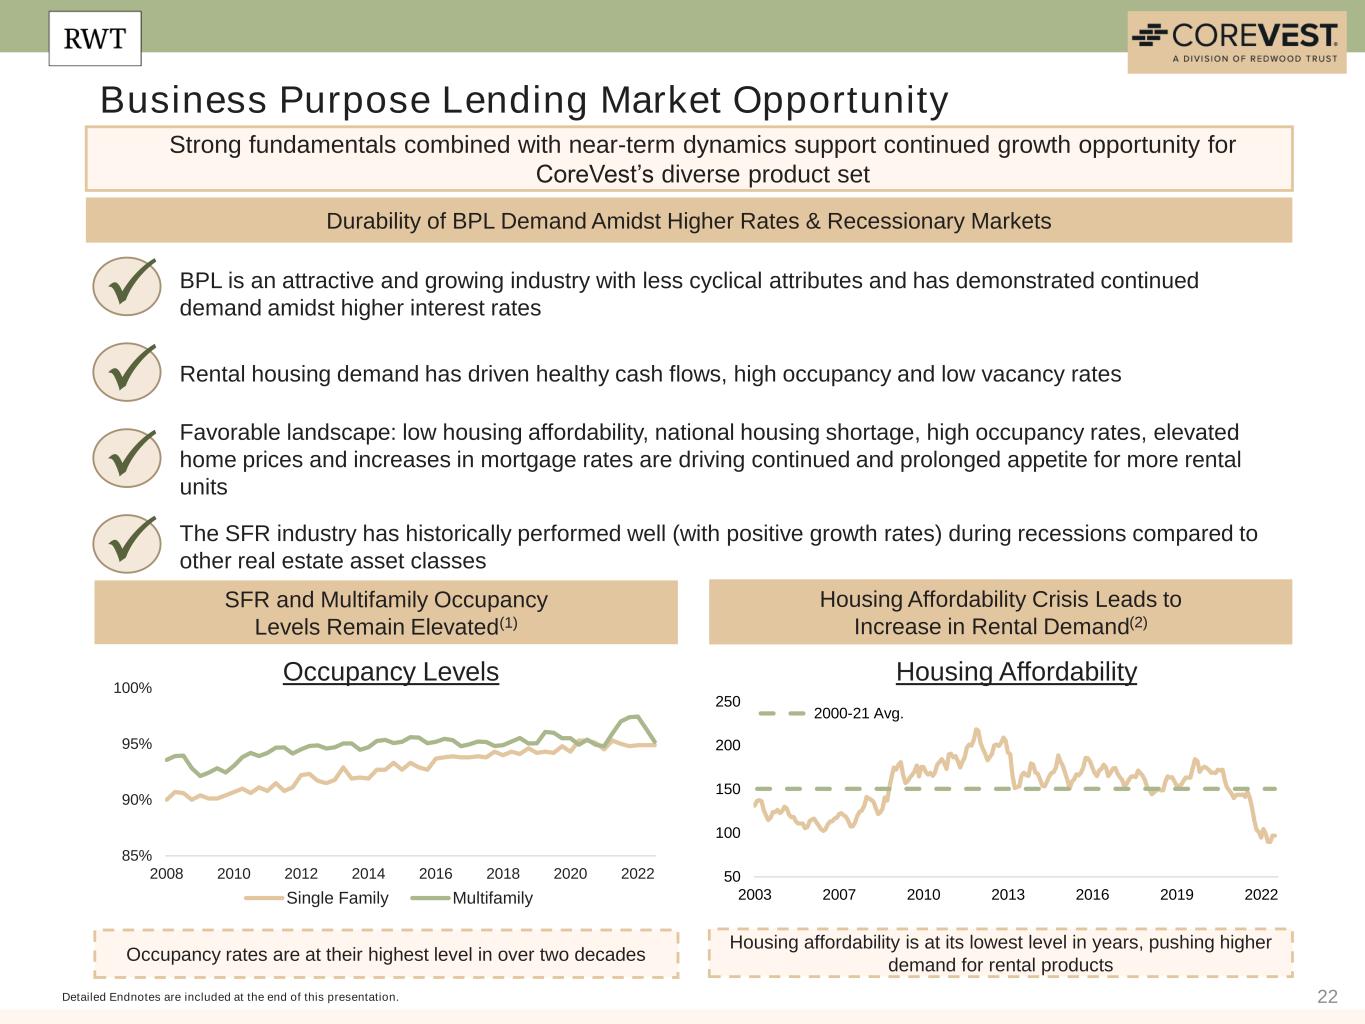
22 Business Purpose Lending Market Opportunity Durability of BPL Demand Amidst Higher Rates & Recessionary Markets Housing Affordability Crisis Leads to Increase in Rental Demand(2) Detailed Endnotes are included at the end of this presentation. Strong fundamentals combined with near-term dynamics support continued growth opportunity for CoreVest’s diverse product set SFR and Multifamily Occupancy Levels Remain Elevated(1) Occupancy rates are at their highest level in over two decades P BPL is an attractive and growing industry with less cyclical attributes and has demonstrated continued demand amidst higher interest rates P Rental housing demand has driven healthy cash flows, high occupancy and low vacancy rates P Favorable landscape: low housing affordability, national housing shortage, high occupancy rates, elevated home prices and increases in mortgage rates are driving continued and prolonged appetite for more rental units P The SFR industry has historically performed well (with positive growth rates) during recessions compared to other real estate asset classes Housing affordability is at its lowest level in years, pushing higher demand for rental products Occupancy Levels Housing Affordability 50 100 150 200 250 2003 2007 2010 2013 2016 2019 2022 2000-21 Avg. 85% 90% 95% 100% 2008 2010 2012 2014 2016 2018 2020 2022 Single Family Multifamily
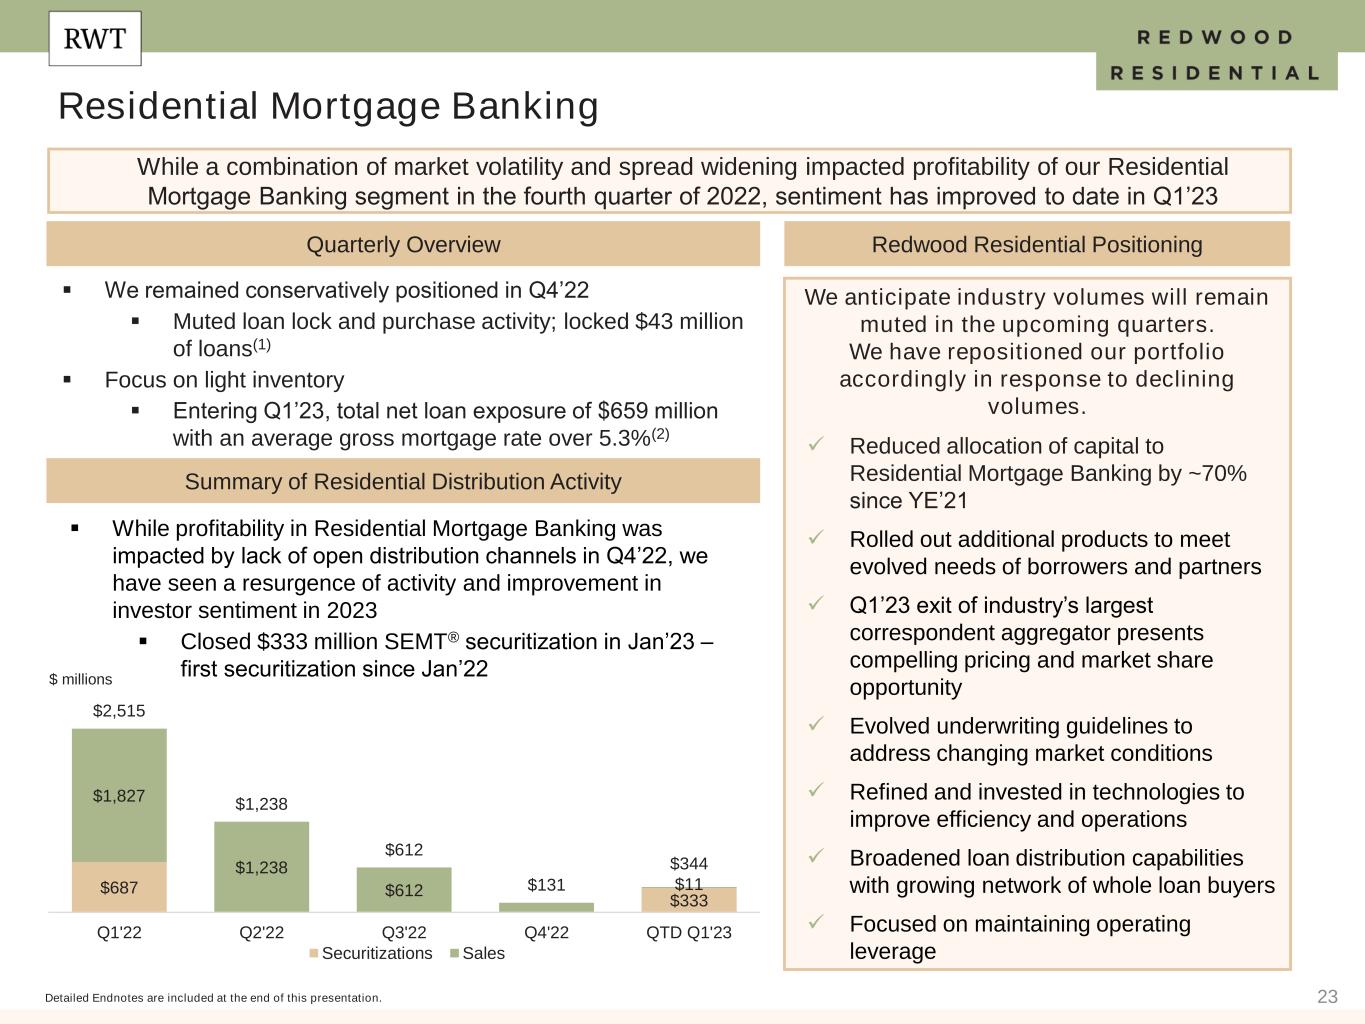
23 ▪ We remained conservatively positioned in Q4’22 ▪ Muted loan lock and purchase activity; locked $43 million of loans(1) ▪ Focus on light inventory ▪ Entering Q1’23, total net loan exposure of $659 million with an average gross mortgage rate over 5.3%(2) Residential Mortgage Banking Redwood Residential PositioningQuarterly Overview Detailed Endnotes are included at the end of this presentation. While a combination of market volatility and spread widening impacted profitability of our Residential Mortgage Banking segment in the fourth quarter of 2022, sentiment has improved to date in Q1’23 We anticipate industry volumes will remain muted in the upcoming quarters. We have repositioned our portfolio accordingly in response to declining volumes. ✓ Reduced allocation of capital to Residential Mortgage Banking by ~70% since YE’21 ✓ Rolled out additional products to meet evolved needs of borrowers and partners ✓ Q1’23 exit of industry’s largest correspondent aggregator presents compelling pricing and market share opportunity ✓ Evolved underwriting guidelines to address changing market conditions ✓ Refined and invested in technologies to improve efficiency and operations ✓ Broadened loan distribution capabilities with growing network of whole loan buyers ✓ Focused on maintaining operating leverage Summary of Residential Distribution Activity $687 $333 $1,827 $1,238 $612 $11 $2,515 $1,238 $612 $131 $344 Q1'22 Q2'22 Q3'22 Q4'22 QTD Q1'23 Securitizations Sales $ millions ▪ While profitability in Residential Mortgage Banking was impacted by lack of open distribution channels in Q4’22, we have seen a resurgence of activity and improvement in investor sentiment in 2023 ▪ Closed $333 million SEMT® securitization in Jan’23 – first securitization since Jan’22
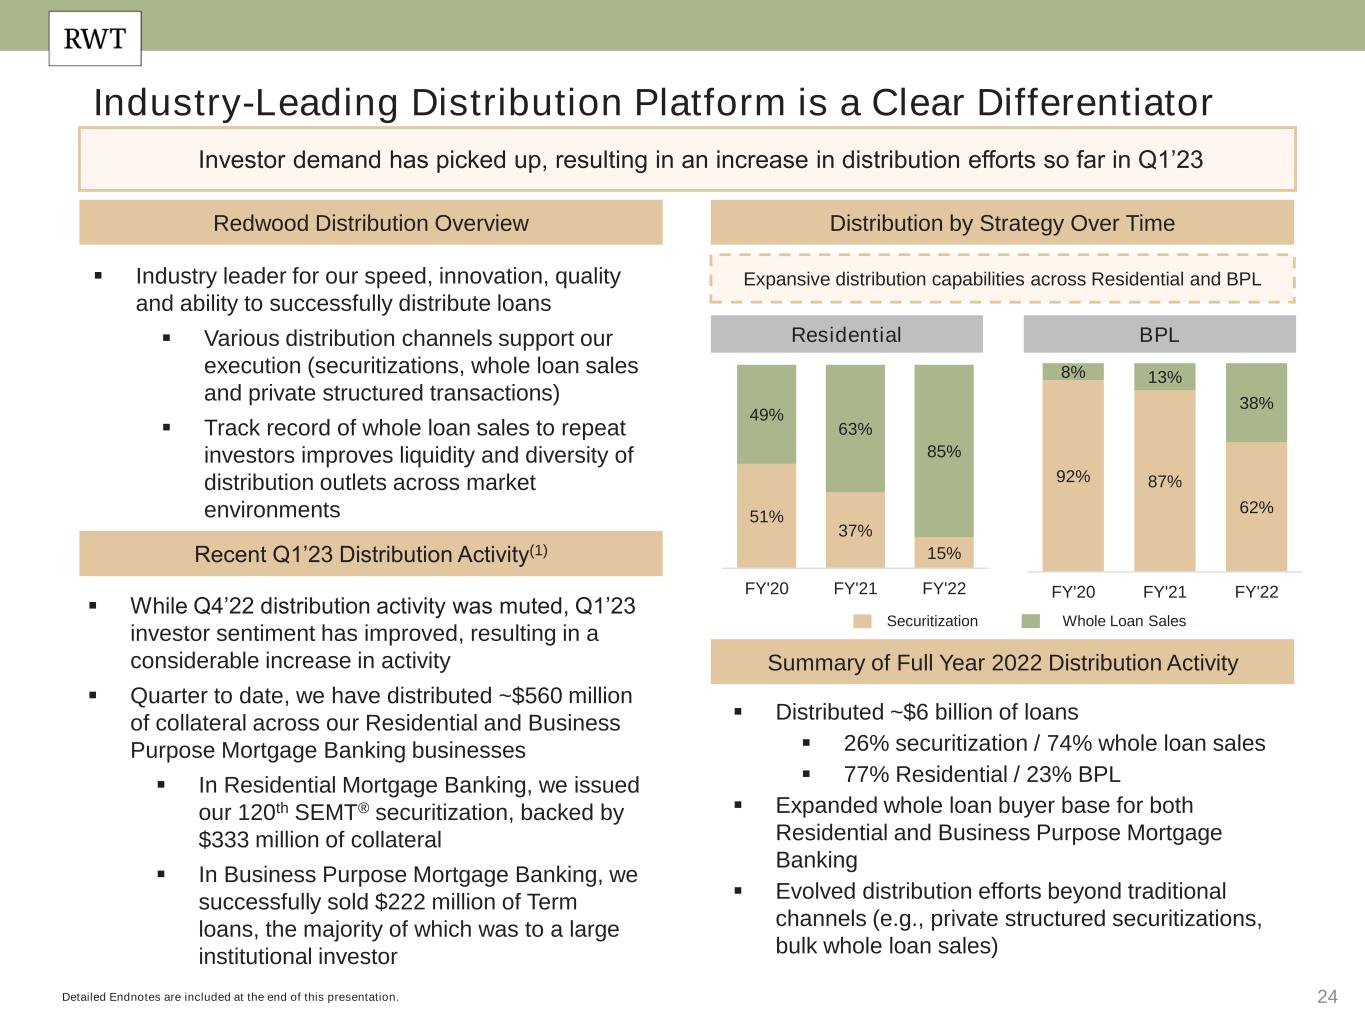
24 Industry-Leading Distribution Platform is a Clear Differentiator Distribution by Strategy Over Time Detailed Endnotes are included at the end of this presentation. Investor demand has picked up, resulting in an increase in distribution efforts so far in Q1’23 Residential BPL Securitization Whole Loan Sales 51% 37% 15% 49% 63% 85% FY'20 FY'21 FY'22 92% 87% 62% 8% 13% 38% FY'20 FY'21 FY'22 Expansive distribution capabilities across Residential and BPL Summary of Full Year 2022 Distribution Activity ▪ Distributed ~$6 billion of loans ▪ 26% securitization / 74% whole loan sales ▪ 77% Residential / 23% BPL ▪ Expanded whole loan buyer base for both Residential and Business Purpose Mortgage Banking ▪ Evolved distribution efforts beyond traditional channels (e.g., private structured securitizations, bulk whole loan sales) Redwood Distribution Overview ▪ Industry leader for our speed, innovation, quality and ability to successfully distribute loans ▪ Various distribution channels support our execution (securitizations, whole loan sales and private structured transactions) ▪ Track record of whole loan sales to repeat investors improves liquidity and diversity of distribution outlets across market environments Recent Q1’23 Distribution Activity(1) ▪ While Q4’22 distribution activity was muted, Q1’23 investor sentiment has improved, resulting in a considerable increase in activity ▪ Quarter to date, we have distributed ~$560 million of collateral across our Residential and Business Purpose Mortgage Banking businesses ▪ In Residential Mortgage Banking, we issued our 120th SEMT® securitization, backed by $333 million of collateral ▪ In Business Purpose Mortgage Banking, we successfully sold $222 million of Term loans, the majority of which was to a large institutional investor
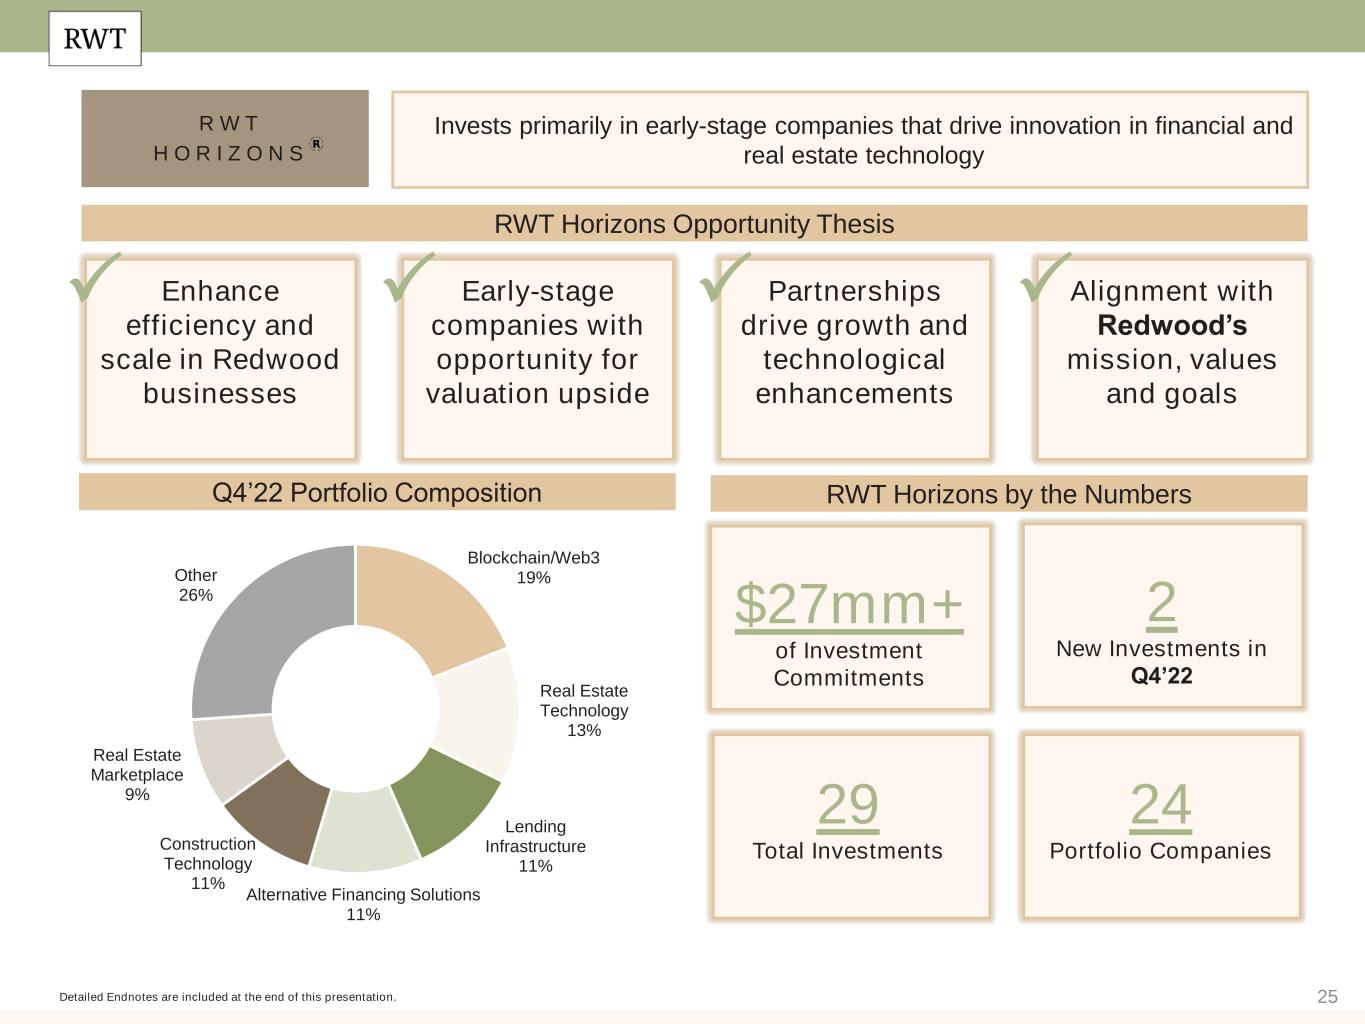
25 R W T H O R I Z O N S RWT Horizons by the Numbers Detailed Endnotes are included at the end of this presentation. Invests primarily in early-stage companies that drive innovation in financial and real estate technology RWT Horizons Opportunity Thesis Enhance efficiency and scale in Redwood businesses Early-stage companies with opportunity for valuation upside Partnerships drive growth and technological enhancements Alignment with Redwood’s mission, values and goals P P P P $27mm+ of Investment Commitments 29 Total Investments 24 Portfolio Companies Q4’22 Portfolio Composition 2 New Investments in Q4’22 Blockchain/Web3 19% Real Estate Technology 13% Lending Infrastructure 11% Alternative Financing Solutions 11% Construction Technology 11% Real Estate Marketplace 9% Other 26%

26 Financial Results
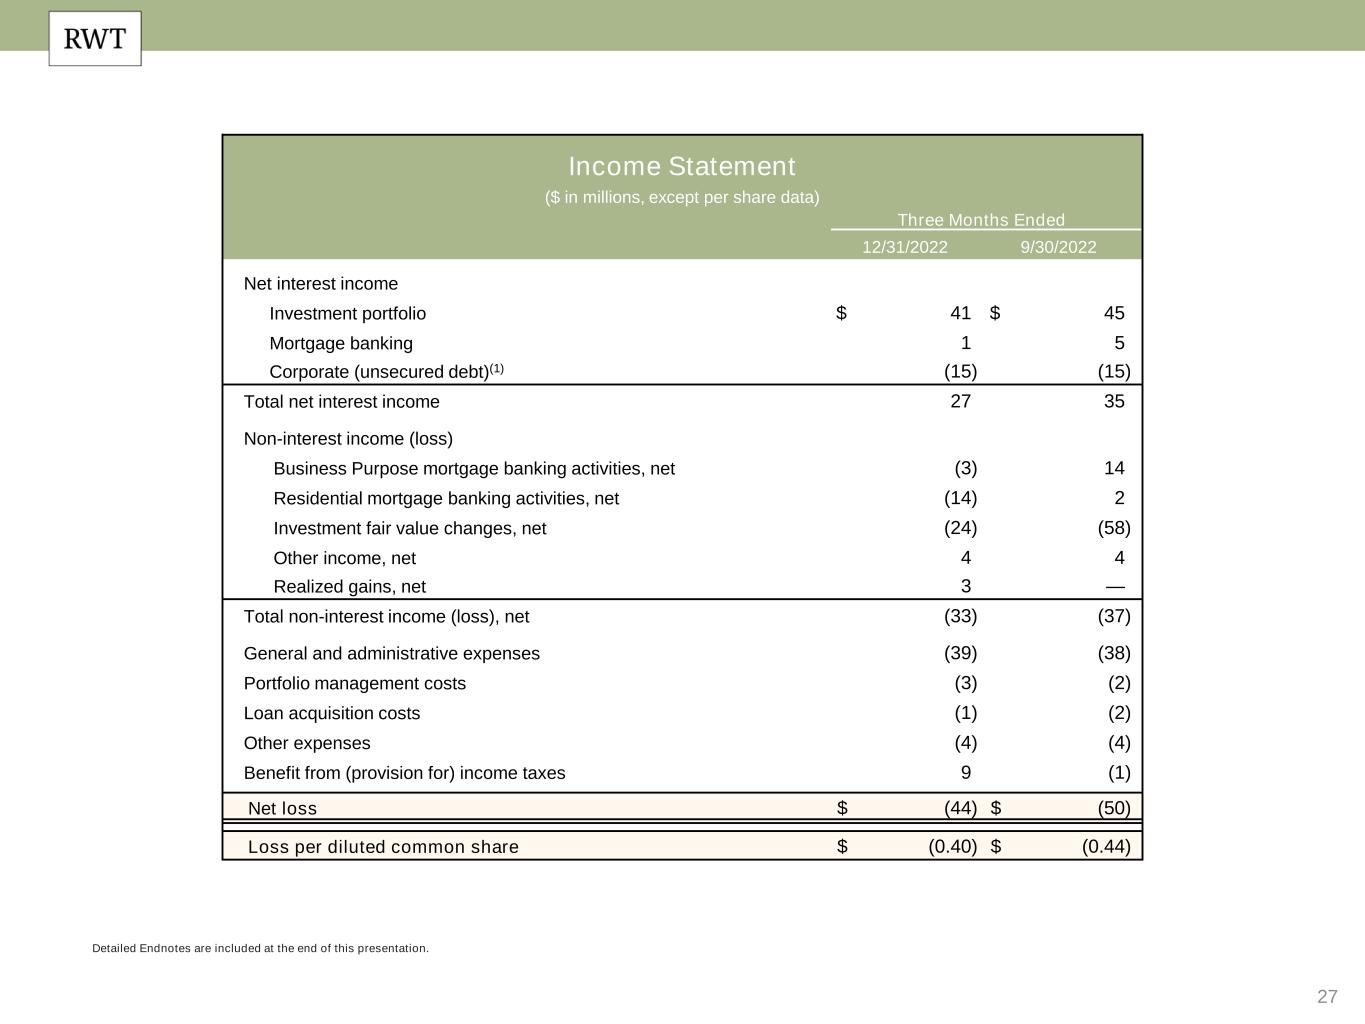
27 Detailed Endnotes are included at the end of this presentation. Income Statement ($ in millions, except per share data) Three Months Ended 12/31/2022 9/30/2022 Net interest income Investment portfolio $ 41 $ 45 Mortgage banking 1 5 Corporate (unsecured debt)(1) (15) (15) Total net interest income 27 35 Non-interest income (loss) Business Purpose mortgage banking activities, net (3) 14 Residential mortgage banking activities, net (14) 2 Investment fair value changes, net (24) (58) Other income, net 4 4 Realized gains, net 3 — Total non-interest income (loss), net (33) (37) General and administrative expenses (39) (38) Portfolio management costs (3) (2) Loan acquisition costs (1) (2) Other expenses (4) (4) Benefit from (provision for) income taxes 9 (1) Net loss $ (44) $ (50) Loss per diluted common share $ (0.40) $ (0.44)
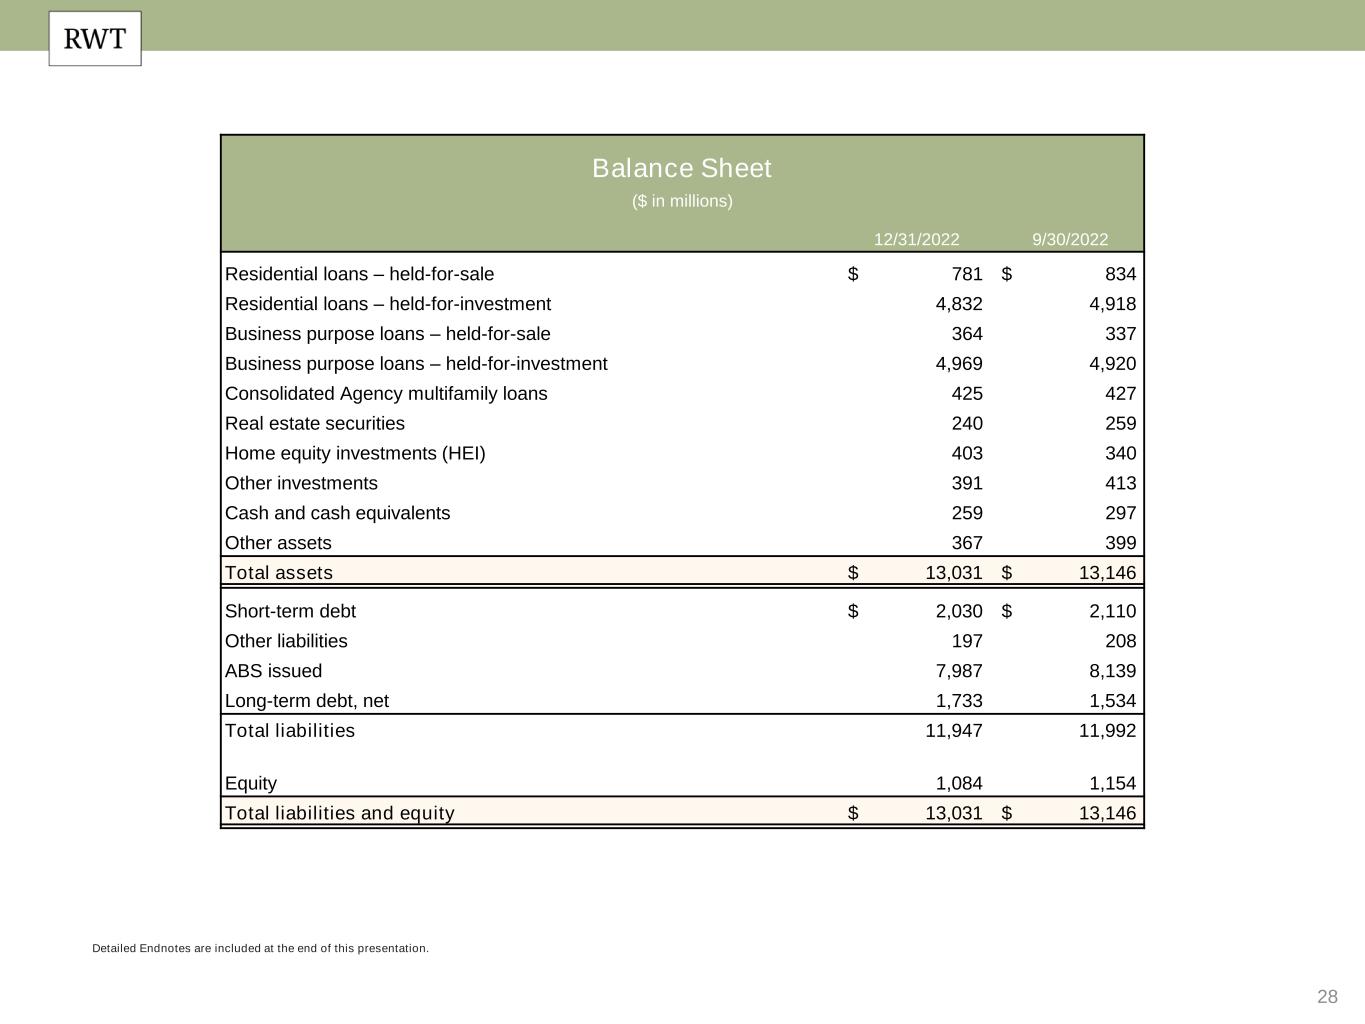
28 Detailed Endnotes are included at the end of this presentation. Balance Sheet ($ in millions) 12/31/2022 9/30/2022 Residential loans – held-for-sale $ 781 $ 834 Residential loans – held-for-investment 4,832 4,918 Business purpose loans – held-for-sale 364 337 Business purpose loans – held-for-investment 4,969 4,920 Consolidated Agency multifamily loans 425 427 Real estate securities 240 259 Home equity investments (HEI) 403 340 Other investments 391 413 Cash and cash equivalents 259 297 Other assets 367 399 Total assets $ 13,031 $ 13,146 Short-term debt $ 2,030 $ 2,110 Other liabilities 197 208 ABS issued 7,987 8,139 Long-term debt, net 1,733 1,534 Total liabilities 11,947 11,992 Equity 1,084 1,154 Total liabilities and equity $ 13,031 $ 13,146
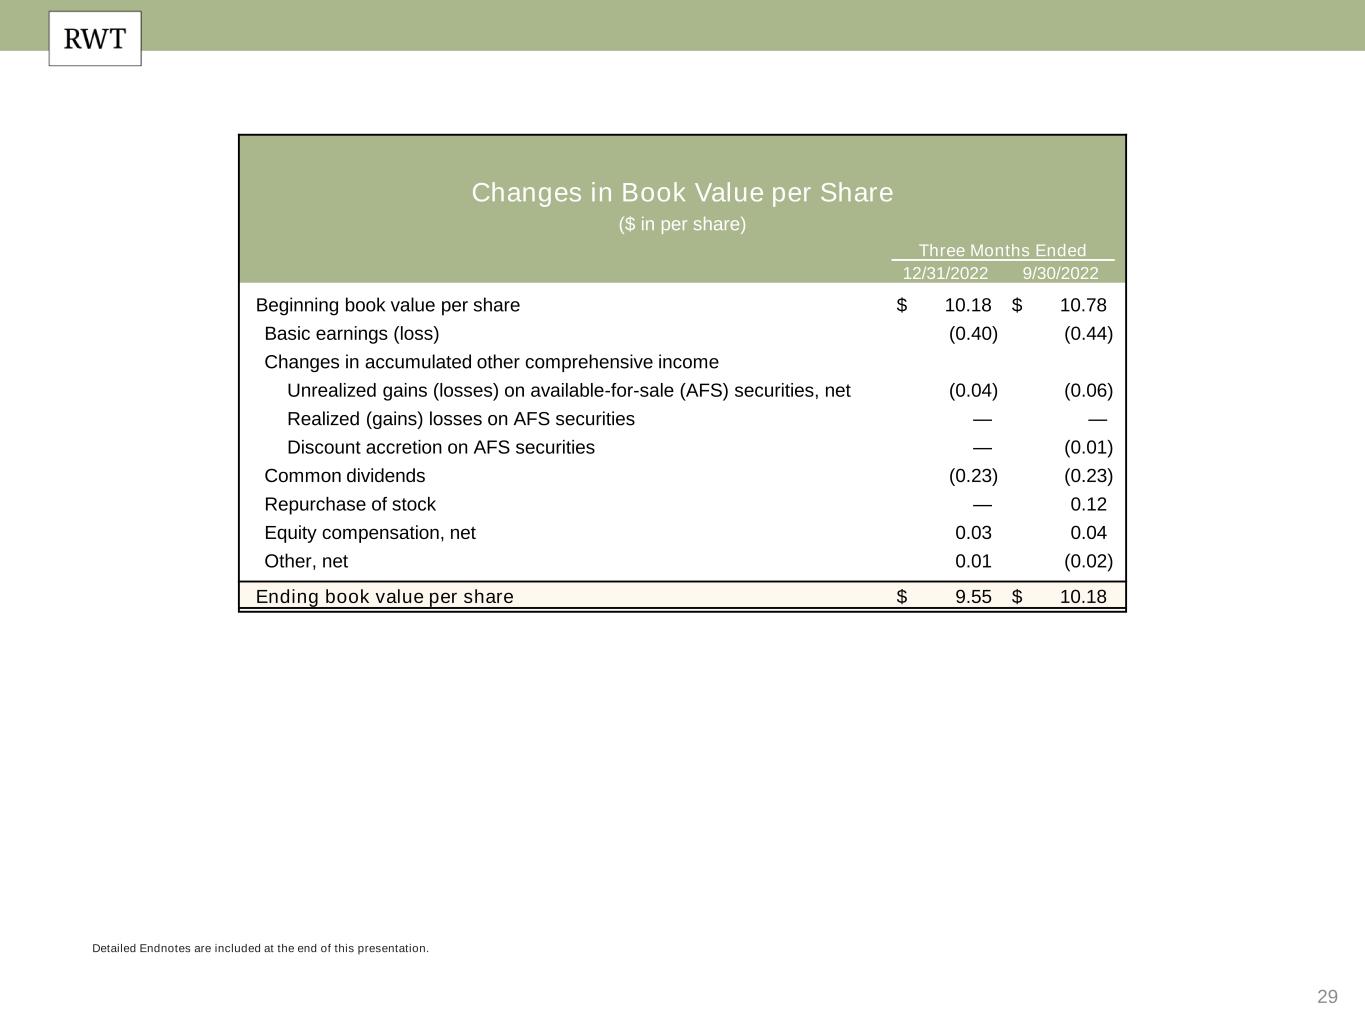
29 Detailed Endnotes are included at the end of this presentation. Changes in Book Value per Share ($ in per share) Three Months Ended 12/31/2022 9/30/2022 Beginning book value per share $ 10.18 $ 10.78 Basic earnings (loss) (0.40) (0.44) Changes in accumulated other comprehensive income Unrealized gains (losses) on available-for-sale (AFS) securities, net (0.04) (0.06) Realized (gains) losses on AFS securities — — Discount accretion on AFS securities — (0.01) Common dividends (0.23) (0.23) Repurchase of stock — 0.12 Equity compensation, net 0.03 0.04 Other, net 0.01 (0.02) Ending book value per share $ 9.55 $ 10.18
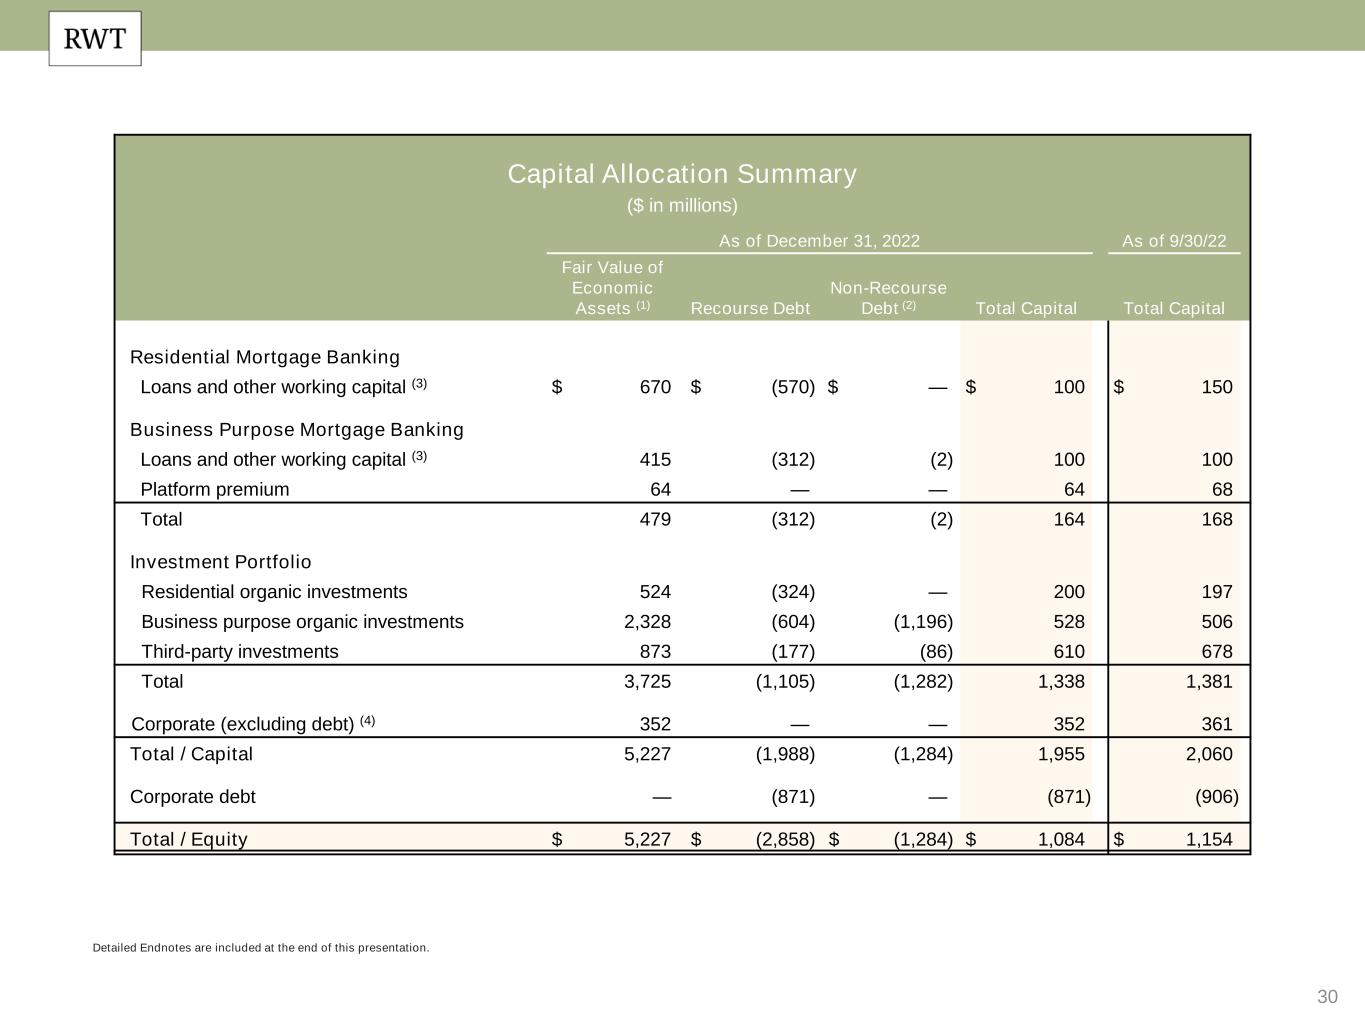
30 Detailed Endnotes are included at the end of this presentation. Capital Allocation Summary ($ in millions) As of December 31, 2022 As of 9/30/22 Fair Value of Economic Assets (1) Recourse Debt Non-Recourse Debt (2) Total Capital Total Capital Residential Mortgage Banking Loans and other working capital (3) $ 670 $ (570) $ — $ 100 $ 150 Business Purpose Mortgage Banking Loans and other working capital (3) 415 (312) (2) 100 100 Platform premium 64 — — 64 68 Total 479 (312) (2) 164 168 Investment Portfolio Residential organic investments 524 (324) — 200 197 Business purpose organic investments 2,328 (604) (1,196) 528 506 Third-party investments 873 (177) (86) 610 678 Total 3,725 (1,105) (1,282) 1,338 1,381 Corporate (excluding debt) (4) 352 — — 352 361 Total / Capital 5,227 (1,988) (1,284) 1,955 2,060 Corporate debt — (871) — (871) (906) Total / Equity $ 5,227 $ (2,858) $ (1,284) $ 1,084 $ 1,154
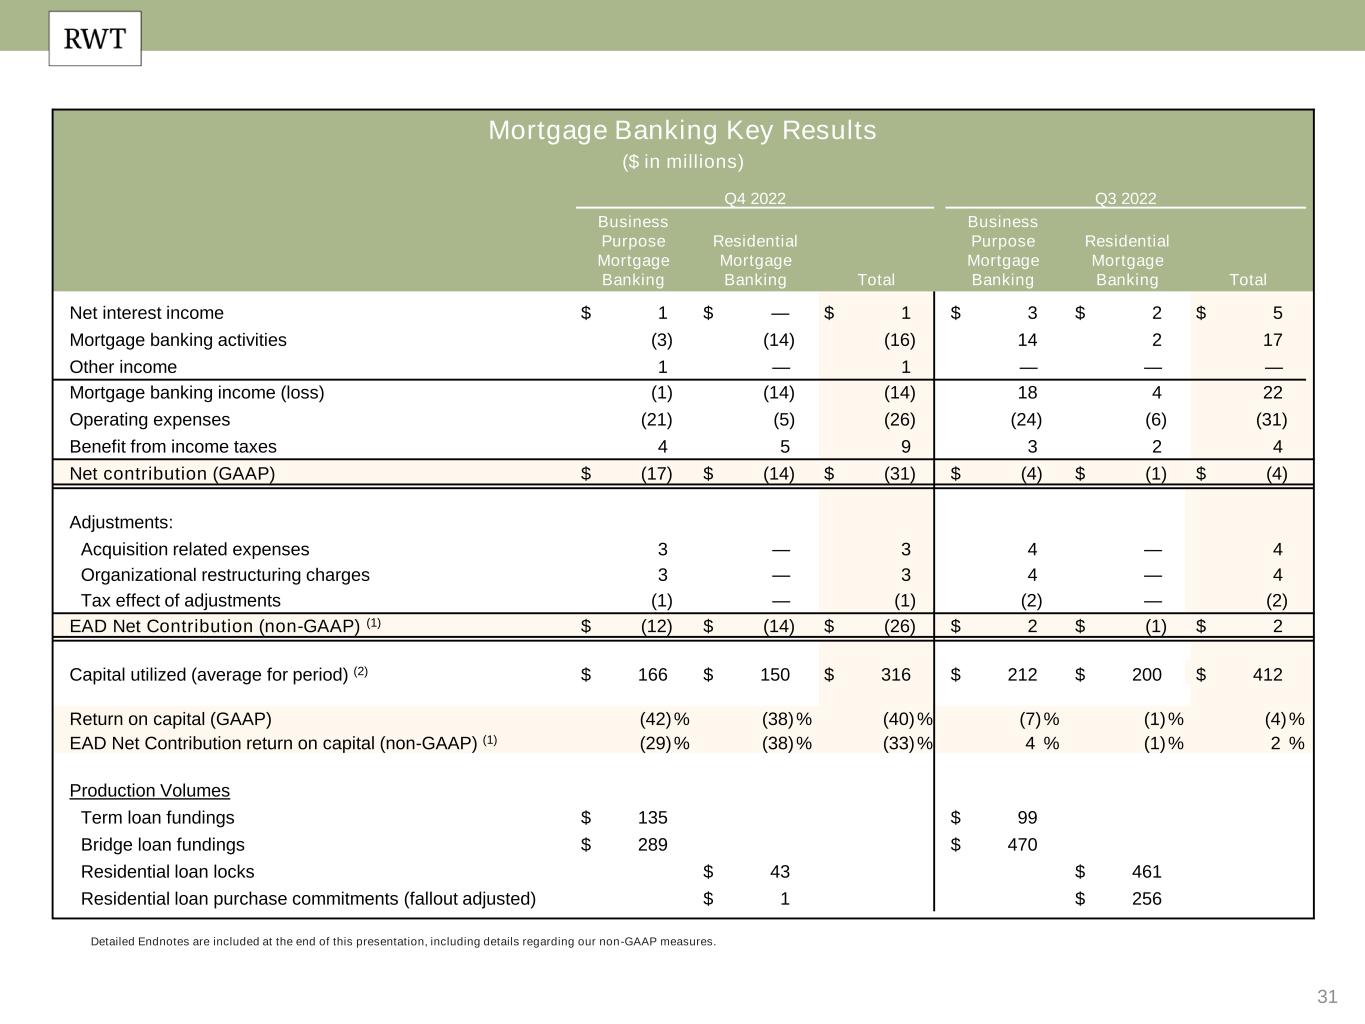
31 Detailed Endnotes are included at the end of this presentation, including details regarding our non-GAAP measures. Mortgage Banking Key Results ($ in millions) Q4 2022 Q3 2022 Business Purpose Mortgage Banking Residential Mortgage Banking Total Business Purpose Mortgage Banking Residential Mortgage Banking Total Net interest income $ 1 $ — $ 1 $ 3 $ 2 $ 5 Mortgage banking activities (3) (14) (16) 14 2 17 Other income 1 — 1 — — — Mortgage banking income (loss) (1) (14) (14) 18 4 22 Operating expenses (21) (5) (26) (24) (6) (31) Benefit from income taxes 4 5 9 3 2 4 Net contribution (GAAP) $ (17) $ (14) $ (31) $ (4) $ (1) $ (4) Adjustments: Acquisition related expenses 3 — 3 4 — 4 Organizational restructuring charges 3 — 3 4 — 4 Tax effect of adjustments (1) — (1) (2) — (2) EAD Net Contribution (non-GAAP) (1) $ (12) $ (14) $ (26) $ 2 $ (1) $ 2 Capital utilized (average for period) (2) $ 166 $ 150 $ 316 $ 212 $ 200 $ 412 Return on capital (GAAP) (42)% (38)% (40)% (7)% (1)% (4)% EAD Net Contribution return on capital (non-GAAP) (1) (29)% (38)% (33)% 4 % (1)% 2 % Production Volumes Term loan fundings $ 135 $ 99 Bridge loan fundings $ 289 $ 470 Residential loan locks $ 43 $ 461 Residential loan purchase commitments (fallout adjusted) $ 1 $ 256
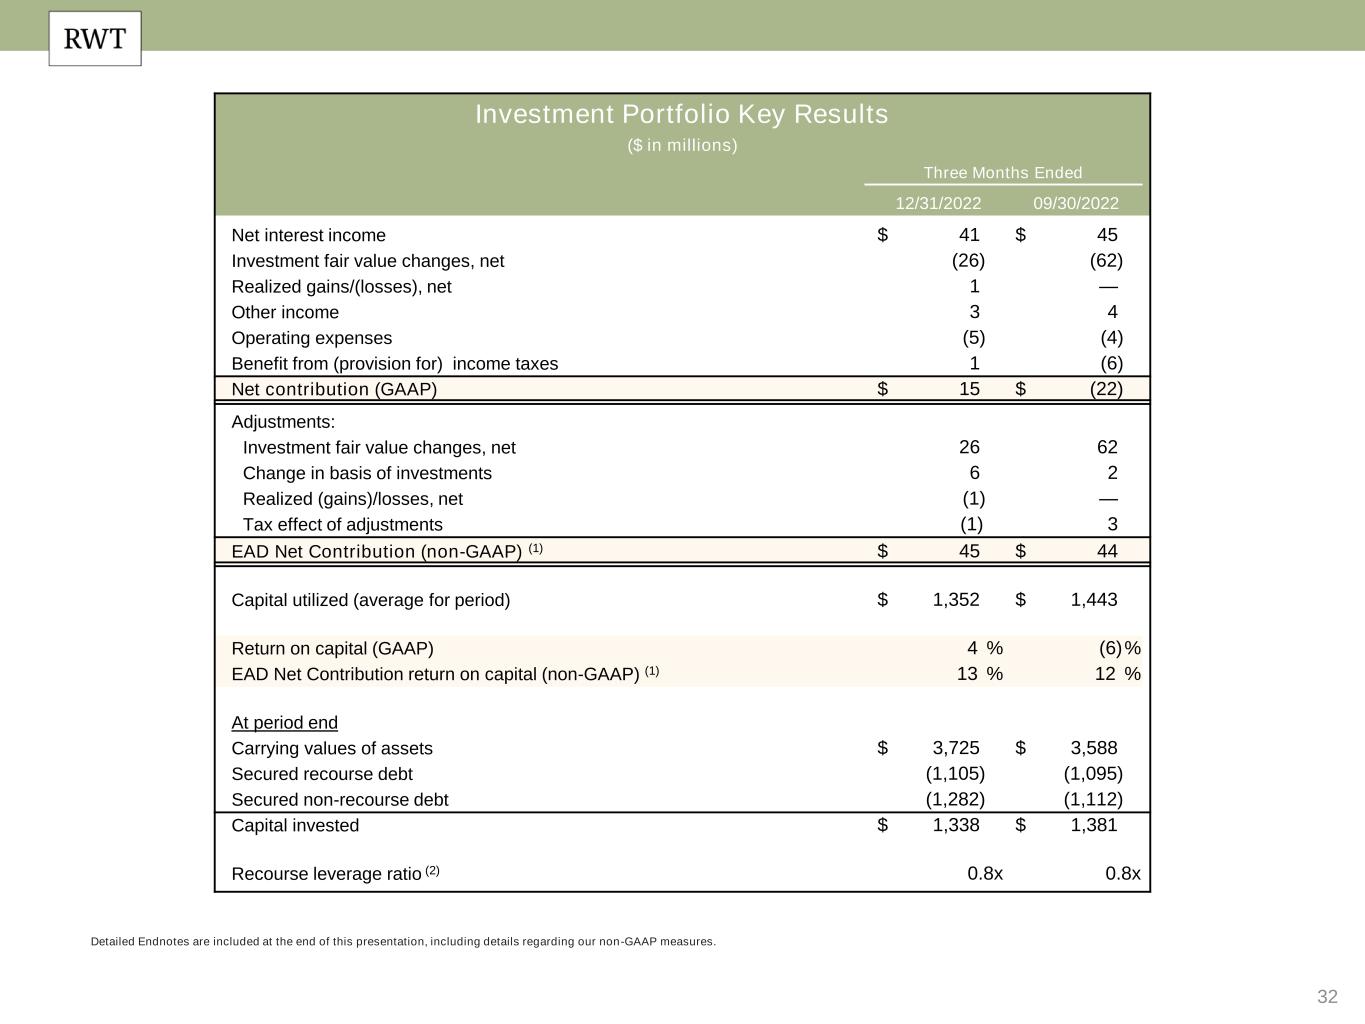
32 Detailed Endnotes are included at the end of this presentation, including details regarding our non-GAAP measures. Investment Portfolio Key Results ($ in millions) Three Months Ended 12/31/2022 09/30/2022 Net interest income $ 41 $ 45 Investment fair value changes, net (26) (62) Realized gains/(losses), net 1 — Other income 3 4 Operating expenses (5) (4) Benefit from (provision for) income taxes 1 (6) Net contribution (GAAP) $ 15 $ (22) Adjustments: Investment fair value changes, net 26 62 Change in basis of investments 6 2 Realized (gains)/losses, net (1) — Tax effect of adjustments (1) 3 EAD Net Contribution (non-GAAP) (1) $ 45 $ 44 Capital utilized (average for period) $ 1,352 $ 1,443 Return on capital (GAAP) 4 % (6)% EAD Net Contribution return on capital (non-GAAP) (1) 13 % 12 % At period end Carrying values of assets $ 3,725 $ 3,588 Secured recourse debt (1,105) (1,095) Secured non-recourse debt (1,282) (1,112) Capital invested $ 1,338 $ 1,381 Recourse leverage ratio (2) 0.8x 0.8x
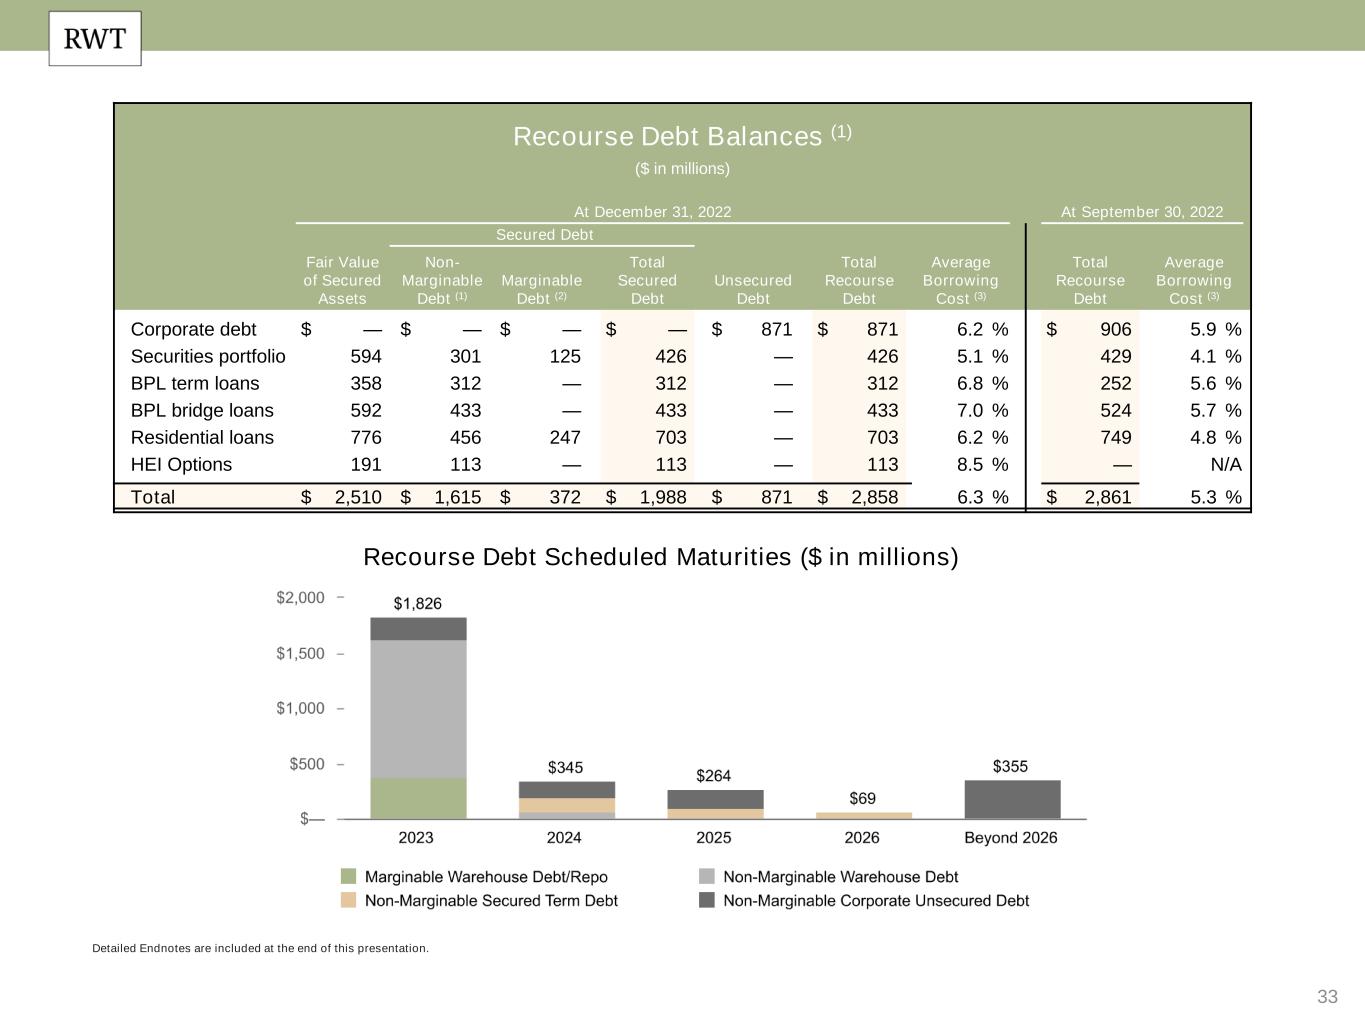
33 Detailed Endnotes are included at the end of this presentation. Recourse Debt Scheduled Maturities ($ in millions) Recourse Debt Balances (1) ($ in millions) At December 31, 2022 At September 30, 2022 Secured Debt Fair Value of Secured Assets Non- Marginable Debt (1) Marginable Debt (2) Total Secured Debt Unsecured Debt Total Recourse Debt Average Borrowing Cost (3) Total Recourse Debt Average Borrowing Cost (3) Corporate debt $ — $ — $ — $ — $ 871 $ 871 6.2 % $ 906 5.9 % Securities portfolio 594 301 125 426 — 426 5.1 % 429 4.1 % BPL term loans 358 312 — 312 — 312 6.8 % 252 5.6 % BPL bridge loans 592 433 — 433 — 433 7.0 % 524 5.7 % Residential loans 776 456 247 703 — 703 6.2 % 749 4.8 % HEI Options 191 113 — 113 — 113 8.5 % — N/A Total $ 2,510 $ 1,615 $ 372 $ 1,988 $ 871 $ 2,858 6.3 % $ 2,861 5.3 %

34 Endnotes
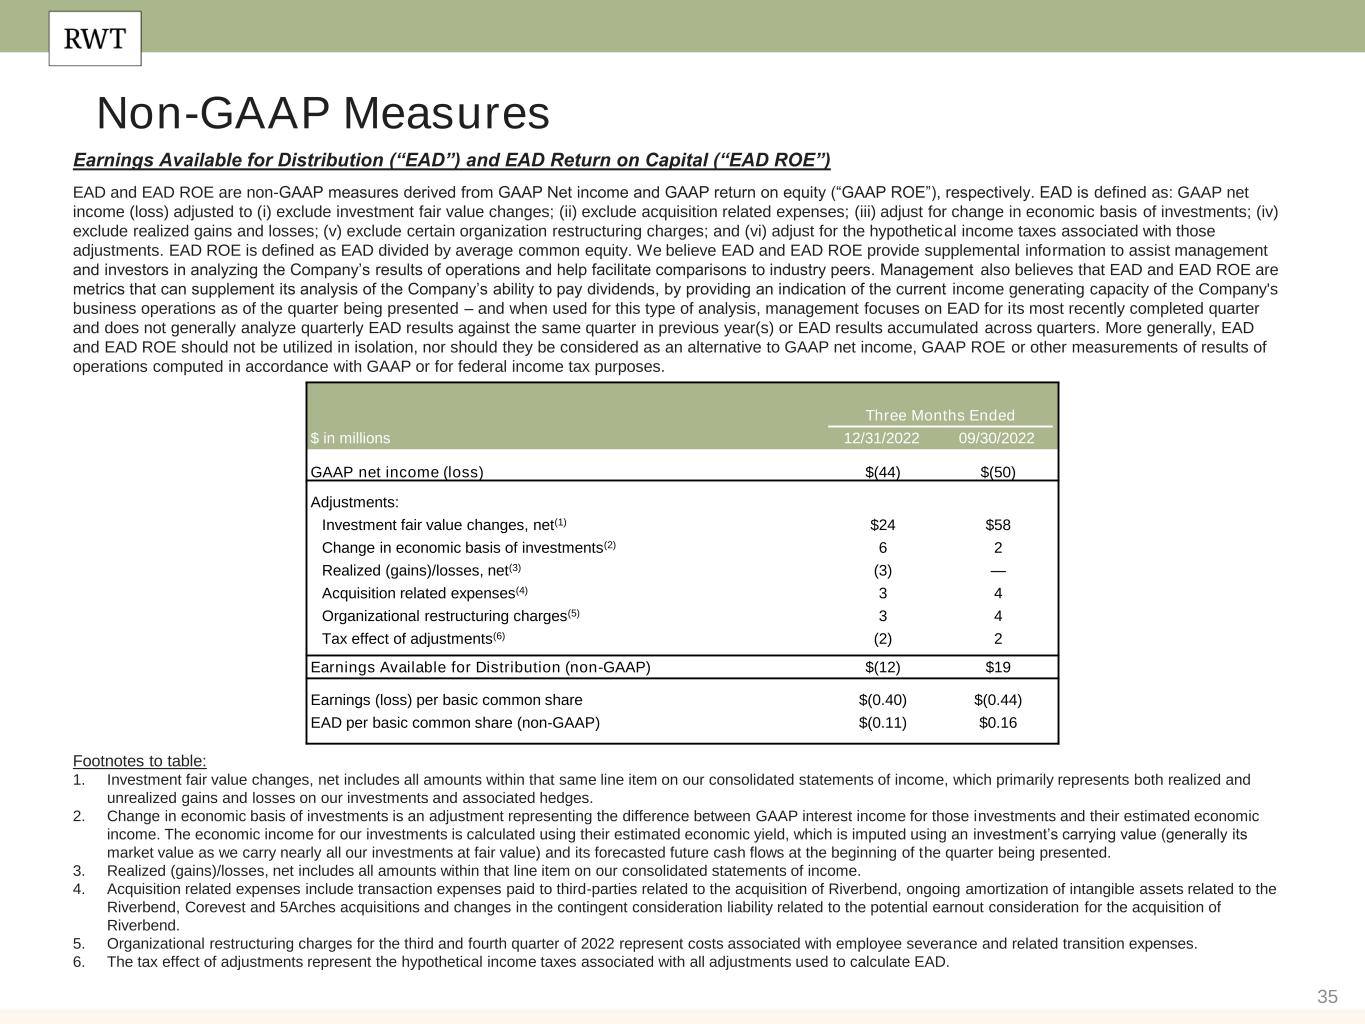
35 Non-GAAP Measures Earnings Available for Distribution (“EAD”) and EAD Return on Capital (“EAD ROE”) EAD and EAD ROE are non-GAAP measures derived from GAAP Net income and GAAP return on equity (“GAAP ROE”), respectively. EAD is defined as: GAAP net income (loss) adjusted to (i) exclude investment fair value changes; (ii) exclude acquisition related expenses; (iii) adjust for change in economic basis of investments; (iv) exclude realized gains and losses; (v) exclude certain organization restructuring charges; and (vi) adjust for the hypothetical income taxes associated with those adjustments. EAD ROE is defined as EAD divided by average common equity. We believe EAD and EAD ROE provide supplemental information to assist management and investors in analyzing the Company’s results of operations and help facilitate comparisons to industry peers. Management also believes that EAD and EAD ROE are metrics that can supplement its analysis of the Company’s ability to pay dividends, by providing an indication of the current income generating capacity of the Company's business operations as of the quarter being presented – and when used for this type of analysis, management focuses on EAD for its most recently completed quarter and does not generally analyze quarterly EAD results against the same quarter in previous year(s) or EAD results accumulated across quarters. More generally, EAD and EAD ROE should not be utilized in isolation, nor should they be considered as an alternative to GAAP net income, GAAP ROE or other measurements of results of operations computed in accordance with GAAP or for federal income tax purposes. Footnotes to table: 1. Investment fair value changes, net includes all amounts within that same line item on our consolidated statements of income, which primarily represents both realized and unrealized gains and losses on our investments and associated hedges. 2. Change in economic basis of investments is an adjustment representing the difference between GAAP interest income for those investments and their estimated economic income. The economic income for our investments is calculated using their estimated economic yield, which is imputed using an investment’s carrying value (generally its market value as we carry nearly all our investments at fair value) and its forecasted future cash flows at the beginning of the quarter being presented. 3. Realized (gains)/losses, net includes all amounts within that line item on our consolidated statements of income. 4. Acquisition related expenses include transaction expenses paid to third-parties related to the acquisition of Riverbend, ongoing amortization of intangible assets related to the Riverbend, Corevest and 5Arches acquisitions and changes in the contingent consideration liability related to the potential earnout consideration for the acquisition of Riverbend. 5. Organizational restructuring charges for the third and fourth quarter of 2022 represent costs associated with employee severance and related transition expenses. 6. The tax effect of adjustments represent the hypothetical income taxes associated with all adjustments used to calculate EAD. Three Months Ended $ in millions 12/31/2022 09/30/2022 GAAP net income (loss) $(44) $(50) Adjustments: Investment fair value changes, net(1) $24 $58 Change in economic basis of investments(2) 6 2 Realized (gains)/losses, net(3) (3) — Acquisition related expenses(4) 3 4 Organizational restructuring charges(5) 3 4 Tax effect of adjustments(6) (2) 2 Earnings Available for Distribution (non-GAAP) $(12) $19 Earnings (loss) per basic common share $(0.40) $(0.44) EAD per basic common share (non-GAAP) $(0.11) $0.16
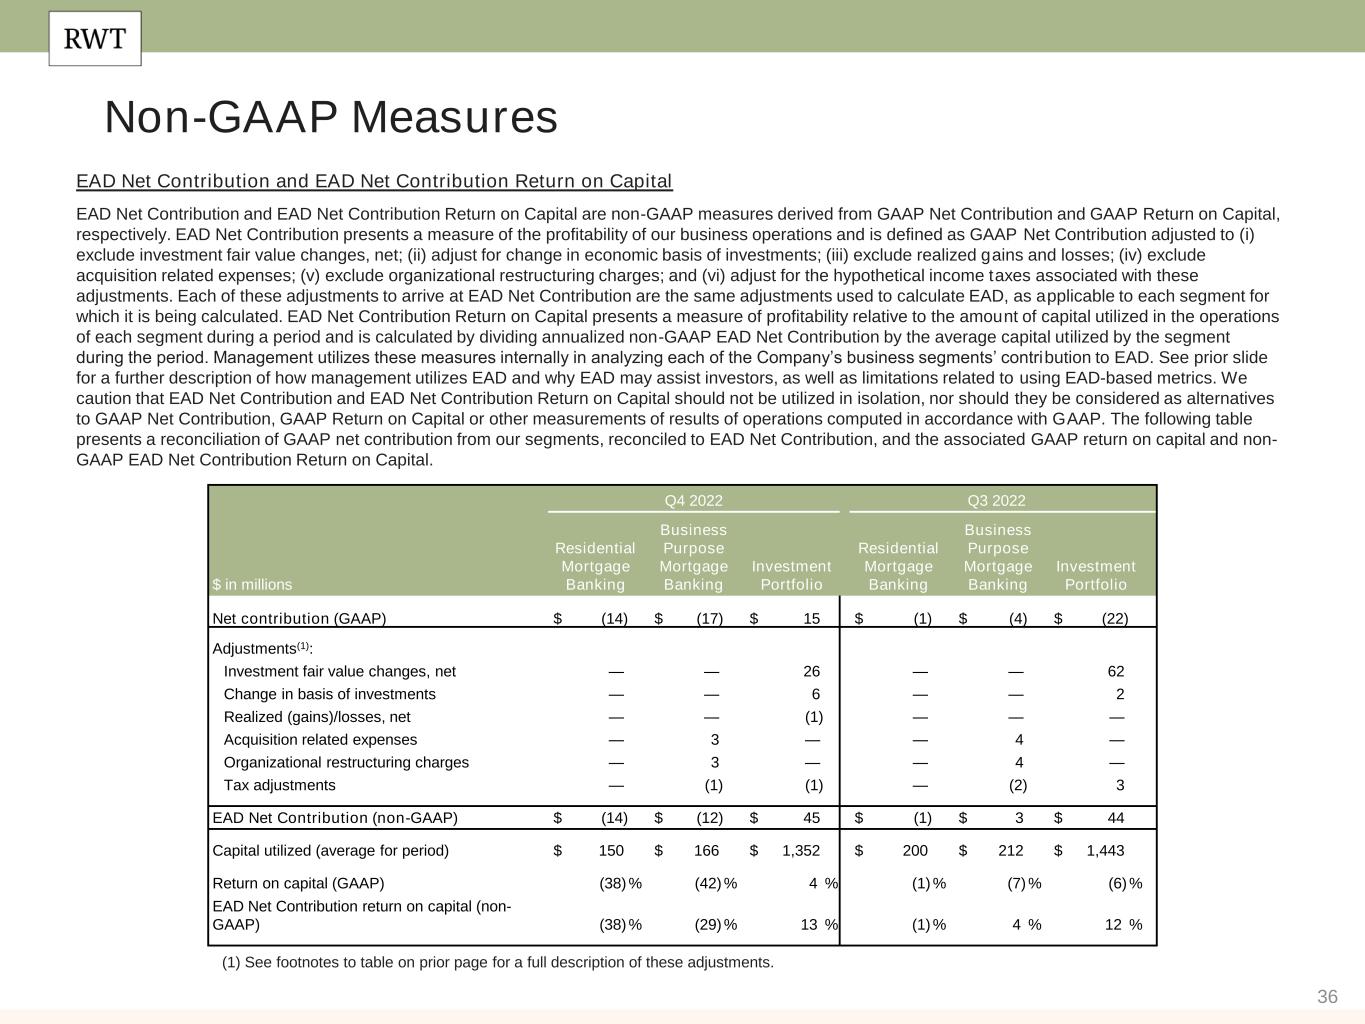
36 Non-GAAP Measures EAD Net Contribution and EAD Net Contribution Return on Capital EAD Net Contribution and EAD Net Contribution Return on Capital are non-GAAP measures derived from GAAP Net Contribution and GAAP Return on Capital, respectively. EAD Net Contribution presents a measure of the profitability of our business operations and is defined as GAAP Net Contribution adjusted to (i) exclude investment fair value changes, net; (ii) adjust for change in economic basis of investments; (iii) exclude realized gains and losses; (iv) exclude acquisition related expenses; (v) exclude organizational restructuring charges; and (vi) adjust for the hypothetical income taxes associated with these adjustments. Each of these adjustments to arrive at EAD Net Contribution are the same adjustments used to calculate EAD, as applicable to each segment for which it is being calculated. EAD Net Contribution Return on Capital presents a measure of profitability relative to the amount of capital utilized in the operations of each segment during a period and is calculated by dividing annualized non-GAAP EAD Net Contribution by the average capital utilized by the segment during the period. Management utilizes these measures internally in analyzing each of the Company’s business segments’ contribution to EAD. See prior slide for a further description of how management utilizes EAD and why EAD may assist investors, as well as limitations related to using EAD-based metrics. We caution that EAD Net Contribution and EAD Net Contribution Return on Capital should not be utilized in isolation, nor should they be considered as alternatives to GAAP Net Contribution, GAAP Return on Capital or other measurements of results of operations computed in accordance with GAAP. The following table presents a reconciliation of GAAP net contribution from our segments, reconciled to EAD Net Contribution, and the associated GAAP return on capital and non- GAAP EAD Net Contribution Return on Capital. Q4 2022 Q3 2022 $ in millions Residential Mortgage Banking Business Purpose Mortgage Banking Investment Portfolio Residential Mortgage Banking Business Purpose Mortgage Banking Investment Portfolio Net contribution (GAAP) $ (14) $ (17) $ 15 $ (1) $ (4) $ (22) Adjustments(1): Investment fair value changes, net — — 26 — — 62 Change in basis of investments — — 6 — — 2 Realized (gains)/losses, net — — (1) — — — Acquisition related expenses — 3 — — 4 — Organizational restructuring charges — 3 — — 4 — Tax adjustments — (1) (1) — (2) 3 EAD Net Contribution (non-GAAP) $ (14) $ (12) $ 45 $ (1) $ 3 $ 44 Capital utilized (average for period) $ 150 $ 166 $ 1,352 $ 200 $ 212 $ 1,443 Return on capital (GAAP) (38) % (42) % 4 % (1) % (7) % (6) % EAD Net Contribution return on capital (non- GAAP) (38) % (29) % 13 % (1) % 4 % 12 % (1) See footnotes to table on prior page for a full description of these adjustments.
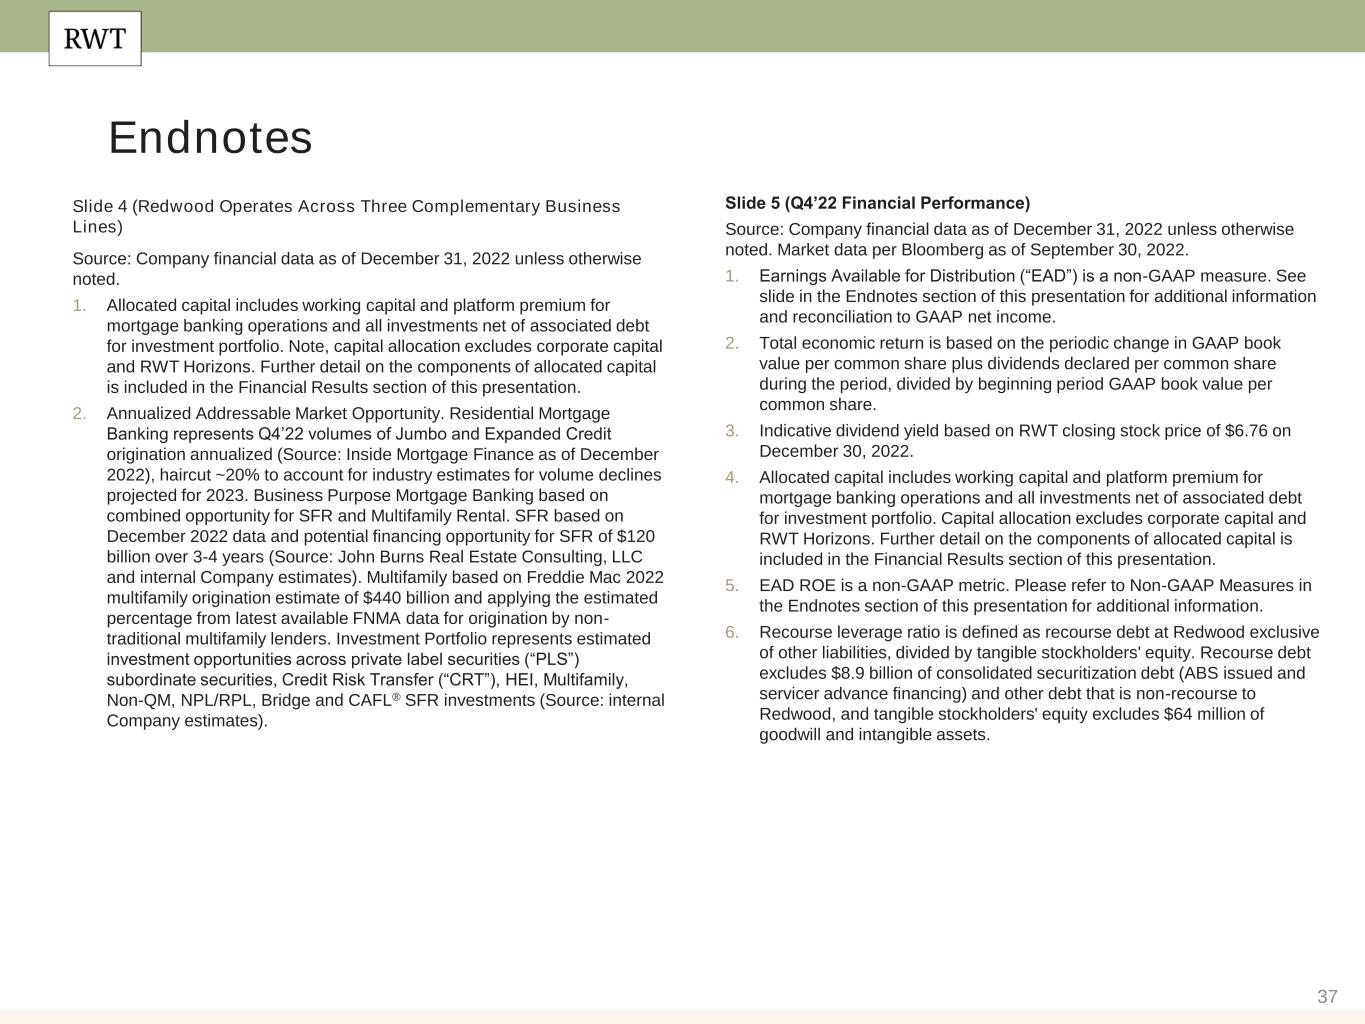
37 Slide 4 (Redwood Operates Across Three Complementary Business Lines) Source: Company financial data as of December 31, 2022 unless otherwise noted. 1. Allocated capital includes working capital and platform premium for mortgage banking operations and all investments net of associated debt for investment portfolio. Note, capital allocation excludes corporate capital and RWT Horizons. Further detail on the components of allocated capital is included in the Financial Results section of this presentation. 2. Annualized Addressable Market Opportunity. Residential Mortgage Banking represents Q4’22 volumes of Jumbo and Expanded Credit origination annualized (Source: Inside Mortgage Finance as of December 2022), haircut ~20% to account for industry estimates for volume declines projected for 2023. Business Purpose Mortgage Banking based on combined opportunity for SFR and Multifamily Rental. SFR based on December 2022 data and potential financing opportunity for SFR of $120 billion over 3-4 years (Source: John Burns Real Estate Consulting, LLC and internal Company estimates). Multifamily based on Freddie Mac 2022 multifamily origination estimate of $440 billion and applying the estimated percentage from latest available FNMA data for origination by non- traditional multifamily lenders. Investment Portfolio represents estimated investment opportunities across private label securities (“PLS”) subordinate securities, Credit Risk Transfer (“CRT”), HEI, Multifamily, Non-QM, NPL/RPL, Bridge and CAFL® SFR investments (Source: internal Company estimates). Endnotes Slide 5 (Q4’22 Financial Performance) Source: Company financial data as of December 31, 2022 unless otherwise noted. Market data per Bloomberg as of September 30, 2022. 1. Earnings Available for Distribution (“EAD”) is a non-GAAP measure. See slide in the Endnotes section of this presentation for additional information and reconciliation to GAAP net income. 2. Total economic return is based on the periodic change in GAAP book value per common share plus dividends declared per common share during the period, divided by beginning period GAAP book value per common share. 3. Indicative dividend yield based on RWT closing stock price of $6.76 on December 30, 2022. 4. Allocated capital includes working capital and platform premium for mortgage banking operations and all investments net of associated debt for investment portfolio. Capital allocation excludes corporate capital and RWT Horizons. Further detail on the components of allocated capital is included in the Financial Results section of this presentation. 5. EAD ROE is a non-GAAP metric. Please refer to Non-GAAP Measures in the Endnotes section of this presentation for additional information. 6. Recourse leverage ratio is defined as recourse debt at Redwood exclusive of other liabilities, divided by tangible stockholders' equity. Recourse debt excludes $8.9 billion of consolidated securitization debt (ABS issued and servicer advance financing) and other debt that is non-recourse to Redwood, and tangible stockholders' equity excludes $64 million of goodwill and intangible assets.
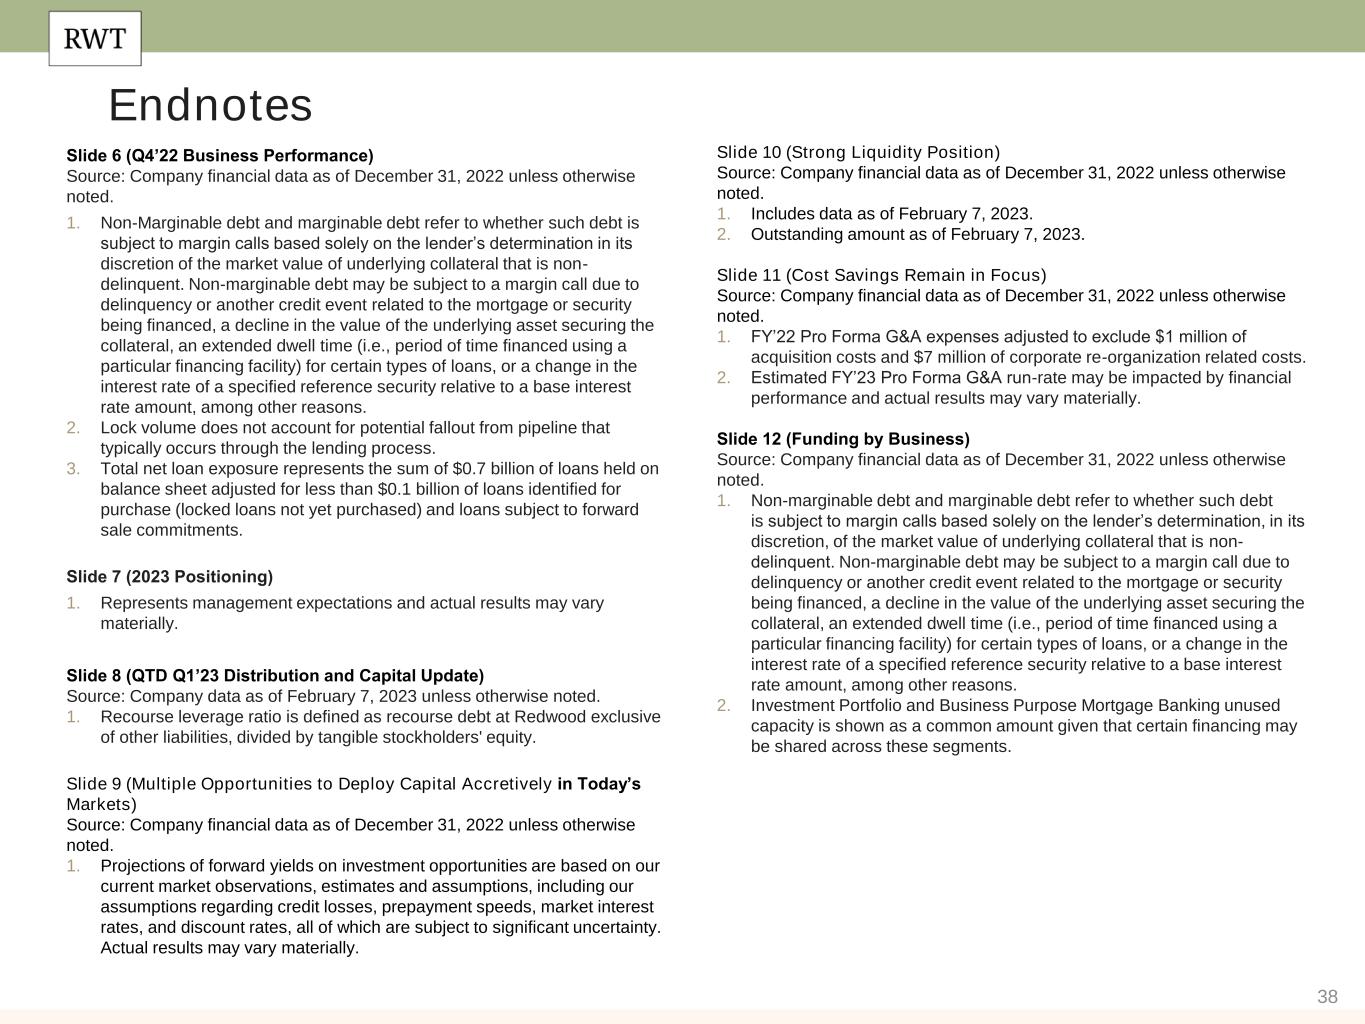
38 Endnotes Slide 6 (Q4’22 Business Performance) Source: Company financial data as of December 31, 2022 unless otherwise noted. 1. Non-Marginable debt and marginable debt refer to whether such debt is subject to margin calls based solely on the lender’s determination in its discretion of the market value of underlying collateral that is non- delinquent. Non-marginable debt may be subject to a margin call due to delinquency or another credit event related to the mortgage or security being financed, a decline in the value of the underlying asset securing the collateral, an extended dwell time (i.e., period of time financed using a particular financing facility) for certain types of loans, or a change in the interest rate of a specified reference security relative to a base interest rate amount, among other reasons. 2. Lock volume does not account for potential fallout from pipeline that typically occurs through the lending process. 3. Total net loan exposure represents the sum of $0.7 billion of loans held on balance sheet adjusted for less than $0.1 billion of loans identified for purchase (locked loans not yet purchased) and loans subject to forward sale commitments. Slide 7 (2023 Positioning) 1. Represents management expectations and actual results may vary materially. Slide 8 (QTD Q1’23 Distribution and Capital Update) Source: Company data as of February 7, 2023 unless otherwise noted. 1. Recourse leverage ratio is defined as recourse debt at Redwood exclusive of other liabilities, divided by tangible stockholders' equity. Slide 9 (Multiple Opportunities to Deploy Capital Accretively in Today’s Markets) Source: Company financial data as of December 31, 2022 unless otherwise noted. 1. Projections of forward yields on investment opportunities are based on our current market observations, estimates and assumptions, including our assumptions regarding credit losses, prepayment speeds, market interest rates, and discount rates, all of which are subject to significant uncertainty. Actual results may vary materially. Slide 10 (Strong Liquidity Position) Source: Company financial data as of December 31, 2022 unless otherwise noted. 1. Includes data as of February 7, 2023. 2. Outstanding amount as of February 7, 2023. Slide 11 (Cost Savings Remain in Focus) Source: Company financial data as of December 31, 2022 unless otherwise noted. 1. FY’22 Pro Forma G&A expenses adjusted to exclude $1 million of acquisition costs and $7 million of corporate re-organization related costs. 2. Estimated FY’23 Pro Forma G&A run-rate may be impacted by financial performance and actual results may vary materially. Slide 12 (Funding by Business) Source: Company financial data as of December 31, 2022 unless otherwise noted. 1. Non-marginable debt and marginable debt refer to whether such debt is subject to margin calls based solely on the lender’s determination, in its discretion, of the market value of underlying collateral that is non- delinquent. Non-marginable debt may be subject to a margin call due to delinquency or another credit event related to the mortgage or security being financed, a decline in the value of the underlying asset securing the collateral, an extended dwell time (i.e., period of time financed using a particular financing facility) for certain types of loans, or a change in the interest rate of a specified reference security relative to a base interest rate amount, among other reasons. 2. Investment Portfolio and Business Purpose Mortgage Banking unused capacity is shown as a common amount given that certain financing may be shared across these segments.
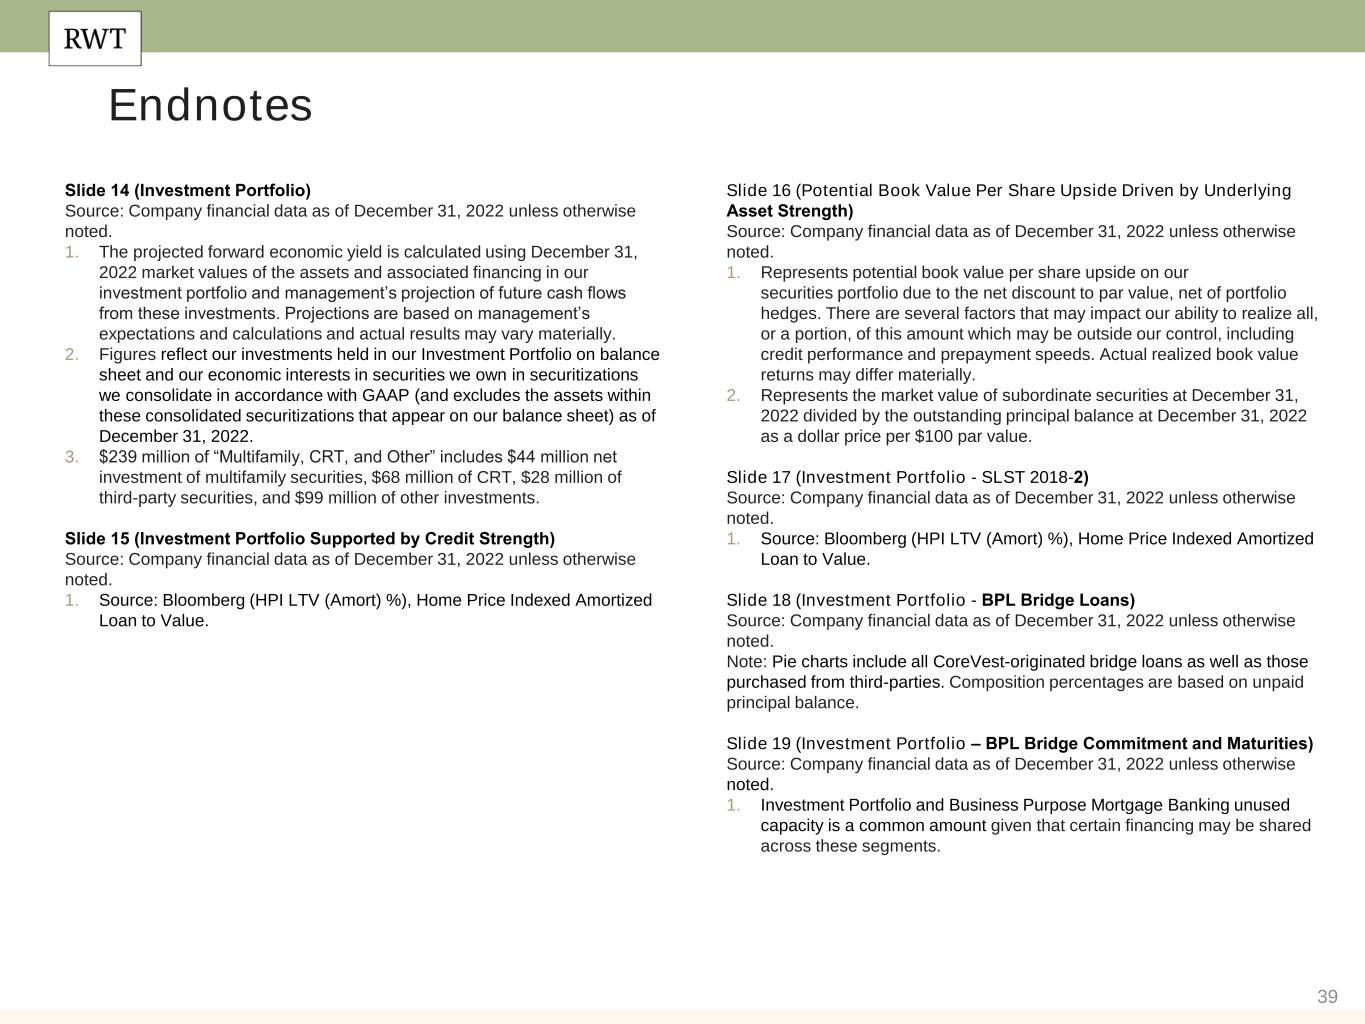
39 Endnotes Slide 16 (Potential Book Value Per Share Upside Driven by Underlying Asset Strength) Source: Company financial data as of December 31, 2022 unless otherwise noted. 1. Represents potential book value per share upside on our securities portfolio due to the net discount to par value, net of portfolio hedges. There are several factors that may impact our ability to realize all, or a portion, of this amount which may be outside our control, including credit performance and prepayment speeds. Actual realized book value returns may differ materially. 2. Represents the market value of subordinate securities at December 31, 2022 divided by the outstanding principal balance at December 31, 2022 as a dollar price per $100 par value. Slide 17 (Investment Portfolio - SLST 2018-2) Source: Company financial data as of December 31, 2022 unless otherwise noted. 1. Source: Bloomberg (HPI LTV (Amort) %), Home Price Indexed Amortized Loan to Value. Slide 18 (Investment Portfolio - BPL Bridge Loans) Source: Company financial data as of December 31, 2022 unless otherwise noted. Note: Pie charts include all CoreVest-originated bridge loans as well as those purchased from third-parties. Composition percentages are based on unpaid principal balance. Slide 19 (Investment Portfolio – BPL Bridge Commitment and Maturities) Source: Company financial data as of December 31, 2022 unless otherwise noted. 1. Investment Portfolio and Business Purpose Mortgage Banking unused capacity is a common amount given that certain financing may be shared across these segments. Slide 14 (Investment Portfolio) Source: Company financial data as of December 31, 2022 unless otherwise noted. 1. The projected forward economic yield is calculated using December 31, 2022 market values of the assets and associated financing in our investment portfolio and management’s projection of future cash flows from these investments. Projections are based on management’s expectations and calculations and actual results may vary materially. 2. Figures reflect our investments held in our Investment Portfolio on balance sheet and our economic interests in securities we own in securitizations we consolidate in accordance with GAAP (and excludes the assets within these consolidated securitizations that appear on our balance sheet) as of December 31, 2022. 3. $239 million of “Multifamily, CRT, and Other” includes $44 million net investment of multifamily securities, $68 million of CRT, $28 million of third-party securities, and $99 million of other investments. Slide 15 (Investment Portfolio Supported by Credit Strength) Source: Company financial data as of December 31, 2022 unless otherwise noted. 1. Source: Bloomberg (HPI LTV (Amort) %), Home Price Indexed Amortized Loan to Value.
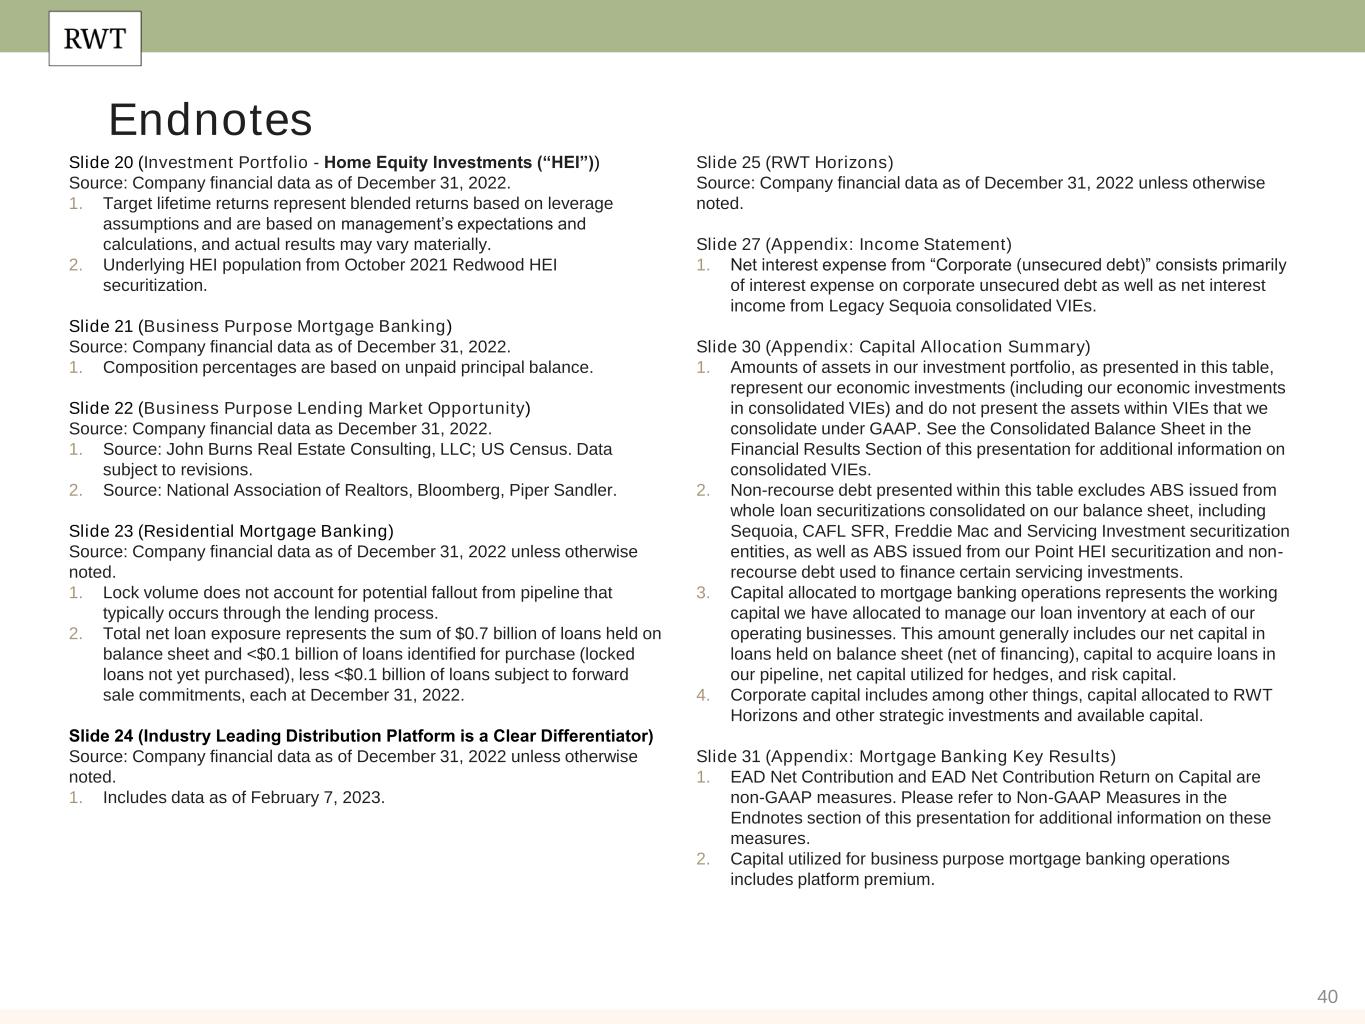
40 Endnotes Slide 20 (Investment Portfolio - Home Equity Investments (“HEI”)) Source: Company financial data as of December 31, 2022. 1. Target lifetime returns represent blended returns based on leverage assumptions and are based on management’s expectations and calculations, and actual results may vary materially. 2. Underlying HEI population from October 2021 Redwood HEI securitization. Slide 21 (Business Purpose Mortgage Banking) Source: Company financial data as of December 31, 2022. 1. Composition percentages are based on unpaid principal balance. Slide 22 (Business Purpose Lending Market Opportunity) Source: Company financial data as December 31, 2022. 1. Source: John Burns Real Estate Consulting, LLC; US Census. Data subject to revisions. 2. Source: National Association of Realtors, Bloomberg, Piper Sandler. Slide 23 (Residential Mortgage Banking) Source: Company financial data as of December 31, 2022 unless otherwise noted. 1. Lock volume does not account for potential fallout from pipeline that typically occurs through the lending process. 2. Total net loan exposure represents the sum of $0.7 billion of loans held on balance sheet and <$0.1 billion of loans identified for purchase (locked loans not yet purchased), less <$0.1 billion of loans subject to forward sale commitments, each at December 31, 2022. Slide 24 (Industry Leading Distribution Platform is a Clear Differentiator) Source: Company financial data as of December 31, 2022 unless otherwise noted. 1. Includes data as of February 7, 2023. Slide 25 (RWT Horizons) Source: Company financial data as of December 31, 2022 unless otherwise noted. Slide 27 (Appendix: Income Statement) 1. Net interest expense from “Corporate (unsecured debt)” consists primarily of interest expense on corporate unsecured debt as well as net interest income from Legacy Sequoia consolidated VIEs. Slide 30 (Appendix: Capital Allocation Summary) 1. Amounts of assets in our investment portfolio, as presented in this table, represent our economic investments (including our economic investments in consolidated VIEs) and do not present the assets within VIEs that we consolidate under GAAP. See the Consolidated Balance Sheet in the Financial Results Section of this presentation for additional information on consolidated VIEs. 2. Non-recourse debt presented within this table excludes ABS issued from whole loan securitizations consolidated on our balance sheet, including Sequoia, CAFL SFR, Freddie Mac and Servicing Investment securitization entities, as well as ABS issued from our Point HEI securitization and non- recourse debt used to finance certain servicing investments. 3. Capital allocated to mortgage banking operations represents the working capital we have allocated to manage our loan inventory at each of our operating businesses. This amount generally includes our net capital in loans held on balance sheet (net of financing), capital to acquire loans in our pipeline, net capital utilized for hedges, and risk capital. 4. Corporate capital includes among other things, capital allocated to RWT Horizons and other strategic investments and available capital. Slide 31 (Appendix: Mortgage Banking Key Results) 1. EAD Net Contribution and EAD Net Contribution Return on Capital are non-GAAP measures. Please refer to Non-GAAP Measures in the Endnotes section of this presentation for additional information on these measures. 2. Capital utilized for business purpose mortgage banking operations includes platform premium.
41 Endnotes Slide 32 (Appendix: Investment Portfolio Key Results) 1. EAD Net Contribution and EAD Net Contribution Return on Capital are non-GAAP measures. Please refer to Non-GAAP Measures in in our Endnotes for more information. 2. Leverage ratio is calculated as Secured debt balances divided by capital invested, as presented within this table. Recourse Leverage ratio is calculated as Recourse Secured debt balances divided by Capital invested, as presented within this table. Slide 33 (Appendix: Recourse Debt Balances) 1. Non-recourse debt presented within this table excludes ABS issued from whole loan securitizations consolidated on our balance sheet, including Sequoia, CAFL SFR, Freddie Mac and Servicing Investment securitization entities, as well as ABS issued from our Point HEI securitization and non-recourse debt used to finance certain servicing investments. 2. Non-Marginable debt and marginable debt refers to whether such debt is subject to margin calls based solely on the lender’s determination in its discretion of the market value of underlying collateral that is non- delinquent. Non-marginable debt may be subject to a margin call due to delinquency or another credit event related to the mortgage or security being financed, a decline in the value of the underlying asset securing the collateral, an extended dwell time (i.e., period of time financed using a particular financing facility) for certain types of loans, or a change in the interest rate of a specified reference security relative to a base interest rate amount, among other reasons. 3. Average borrowing cost represents the weighted average contractual cost of recourse debt outstanding at the end of each period presented and does not include deferred issuance costs or debt discounts.